A note on lower timeframe confirming price action…
Waiting for lower timeframe confirmation is our main tool to confirm strength within higher timeframe zones, and has really been the key to our trading success. It takes a little time to understand the subtle nuances, however, as each trade is never the same, but once you master the rhythm so to speak, you will be saved from countless unnecessary losing trades. The following is a list of what we look for:
- A break/retest of supply or demand dependent on which way you’re trading.
- A trendline break/retest.
- Buying/selling tails/wicks – essentially we look for a cluster of very obvious spikes off of lower timeframe support and resistance levels within the higher timeframe zone.
- Candlestick patterns. We tend to stick with pin bars and engulfing bars as these have proven to be the most effective.
We search for lower timeframe confirmation between the M15 and H1 timeframes, since most of our higher-timeframe areas begin with the H4. Stops are usually placed 3-5 pips beyond confirming structures.
EUR/USD:
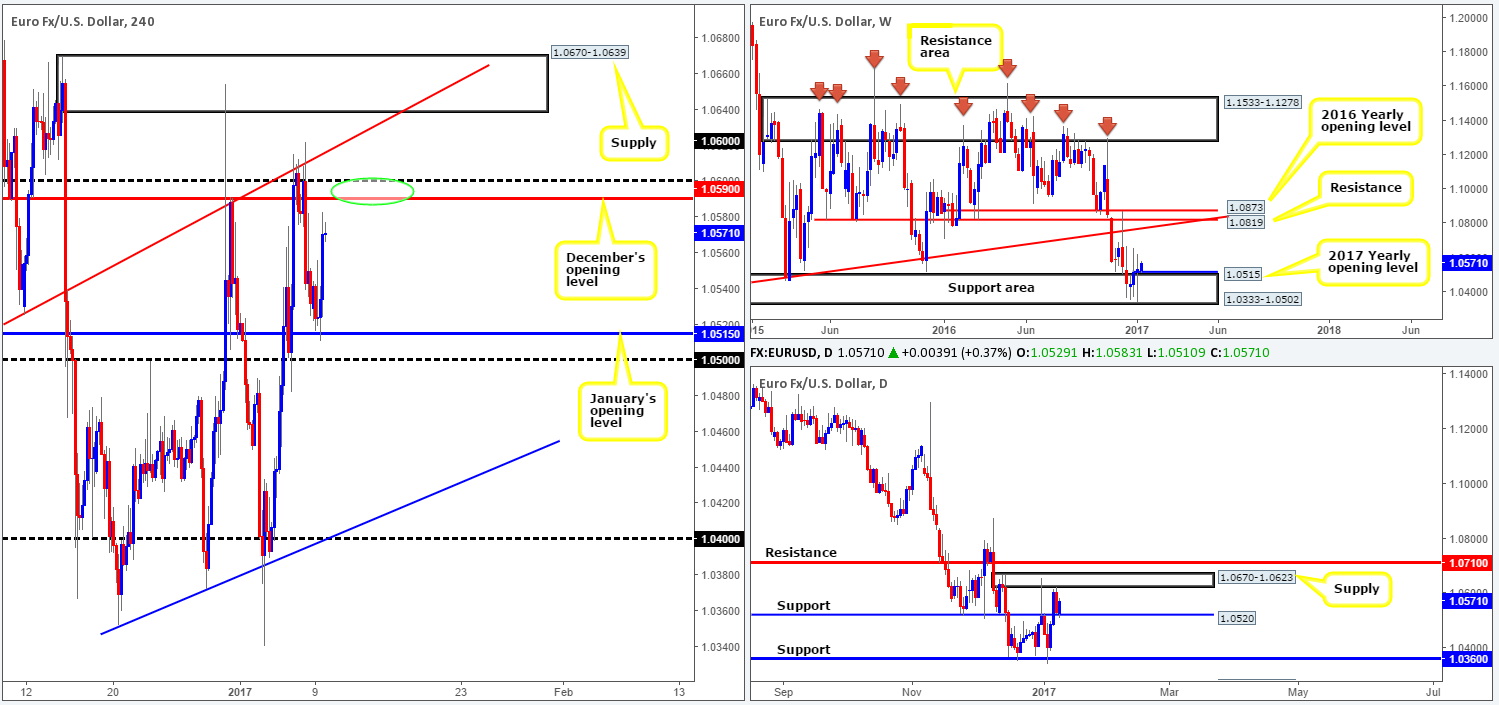
For those who read our previous report on the EUR you may recall that we underscored the 1.05/1.0515 region on the H4 chart as a noteworthy area for a bounce north. As you can see, in this instance, we were correct and price has rotated nicely. This H4 base was not only reinforced by a daily support at 1.0520, but also the top edge of a weekly support area at 1.0502. Having unfortunately missed this setup, we’re kicking ourselves since there was a perfect opportunity to jump in long following a reasonable sized H4 bull candle that formed amid the US open! Well done to any of our readers who managed to jump aboard this train!
Since price is now lurking within striking distance of December’s opening level at 1.0590, which is shadowed closely by the 1.06 handle, our desk is reluctant to look for further buying opportunities at this time.
Our suggestions: A bounce south from the said 1.06/1.0590 H4 region on the other hand could be something to look out for over the next few H4 candles (see green circle). However, we would advise caution. Setting pending orders at this juncture could potentially open one up to the possibility of a fakeout. Round numbers typically house a mountain of stop orders at close proximity, hence why these levels are generally prone to fakeouts. An alternative approach would be to consider waiting for a reasonably sized H4 bearish candle to take shape. This, of course, will in no means guarantee a winning trade, but what it will do is alert the trader to seller interest. In addition to the possibility of a fakeout, one may also want to note that this level, while it will likely bounce price, is not supported by higher-timeframe structure. The closest base that we’ve noted is the underside of daily supply seen 23 pips above at 1.0623.
Data points to consider: There are no scheduled high-impacting news events on the docket today relating to these two markets.
Levels to watch/live orders:
- Buys: Flat (stop loss: N/A).
- Sells: 1.06/1.0590 ([reasonably sized H4 bearish close required prior to pulling the trigger] stop loss: ideally beyond the trigger candle).
GBP/USD:
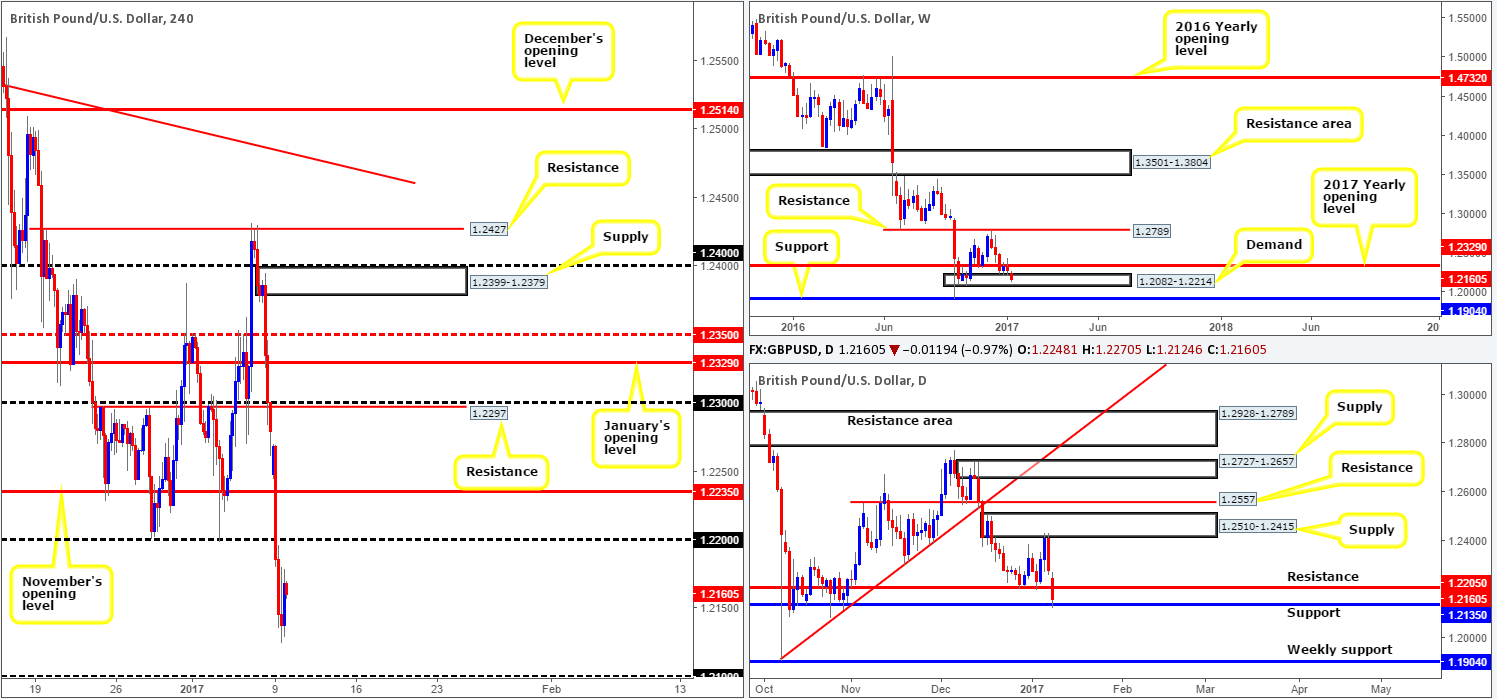
Following comments made by British Prime Minister Theresa May on Sunday concerning the Brexit deal, the GBP took yet another hit to the mid-section over recent sessions. As a result, the current weekly candle is now seen trading reasonably deep within weekly demand at 1.2082-1.2214. A break below this structure could prompt further downside to weekly support coming in at 1.1904. Stepping down to the daily chart, we can also see that recent news forced price through bids around daily support at 1.2205 (now acting resistance) and went on to shake hands with daily support drawn from 1.2135.
Looking over to the H4 chart, recent movement has placed the H4 candles in the middle of two psychological barriers: 1.22/1.21. With weekly demand now in play along with a daily support (see above), we’re more drawn to the 1.21 barrier for buy trades at this time.
Our suggestions: Some traders may still find the 1.22 band attractive, nevertheless, seeing as how it converges with daily resistance at 1.2205. However, for us at least, this would be considered a risky sell in light of where weekly price is currently positioned. As such, our attention will mostly be driven toward looking for longs from 1.21, preferably supported by a reasonably sized H4 bullish candle.
Data points to consider: There are no scheduled high-impacting news events on the docket today relating to these two markets.
Levels to watch/live orders:
- Buys: 1.21 region ([reasonably sized H4 bullish close required prior to pulling the trigger] stop loss: ideally beyond the trigger candle).
- Sells: Flat (stop loss: N/A).
AUD/USD:
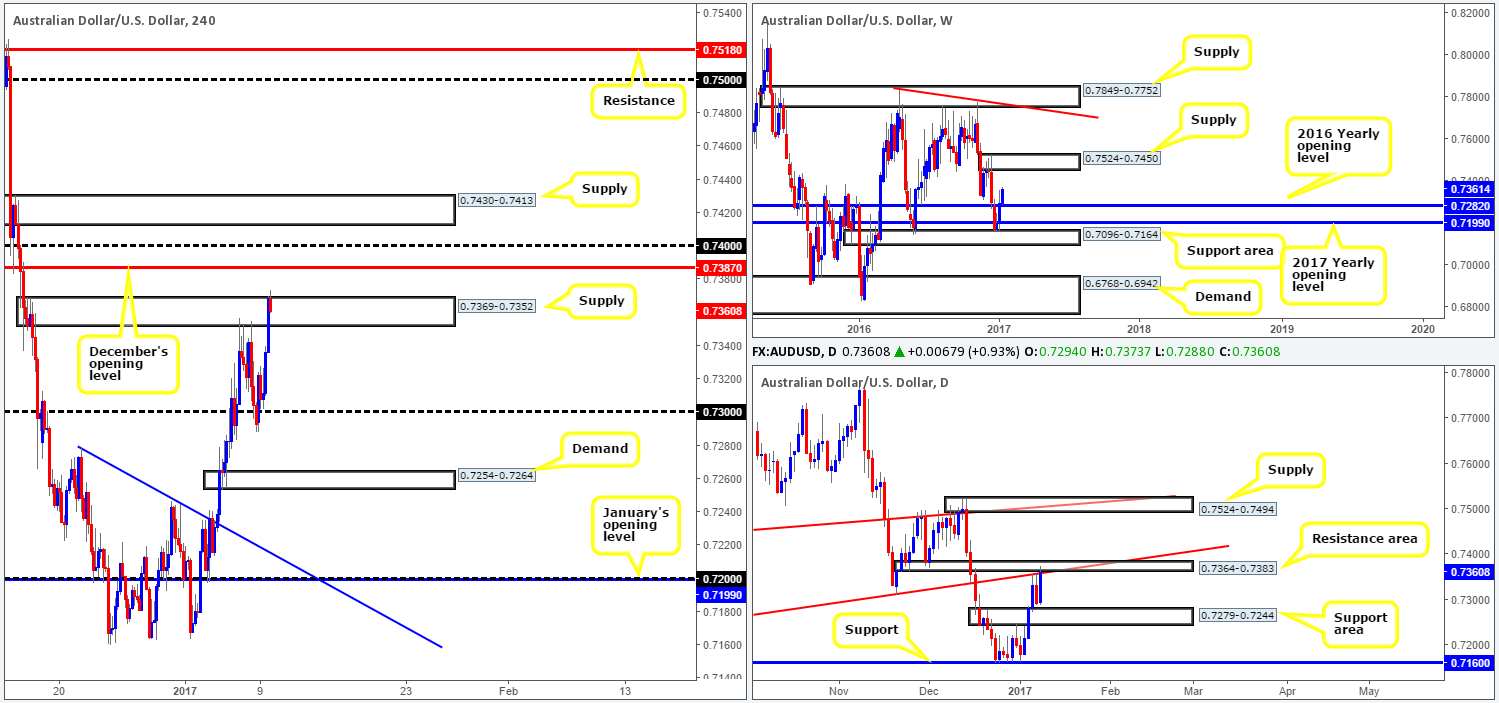
The Aussie dollar clearly benefitted from a weaker dollar in recent sessions, bidding price up to, and slightly beyond H4 supply at 0.7369-0.7352. According to weekly structure, there is still generous room for the bulls to stretch their legs this week up to weekly supply seen at 0.7524-0.7450. On the other side of the field, however, the daily chart depicts a slightly different picture. Recent bids pushed the current daily candle up into a daily resistance area drawn from 0.7364-0.7383, which, as you can probably see, is strengthened by a daily trendline resistance stretched from the low 0.7145.
This begs the question, where does one go from here? Well, looking to short from the current H4 supply or even the nearby December opening level at 0.7387 could be something to think on given this region, as already highlighted above, is supported by a daily resistance area. Nevertheless, this goes AGAINST potential weekly buyers (see above) so the probability of a successful trade here is weakened, in our opinion.
Our suggestion: Based on the above points, the team has come to a general consensus that neither a buy nor sell is attractive at this present time. For this reason, we’re opting to remain flat and will look to reassess in the coming sessions post news (see below).
Data points to consider: Aussie retail sales data at 12.30am, followed by Chinese inflation an hour later at 1.30am GMT.
Levels to watch/live orders:
- Buys: Flat (stop loss: N/A).
- Sells: Flat (stop loss: N/A).
USD/JPY:
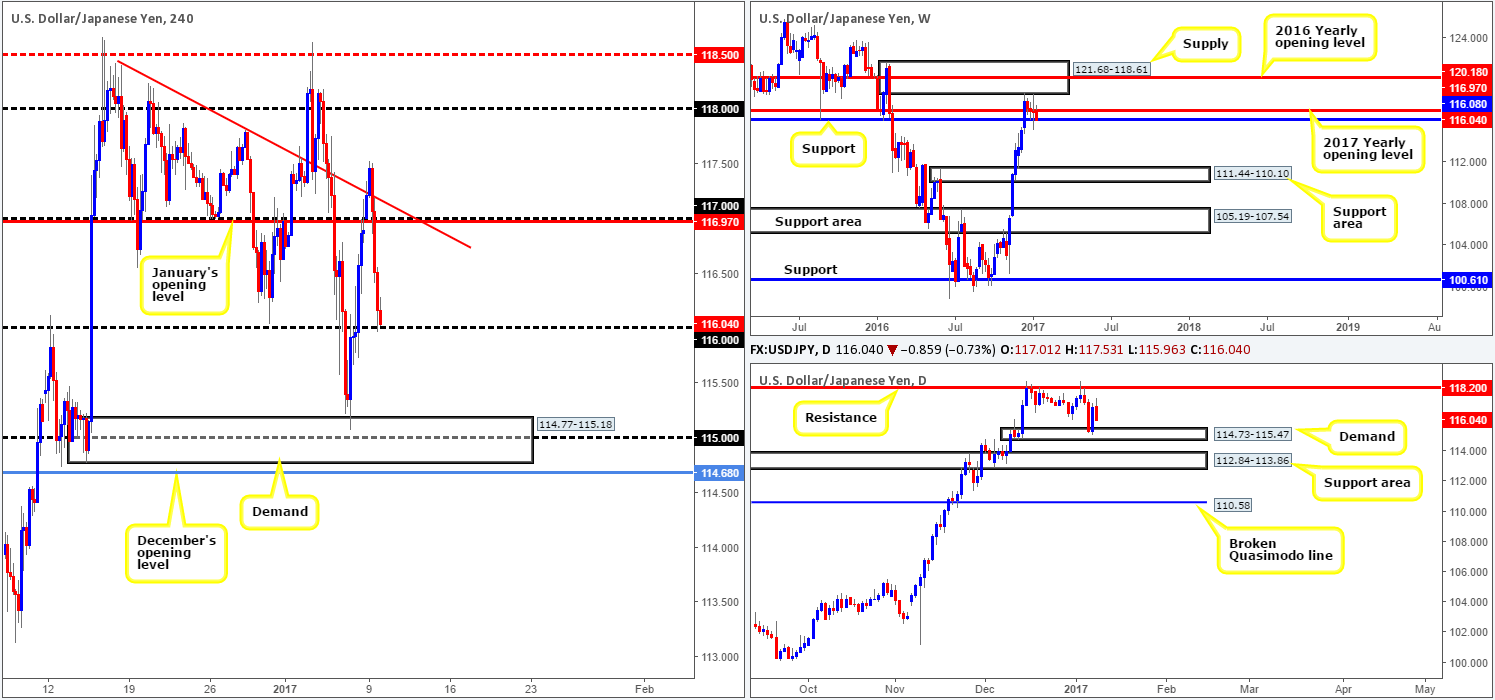
With the dollar recently losing ground against most of its traded pairs (see the US dollar index), it was no surprise to see the USD/JPY follow suit. Following an aggressive two-(H4) candle whipsaw through a H4 trendline taken from the high 118.40, the unit crashed below both January’s opening level at 116.97 and nearby psychological band 117. This, as can be seen from the chart, only intensified selling momentum from thereon bringing price down to the 116 handle going into the London close.
While the buyers and sellers slug it out around the 116 band, it’s our job to decide on the next probable move! Looking at the H4, a close below 116 would likely place the H4 demand at 114.77-115.18 in the firing range. Still, let’s be mindful to the fact that weekly action is trading from a weekly support at 116.08, as well as daily price lurking within shouting distance of a daily demand base seen at 114.73-115.47.
Our suggestions: Direction, at least for the time being, is a little foggy. With the above (rather risky) short setup in mind, let’s take a look at why longs from 116 are also problematic. A buy from 116 is appealing given its connection to weekly support at 116.08, but there’s a palpable risk of a fakeout through 1.06 being seen down to the top edge of daily demand at 115.47. By the same token, a sell on a close below 1.06 as we highlighted in the above paragraph, not only places one in a challenging position concerning risk/reward in that daily demand sits close by, it is also a huge risk to sell here when we’re sailing so close to the above noted weekly support! Thus, opting to stand on the sidelines here may very well be the best path to take for the time being.
Data points to consider: There are no scheduled high-impacting news events on the docket today relating to these two markets.
Levels to watch/live orders:
- Buys: Flat (stop loss: N/A).
- Sells: Flat (stop loss: N/A).
USD/CAD:
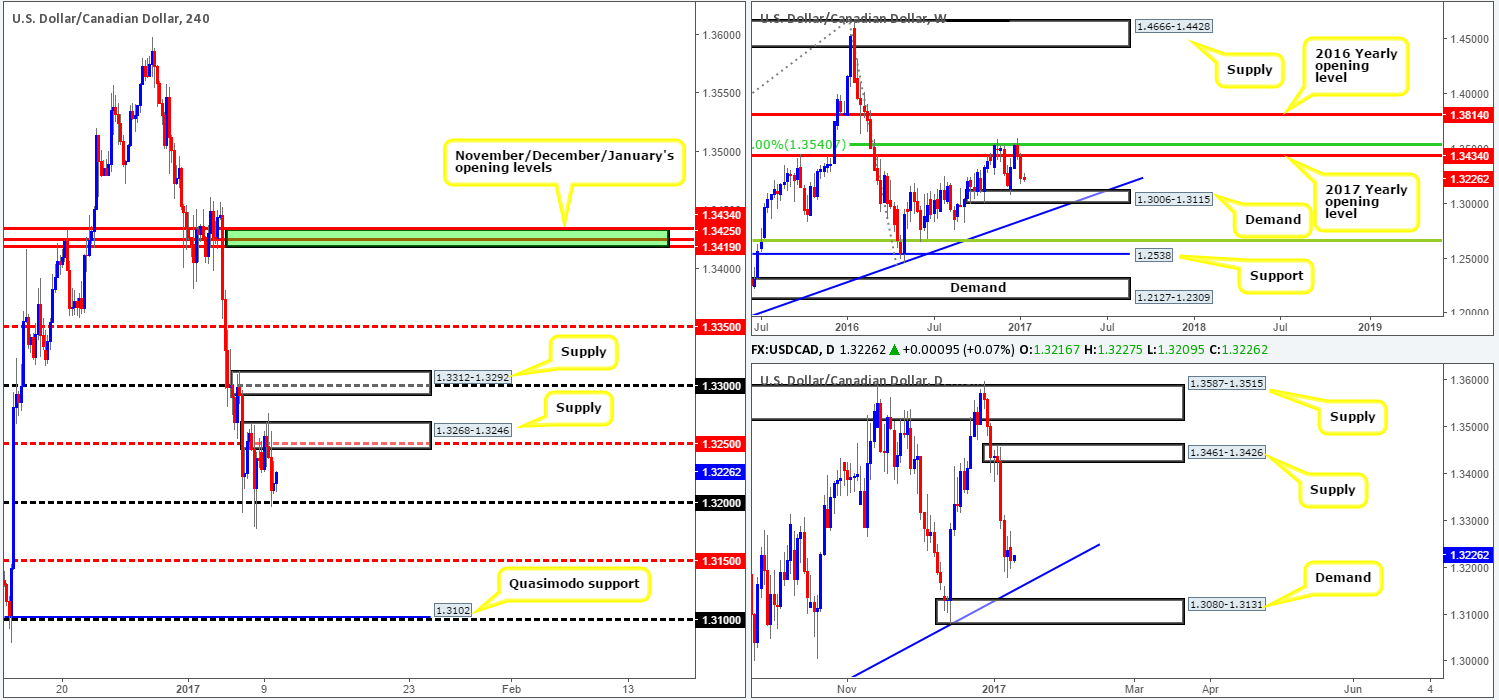
Since Thursday the USD/CAD has been fluctuating between H4 supply at 1.3268-1.3246 and the psychological boundary 1.32. Technically speaking, this could very well continue today due to the lack of economic data seen on the docket. With this being said, our desk feels the unit will eventually tumble south. Our reasoning lies within the higher-timeframe structure. Over on the weekly chart, we can see that the pair remains trading ahead of a weekly demand coming in at 1.3006-1.3115. Turning over a page to the daily chart, a similar scenario exists. Daily demand at 1.3080-1.3131, which fuses nicely with a daily trendline support extended from the low 1.2460, is currently seen within trading distance. This conveys the notion that both weekly and daily price will likely continue to selloff and, by extension, take out the 1.32 handle in the process.
Our suggestions: Wait for price to print a H4 close below the 1.32 barrier. Should this come to fruition, the next step is to wait for a retest to be seen to the underside of 1.32 followed by a lower-timeframe sell setup (see the top of this report for ideas on how to sell via the lower timeframes). As for take-profit targets, the H4 mid-way support 1.3150 would be considered an immediate zone of interest, shadowed closely by the top edge of the above said daily demand at 1.3131.
Data points to consider: There are no scheduled high-impacting news events on the docket today relating to these two markets.
Levels to watch/live orders:
- Buys: Flat (stop loss: N/A).
- Sells: Watch for a H4 close below the 1.32 handle and look to trade any retest seen thereafter ([lower timeframe confirmation is required following the retest before our team will consider pulling the trigger] stop loss: depends on where one confirms the zone).
USD/CHF:
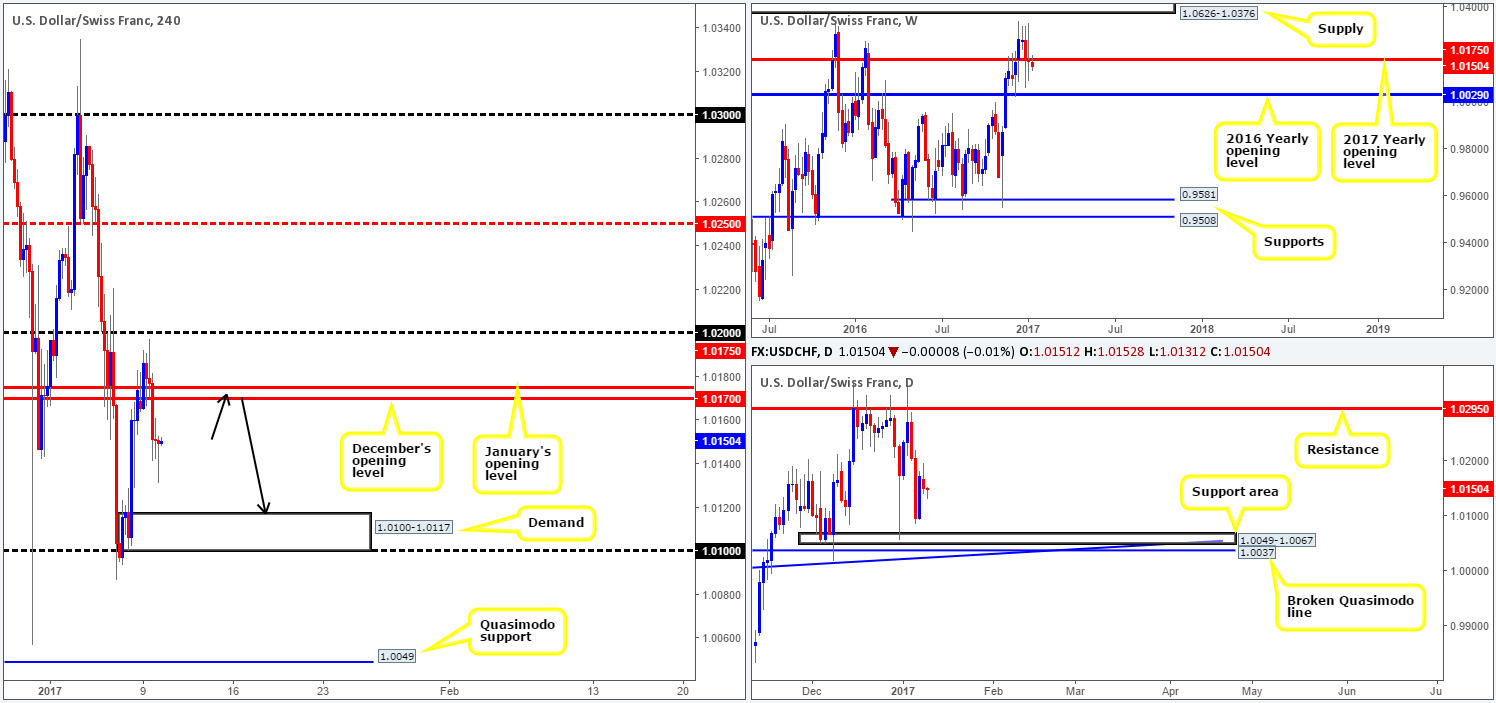
Throughout the course of yesterday’s London morning segment, the Swissy began topping ahead of the 1.02 handle. As the US opened their doors for business, however, the sellers gathered momentum and consequently took out both December and January’s opening levels, reaching lows of 1.0141 on the day. The next downside objective on the H4 chart can be seen at 1.0100-1.0117: a H4 demand zone that’s reinforced by the 1.01 handle.
Over on the bigger picture, weekly action shows room to continue pushing south at least until we reach the 2016 yearly opening level at 1.0029. On a similar note, the daily candles also show space for the pair to trade lower, with the daily support area given at 1.0049-1.0067 being the next zone of interest.
Our suggestions: When two monthly opening levels converge, as we’re seeing with December and January’s barriers, a bounce at the very least is typically seen. In the event that price retests these monthly levels as resistance today (see black arrows), traders may want to look at shorting from here. H4 demand at 1.0100-1.0117, given its strong bullish momentum, would be a logical first take-profit zone. However, according to higher-timeframe structure, we may see price break beyond this area and head for the H4 Quasimodo support at 1.0049. This would be an ideal final take-profit zone, as well as a pretty neat area to look for longs. Not only does it fuse beautifully with the top edge of the aforementioned daily support area, it is, as underscored above, also positioned nearby the 2016 yearly opening level at 1.0029.
Data points to consider: There are no scheduled high-impacting news events on the docket today relating to these two markets.
Levels to watch/live orders:
- Buys: Flat (stop loss: N/A).
- Sells: 1.0175/1.0170 ([lower-timeframe confirmation required prior to pulling the trigger in order to avoid the possibility of a fakeout given how small the sell zone is – see the top of the report for ideas on how to use this] stop loss: dependent on where one confirms the area).
DOW 30:
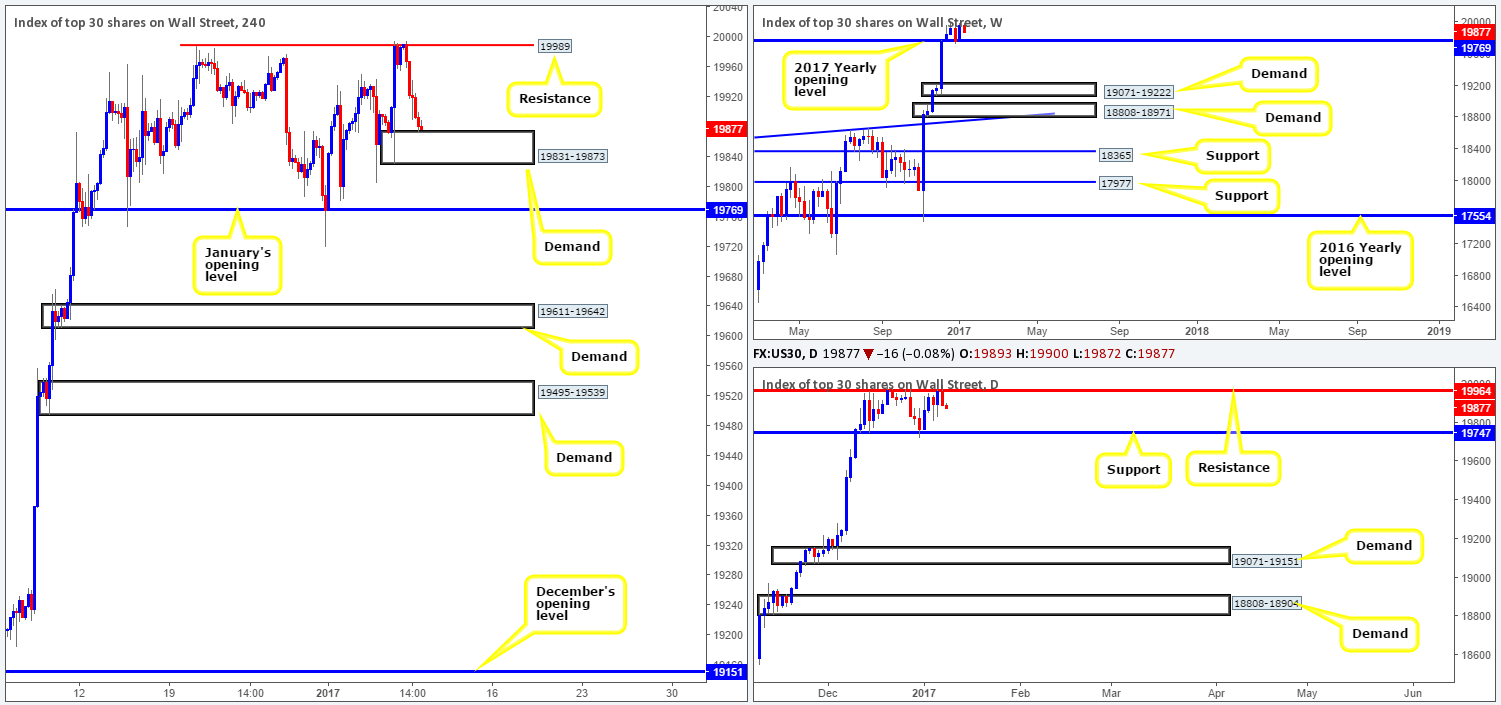
Kicking this morning’s report off with a look at the weekly chart, we can see the DOW remains in a robust position, trading above the 2017 yearly opening level at 19769. Looking down to the daily picture, however, our desk has noted that since mid-Dec 2016 equities have been trading within a phase of consolidation between daily resistance at 19964 and daily support at 19747.
Having seen yesterday’s daily candle react firmly from the top edge of the current daily range, this forced the H4 candles to connect with H4 demand at 19831-19873. Would our team consider this demand base a suitable area in which to look for buying opportunities today? Probably not. The reason, other than the recent reaction from the top limit of the daily range (see above), is simply due to how close January’s opening level is located. It may act as a magnet to price!
Our suggestions: We would not advise trading from the current H4 demand for reasons stated above. To our way of seeing things the odds are stacked against you. Of particular interest on this chart, nonetheless, is January’s opening level, which sits just above daily support at 19747. In our opinion, this is an area worthy of attention and could be somewhere traders may want to consider buying from should price touch base with this area today.
Data points to consider: There are no scheduled high-impacting news events that would likely cause strong moves in this market today.
Levels to watch/live orders:
- Buys: 19747/19769 ([lower-timeframe confirmation required prior to pulling the trigger in order to avoid the possibility of a fakeout given how small the buy zone is – see the top of the report for ideas on how to use this] stop loss: dependent on where one confirms the area).
- Sells: Flat (stop loss: N/A).
GOLD:
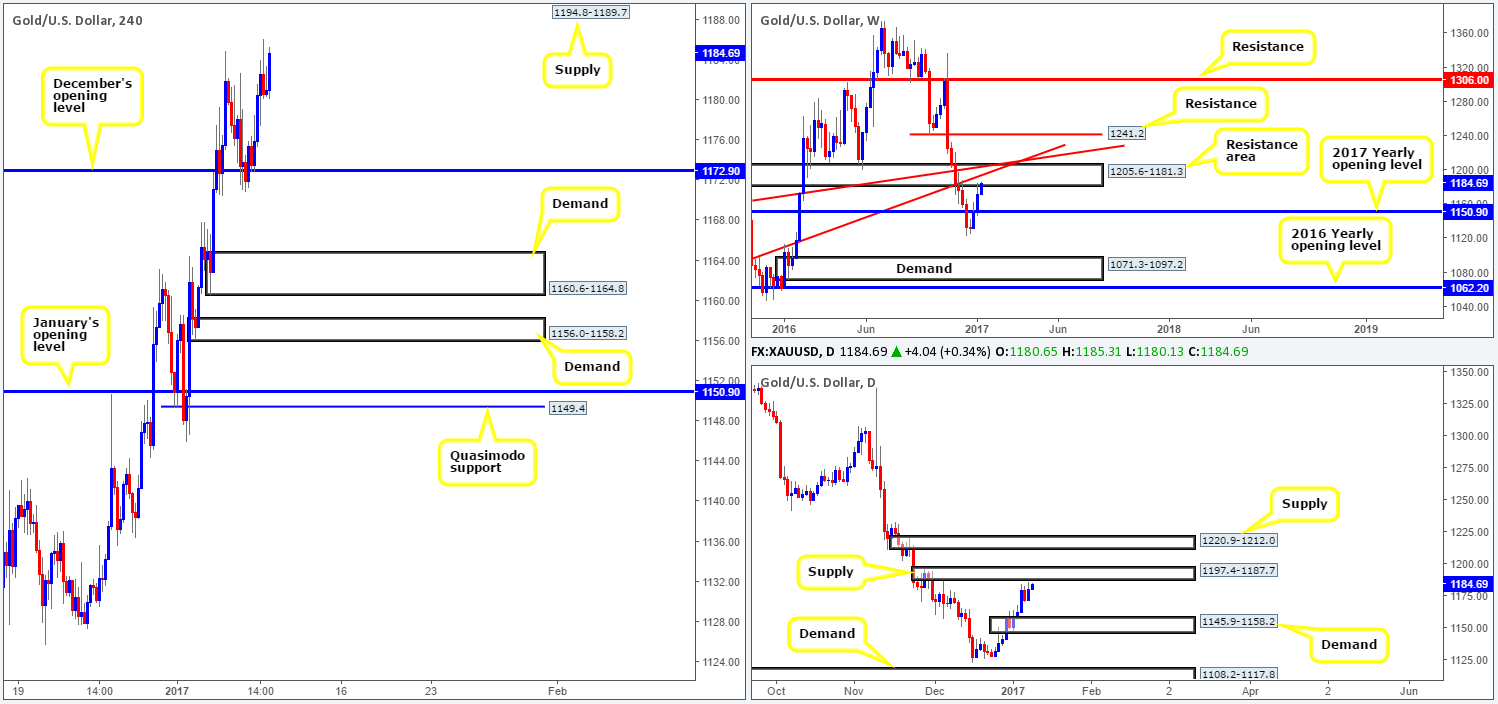
In view of weekly price now touching gloves with a major weekly resistance area drawn from 1205.6-1181.3 (that stretches as far back as mid-2015); we would refrain from taking any medium-term long positions in this market right now. In conjunction with weekly action, the daily candles are also seen trading within reaching distance of daily supply drawn from 1197.4-1187.7.
Stepping across to the H4 chart, the yellow metal shows that there’s room for price to trade north until the next H4 supply area comes into view at 1194.8-1189.7. This zone is positioned within both the aforementioned daily supply base as well as the noted weekly resistance area. As such, there’s a reasonably high probability that a reaction will be seen from this region.
Our suggestions: Based on the technicals highlighted above, our team has placed a pending sell order around the above noted H4 supply at 1189.6 with a stop-loss order set above at 1195.0. At the time of writing, it’s difficult to judge where our first take-profit target will be since the H4 approach to our zone has yet to be completed. Generally though, we look to take partial profit off the table around the nearest H4 demand formed on approach.
Levels to watch/live orders:
- Buys: Flat (stop loss: N/A).
- Sells: 1189.6 ([pending order] stop loss: 1195.0).


