EUR/USD:
Movement was mainly dictated by the USD side of the pair during the course of Monday’s segment. The DXY was lower against most majors, consequently propping up the euro.
Extending Friday’s NFP-induced gains, the EUR/USD managed to conquer the 1.23 handle and eventually April’s opening level seen on the H4 timeframe at 1.2320. Apart from nearby tops seen on the H4 timeframe around 1.2340ish (green circle), the next port of call beyond this monthly band is the 1.24 handle, followed closely by February’s opening level at 1.2417.
Over on the daily timeframe, the pair extended its bounce from a daily support area at 1.2246-1.2164, which communicated beautifully with a long-term daily trend line support etched from the low 1.0569. Continued buying from this point could eventually lead to a test of a daily Quasimodo resistance at 1.2446. Weekly flow, on the other hand, remains captive within the walls of a major-league weekly supply at 1.2569-1.2287. Downside targets from this angle fall in around the weekly support band at 1.2044, shadowed closely by the 2018 yearly opening level at 1.2004.
Potential trading zones:
Medium term, further buying could be on the cards as long as H4 price can maintain a position above 1.2320. In saying this though, traders need to keep in mind where we are currently positioned on the weekly timeframe.
Should H4 price break the aforementioned tops (clearing out sellers’ orders) and retest April’s opening level, a long could be an option, targeting 1.24 (as per the red arrows).
Data points to consider today: US PPI m/m and Core PPI m/m.

GBP/USD:
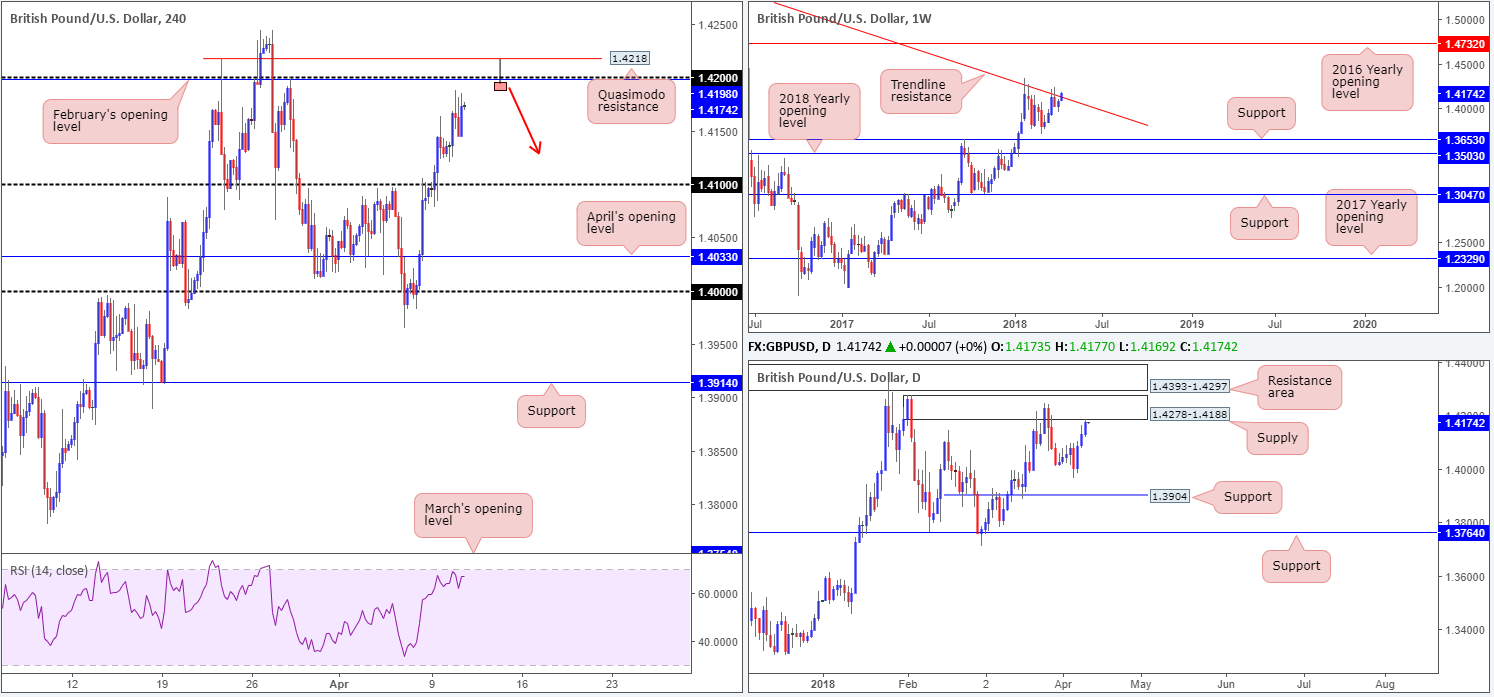
Despite an earnest attempt to hold ground beneath the 1.41 handle on Monday, a bout of USD weakness eventually propelled the unit to a high of 1.4160. Looking at this market from a H4 perspective, a retest of 1.41 as support looks appealing. Not only is there a solid base of H4 demand loitering around the underside of this number (see green arrow), there’s also support structure seen on the H4 RSI indicator around the 56.665 point.
In conjunction with H4 price, daily price shows room for the market to press as high as a daily supply zone coming in at 1.4278-1.4188. The only timeframe that seems to be throwing up a red flag is the weekly timeframe. Observe how weekly price is seen jostling with a weekly trend line resistance taken from the high 1.5930.
Potential trading zones:
Despite the threat of a selloff on the weekly timeframe, longs from 1.41 are still a possibility. To be on the safe side, though, we would strongly recommend waiting and seeing if H4 price can chalk up a full or near-full-bodied bull candle off of 1.41, before pulling the trigger. Although this will not guarantee a winning trade, what it will do is highlight whether there is buyer interest here.1.4150 could be a viable first take-profit target, followed then by the underside of daily supply at 1.4188.
Data points to consider today: MPC member Haldane speech; US PPI m/m and Core PPI m/m.
AUD/USD:
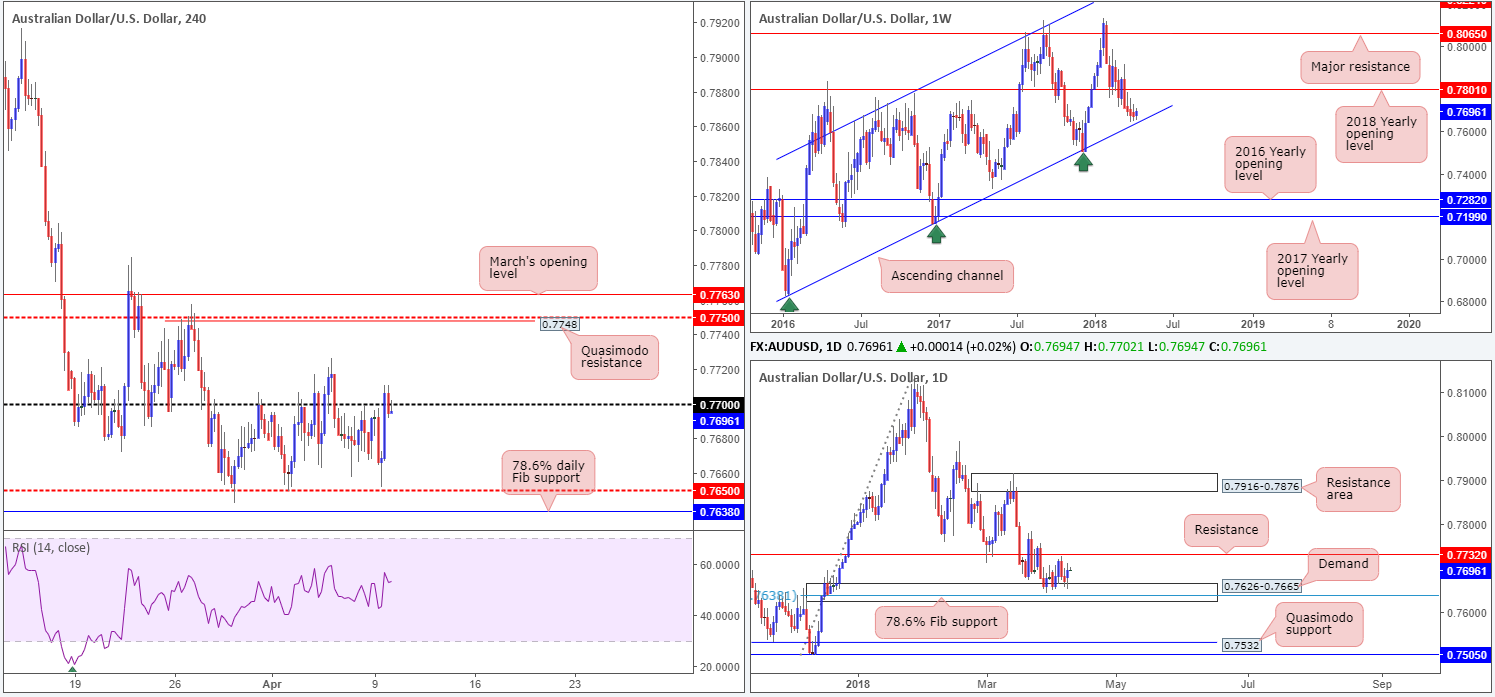
The commodity currency staged a rather positive recovery on Monday, following an attempt to push lower in the early hours of London. The H4 candles, as you can see, are propped beneath the 0.77 handle, following a recent push to a high of 0.7710. Since February 29, price has been carving out a range between 0.77 and the H4 mid-level support at 0.7650, and we do not really see this changing today since Aussie data remains light until a speech from the RBA’s Lowe on Wednesday.
As is evident from the weekly timeframe, price action remains hovering just north of a long-term weekly channel support taken from the low 0.6827. A test of this barrier could very well see the unit bounce higher and challenge the 2018 yearly opening level at 0.7801. On the daily timeframe, the daily demand at 0.7626-0.7665 remains in motion, which houses a 78.6% daily Fib support seen at 0.7638 and aligns almost perfectly with the aforementioned weekly channel support.
Potential trading zones:
Despite the current range in play, the team still has an eye on the 78.6% daily Fib support at 0.7638 (seen a touch beneath the current H4 mid-level support) as a potential buy zone. This is, as highlighted above, due to the Fib level being positioned within the current daily demand and intersecting with the weekly channel support.
This could prove to be a reasonably big move seeing as we’re utilizing higher-timeframe areas. Therefore, stop-loss orders would be best placed 5-10 pips beyond the current daily demand with the initial upside target falling in at 0.77, followed by a daily resistance drawn from 0.7732.
Data points to consider today: US PPI m/m and Core PPI m/m.
USD/JPY:
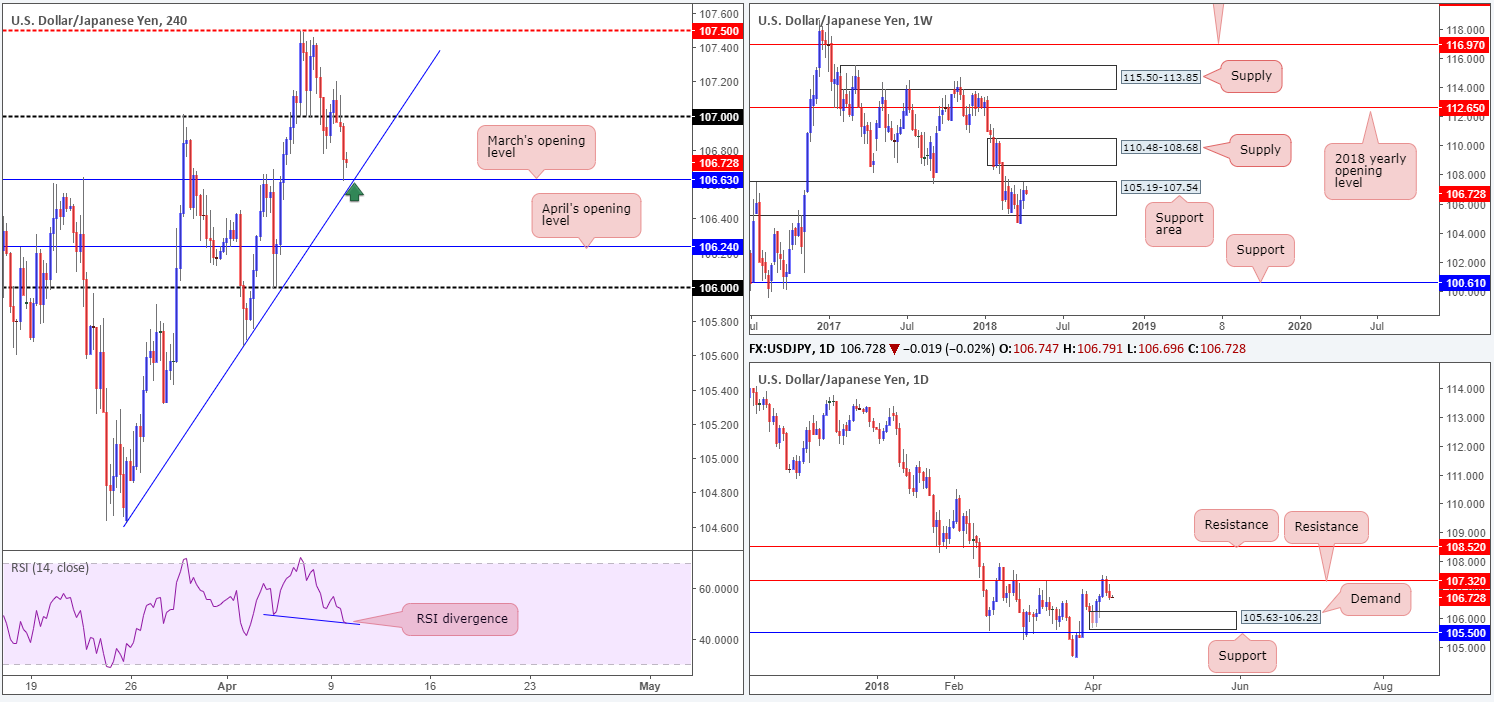
The USD/JPY, as you can see, failed to capitalize on its early up-move above 107 on Monday. Surrendering immediate gains, the pair retreated – re-took 107 – and headed to March’s opening level on the H4 timeframe at 106.63 where price is mildly seen paring recent losses. For those who read Monday’s report you may recall that the team highlighted 106.63 as a potential buy zone, given that it fused nicely with a H4 trend line support taken from the low 104.62. Although the level has so far held firm, we lack conviction until the H4 trend line support has been brought into the fray. Also worth noting here is the H4 RSI indicator is presently showing a divergence play in motion.
Higher-timeframe action, however, positions daily price off of a resistance level plotted at 107.32 with the next downside target coming in at 105.63-106.23: a daily demand area. Looking at the weekly timeframe, we can see that price remains trading around the upper edge of a weekly support zone at 105.19-107.54. As mentioned in Monday’s report, this could prompt USD buying this week and potentially target a weekly supply zone pegged at 110.48-108.68.
Potential trading zones:
From a technical standpoint, we still really like March’s opening level mentioned above on the H4 timeframe at 106.63. The point at where the monthly level and H4 trend line intersect (green arrow) is particularly appealing. Not only this, let’s remember that we also have credible divergence seen on the H4 RSI indicator. The 107 handle seems a viable intraday target from this point, followed then by the aforementioned daily resistance.
While H4 technicals appear sound – coupled with the backing of potential upside on the weekly timeframe – traders still need to remain cognizant of daily flow selling from resistance! Therefore, constant monitoring is advised should you look to long from the 106.63 point today.
Data points to consider today: US PPI m/m and Core PPI m/m.
USD/CAD:
During the course of Monday’s sessions the USD/CAD fell sharply lower, influenced by the BoC’s business outlook survey and higher oil prices. The Bank of Canada reported that companies remain upbeat about future sales, business investment and hiring despite NAFTA negotiations. The BoC is not expected to adjust rates at its April meeting next week. Markets are not fully pricing in a hike until September.
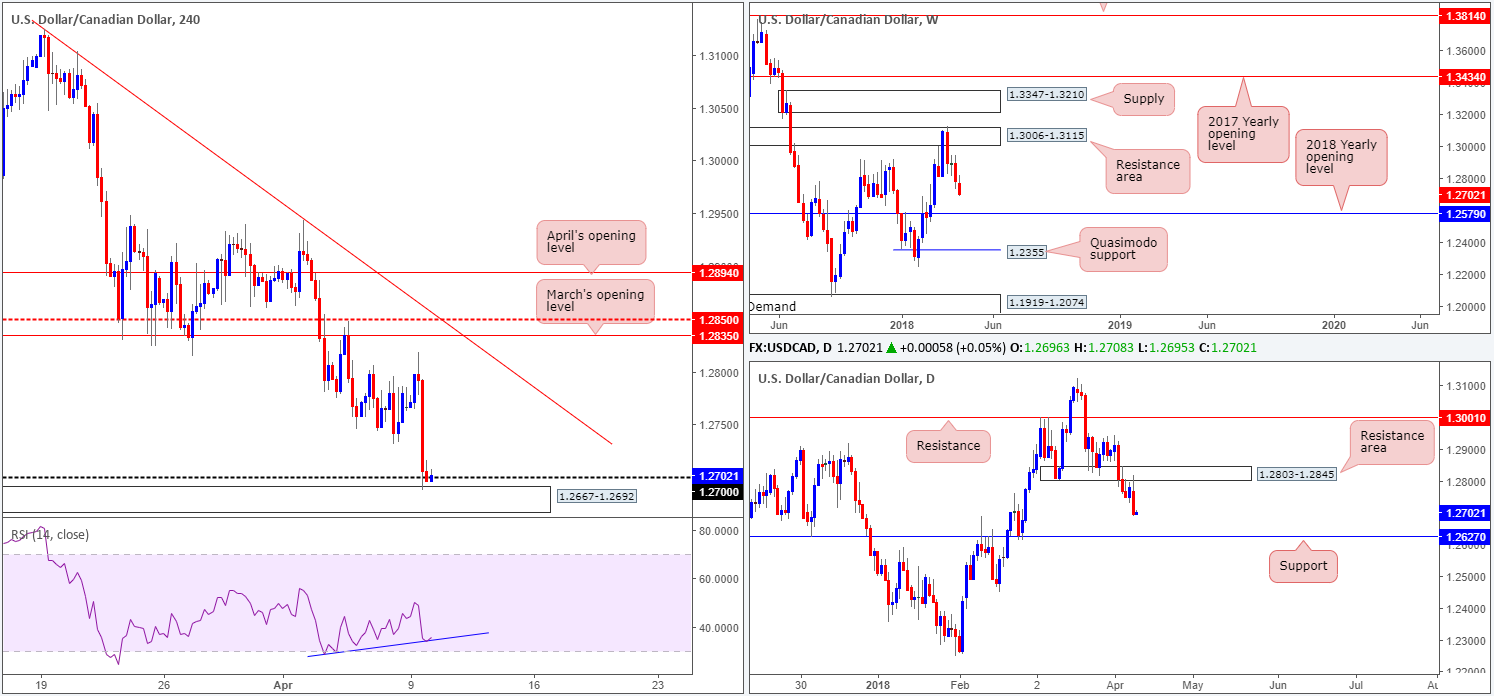
On the H4 timeframe, yesterday’s downside move saw the unit mildly breach 1.27 and shake hands with a fresh H4 demand area coming in at 1.2667-1.2692. The next supportive structure seen on the H4 timeframe beyond the current H4 demand is the 1.26 handle (not seen on the screen).
While the current H4 demand is an appealing buy (alongside H4 RSI divergence), higher-timeframe flow is currently pointing in a southerly direction. Weekly price is on track to test the 2018 yearly opening level at 1.2579. In conjunction with weekly flow, we can see that recent action on the daily timeframe retested the underside of a daily resistance area at 1.2803-1.2845. From this point, downside is potentially free until we reach daily support marked at 1.2627.
Potential trading zones:
In view of the current downtrend and higher-timeframe structures, the team feel further downside could be in store. Instead of looking to buy from the H4 demand (we know it is tempting), traders may want to consider waiting and seeing if the area is taken out. A decisive H4 close beneath this zone followed up with a successful retest is, in our opinion, a strong signal to sell, targeting 1.2627 (daily support), followed by 1.26.
Data points to consider today: US PPI m/m and Core PPI m/m; CAD Building permits m/m.
USD/CHF:
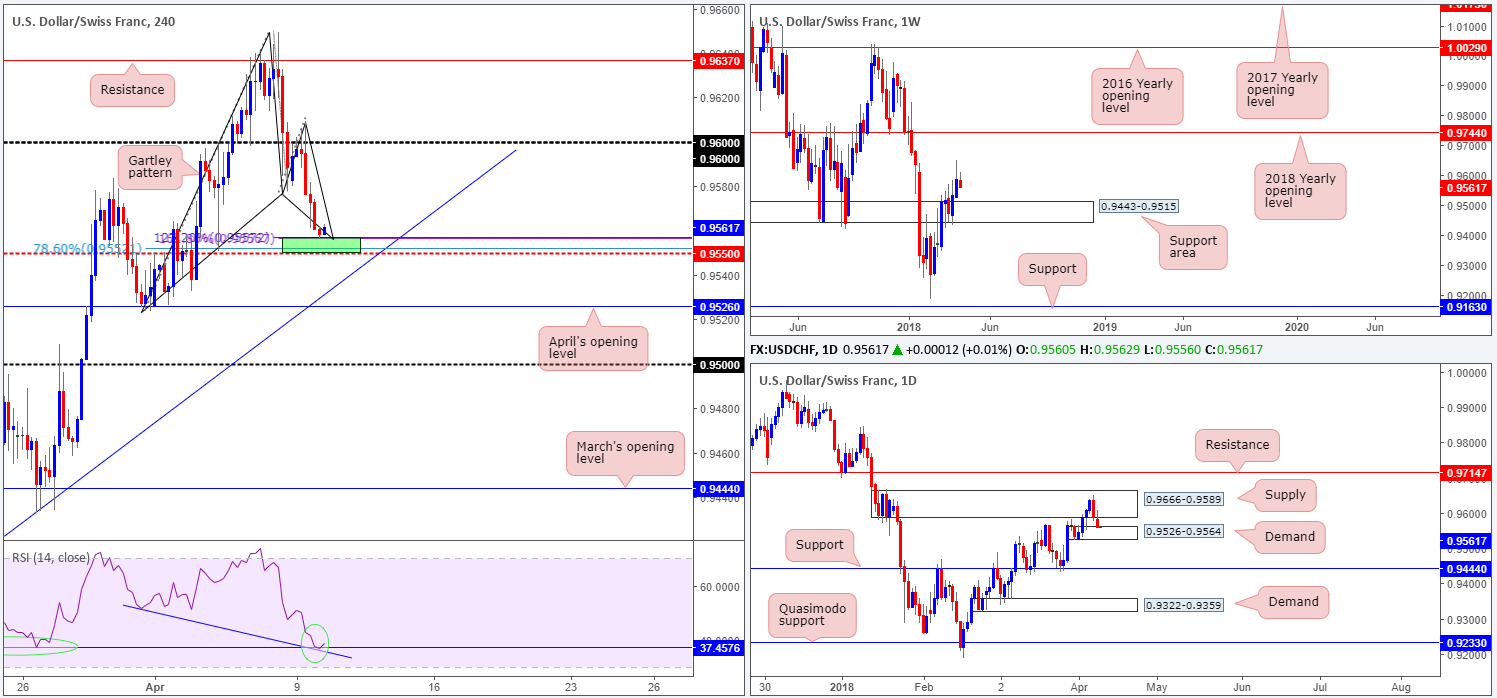
On the back of a waning US dollar, the USD/CHF took a hit to the mid-section on Monday, driving lower from the 0.96 handle to challenge a rather interesting area of support on the H4 timeframe. As you can see, the H4 candles concluded yesterday’s segment basing just north of the H4 mid-level support at 0.9550. This, technically speaking, is likely due to a H4 harmonic Gartley bullish completion point at 0.9552/0.9557, which is accompanied by H4 RSI divergence and RSI support.
Supporting the H4 Gartley pattern is a local daily demand area plotted at 0.9526-0.9564, as well as room for weekly price to continue punching as far north as the 2018 yearly opening level at 0.9744.
Potential trading zones:
According to the technicals, a long from the H4 harmonic Gartley completion point is high probability. The next upside target, however, can be seen around the underside of a nearby daily supply at 0.9589, followed by 0.96 on the H4 timeframe.
Data points to consider today: US PPI m/m and Core PPI m/m.
DOW 30:
It was a mixed day for US equities on Monday. The DJIA started the day off on a strong footing as investors shrugged off tensions between the US and China. Traders appeared confident that trade tariffs will not escalate into a full-scale trade war. Later in the session, though, President Trump announced that he would make a decision as to whether a military retaliation will take place in Syria, which naturally weighed on both the US dollar and equities.
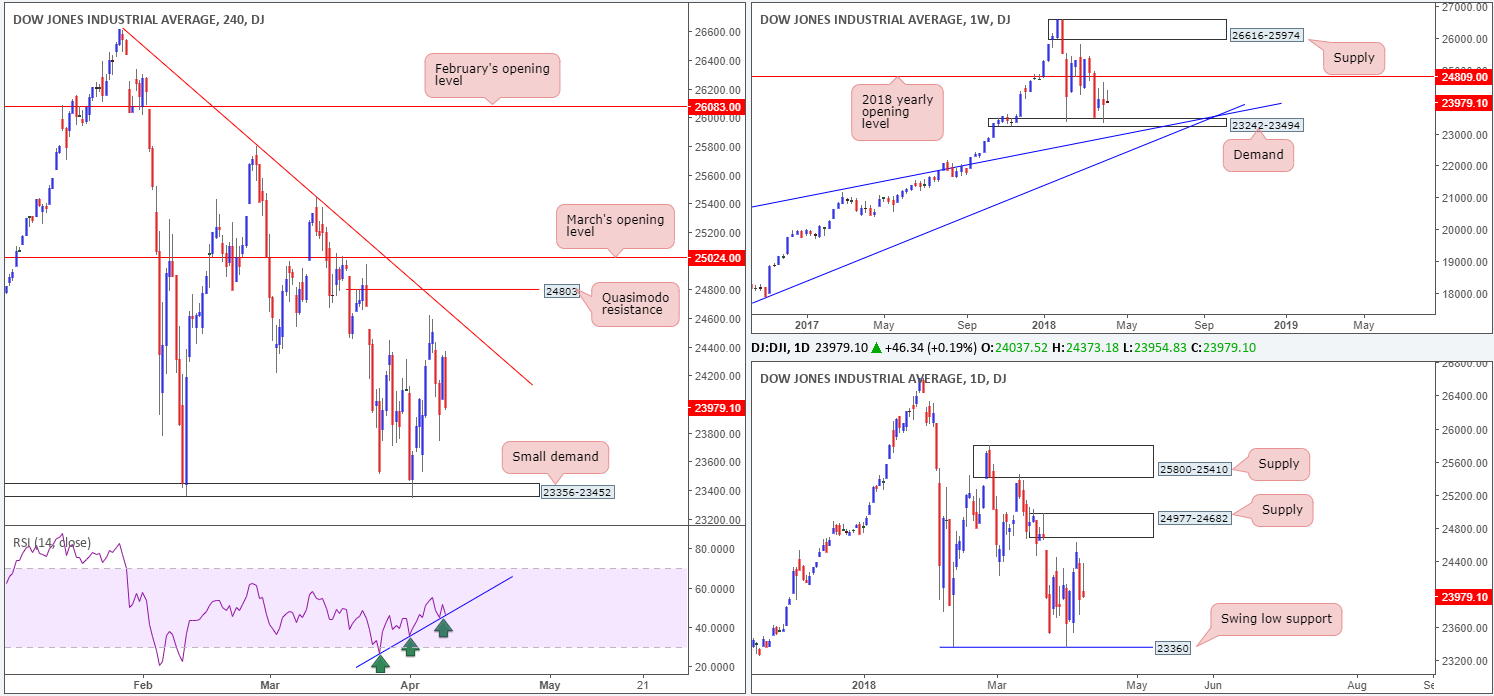
From the weekly timeframe, the index remains capped by a weekly demand area at 23242-23494 and a 2018 yearly opening level at 24809. In a similar fashion, daily price is also seen sandwiched between a daily supply zone at 24977-24682 and a daily swing low support at 23360.
On the H4 timeframe, the H4 trend line resistance extended from the high 26608 continues to station itself above current price, whereas to the downside we have a small H4 demand area noted at 23356-23452. Also worthy of attention is the H4 RSI trend line support which remains intact.
Potential trading zones:
The current H4 demand area is still likely a watched zone by many. Positioned within the aforementioned weekly demand and housing the noted daily swing low support, a long from this region could still be a possibility. Though, to be on the safe side, we would strongly recommend placing stop-loss orders beneath the said weekly demand. This will give the trade room to breathe.
Data points to consider today: US PPI m/m and Core PPI m/m.
GOLD:
Given a USD decline on Monday, we witnessed H4 gold prices extend to a high of 1337.9. Despite this, our outlook for this market remains unchanged.
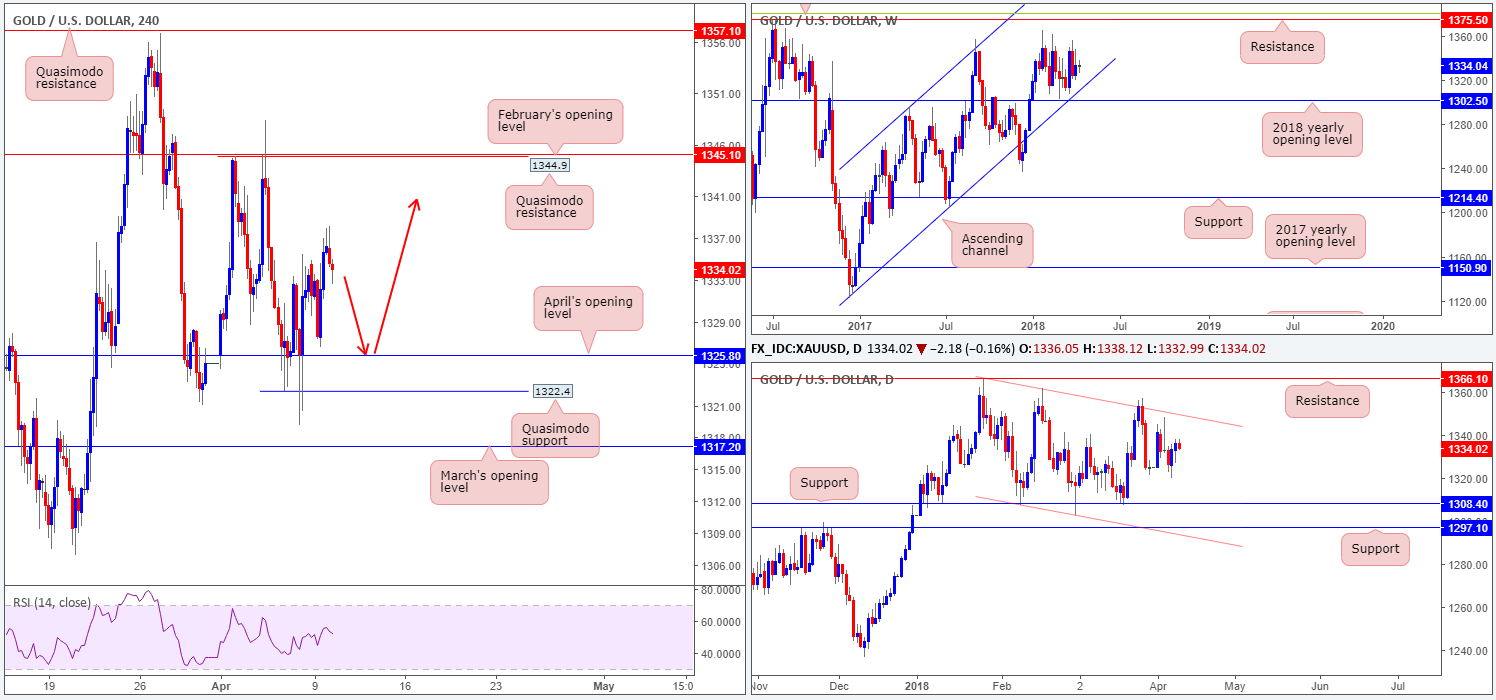
Since the beginning of the year, the price of gold has somewhat stagnated. Weekly price remains floating between the 2018 yearly opening level at 1302.5 (fuses closely with a long-term weekly channel support etched from the low 1122.8) and a weekly resistance pegged at 1375.5/38.2% weekly Fib resistance at 1381.0 (green line). Looking down to the daily timeframe, we can see that bullion is currently compressed in a rather wide descending daily channel (1366.0/1307.2). Slotted inside this formation, however, is a daily support level plotted at 1308.4, with another layer of additional support seen not too far off at 1297.1.
April’s opening level at 1325.8 seen on the H4 timeframe remains to be a valuable support in this market, despite suffering multiple downside attempts. Overhead, the next port of call can be seen at 1344.9: a H4 Quasimodo resistance level that’s shadowed closely by February’s opening level at 1345.1.
Potential trading zones:
In a similar fashion to Monday’s outlook, the only play we see right now is a retest off of April’s opening level (as per the red arrows). From this point, the ultimate take-profit target would be the aforesaid H4 Quasimodo resistance level.
However, as mentioned in Monday’s post, for those looking to long 1325.8, you are reminded that there is a strong possibility that a fakeout of this level could occur, before turning higher. The H4 Quasimodo support plotted just beneath it at 1322.4 is, in our technical view, an ideal level to fake to!
This site has been designed for informational and educational purposes only and does not constitute an offer to sell nor a solicitation of an offer to buy any products which may be referenced upon the site. The services and information provided through this site are for personal, non-commercial, educational use and display. IC Markets does not provide personal trading advice through this site and does not represent that the products or services discussed are suitable for any trader. Traders are advised not to rely on any information contained in the site in the process of making a fully informed decision.
This site may include market analysis. All ideas, opinions, and/or forecasts, expressed or implied herein, information, charts or examples contained in the lessons, are for informational and educational purposes only and should not be construed as a recommendation to invest, trade, and/or speculate in the markets. Any trades, and/or speculations made in light of the ideas, opinions, and/or forecasts, expressed or implied herein, are committed at your own risk, financial or otherwise.
The use of the site is agreement that the site is for informational and educational purposes only and does not constitute advice in any form in the furtherance of any trade or trading decisions.
The accuracy, completeness and timeliness of the information contained on this site cannot be guaranteed. IC Markets does not warranty, guarantee or make any representations, or assume any liability with regard to financial results based on the use of the information in the site.
News, views, opinions, recommendations and other information obtained from sources outside of www.icmarkets.com.au, used in this site are believed to be reliable, but we cannot guarantee their accuracy or completeness. All such information is subject to change at any time without notice. IC Markets assumes no responsibility for the content of any linked site. The fact that such links may exist does not indicate approval or endorsement of any material contained on any linked site.
IC Markets is not liable for any harm caused by the transmission, through accessing the services or information on this site, of a computer virus, or other computer code or programming device that might be used to access, delete, damage, disable, disrupt or otherwise impede in any manner, the operation of the site or of any user’s software, hardware, data or property.


