A note on lower-timeframe confirming price action…
Waiting for lower timeframe confirmation is our main tool to confirm strength within higher timeframe zones, and has really been the key to our trading success. It takes a little time to understand the subtle nuances, however, as each trade is never the same, but once you master the rhythm so to speak, you will be saved from countless unnecessary losing trades. The following is a list of what we look for:
- A break/retest of supply or demand dependent on which way you’re trading.
- A trendline break/retest.
- Buying/selling tails/wicks – essentially we look for a cluster of very obvious spikes off of lower timeframe support and resistance levels within the higher timeframe zone.
- Candlestick patterns. We tend to stick with pin bars and engulfing bars as these have proven to be the most effective.
We typically search for lower-timeframe confirmation between the M15 and H1 timeframes, since most of our higher-timeframe areas begin with the H4. Stops are usually placed 3-5 pips beyond confirming structures.
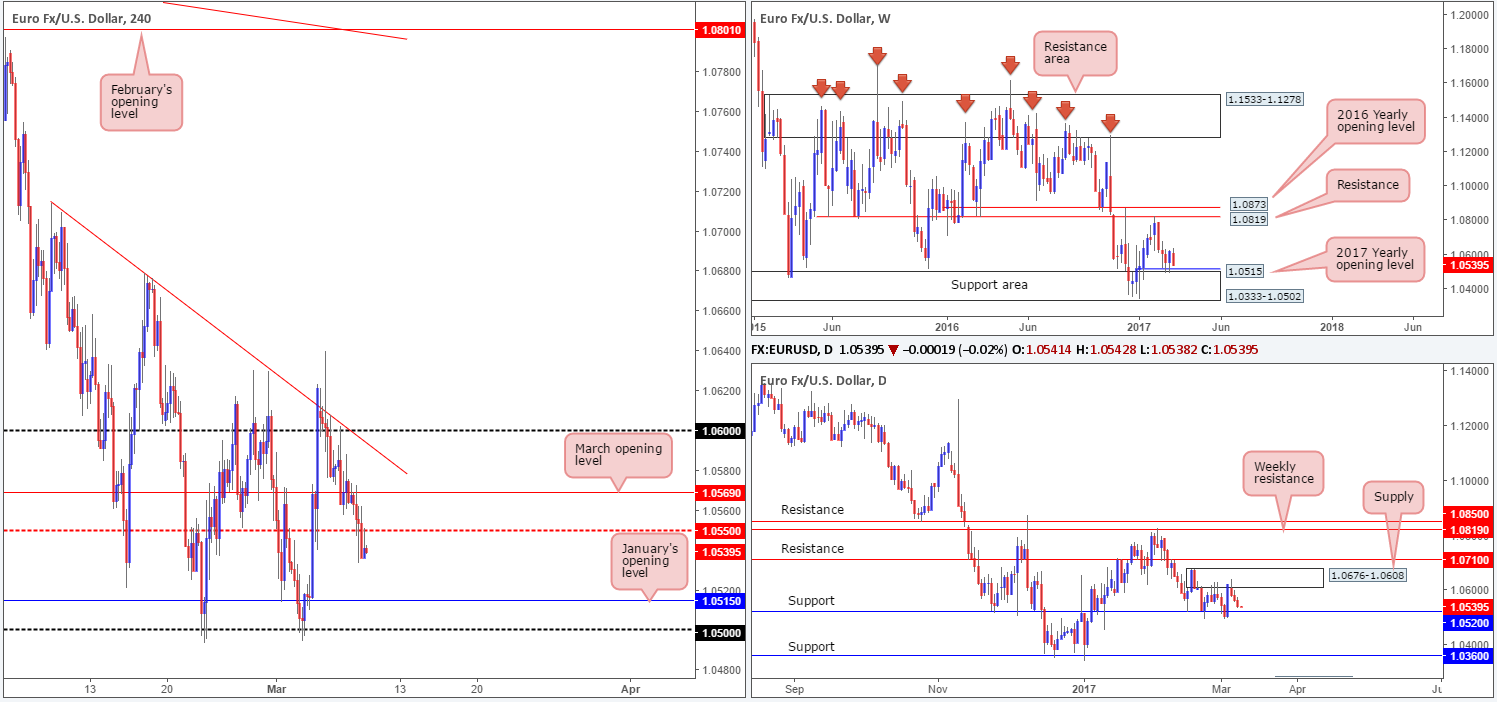
EUR/USD:
US ADP non-farm employment change came in hotter than expected yesterday, forcing the single currency to break below the H4 mid-way support 1.0550. Be that as it may, the selloff was a short-lived one as the pair managed to recover relatively quickly from lows of 1.0533. It was not until London closed for the day did we see the unit close below 1.0550, which, as you can see, has potentially opened up the gates for a move south down to January’s open level at 1.0515.
Although 1.0515 is an important support in and of itself, we can also see the following converging structures: a round number at 1.05, a daily support at 1.0520 as well as being reinforced by the weekly support area at 1.0333-1.0502. Therefore, the 1.05/1.0520 barrier remains a zone of interest for our desk this morning.
Our suggestions: Seeing as how 1.05/1.0520 has already been tested twice, we would not be comfortable trading from here without additional lower-timeframe confirmation. This could either be an engulf of demand followed by a retest as supply, a trendline break/retest or simply a well-defined collection of buying tails around the higher-timeframe zone. We typically search for lower-timeframe confirmation between the M15 and H1 timeframes, since most of our higher-timeframe areas begin with the H4. Stops are usually placed 3-5 pips beyond confirming structures.
Data points to consider: EUR minimum bid rate at 12.45pm, ECB press conference at 1.30pm. US jobless claims at 1.30pm GMT.
Levels to watch/live orders:
- Buys: 1.05/1.0520 ([wait for a lower-timeframe signal to form before looking to pull the trigger] stop loss: dependent on where one confirms the zone).
- Sells: Flat (stop loss: N/A).
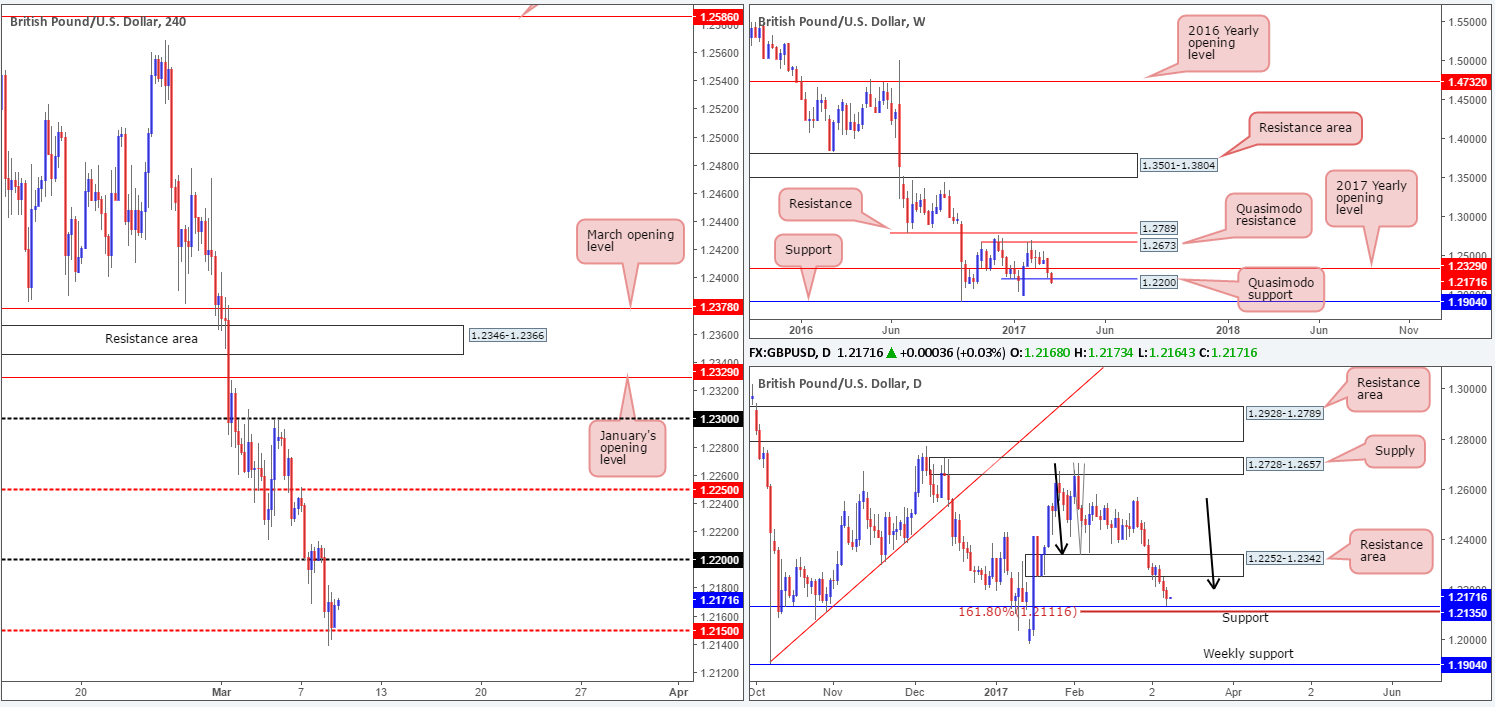
GBP/USD:
Despite the UK’s annual budget release and stronger-than-expected US ADP non-farm employment change, the GBP/USD remained steady ahead of the H4 mid-way support 1.2150 yesterday. The other key thing one may want to note here is the fact that price also came within a cat’s whisker of connecting with daily support found at 1.2135, followed closely by a daily AB=CD 161.8% Fib ext. at 1.2111. Whilst the H4 and daily charts indicate that the bulls may still have a hand in this fight, we need to take into account that weekly action recently slipped below a weekly Quasimodo support at 1.22.
Personally, we would not feel comfortable buying this market until we witness a H4 close print back above the 1.22 handle. This would not only confirm buyer strength, but it would also open up the doors to the H4 mid-way resistance 1.2250 which denotes the underside of a daily resistance area at 1.2252.
Our suggestions: All in all, we do not see a lot to hang one’s hat on at the moment. Even with a H4 close above 1.22, there is not a lot of room for this unit to advance! With that being said, we’ll remain flat for the time being and reassess going into tomorrow’s segment.
Data points to consider: US jobless claims at 1.30pm GMT.
Levels to watch/live orders:
- Buys: Flat (stop loss: N/A).
- Sells: Flat (stop loss: N/A).
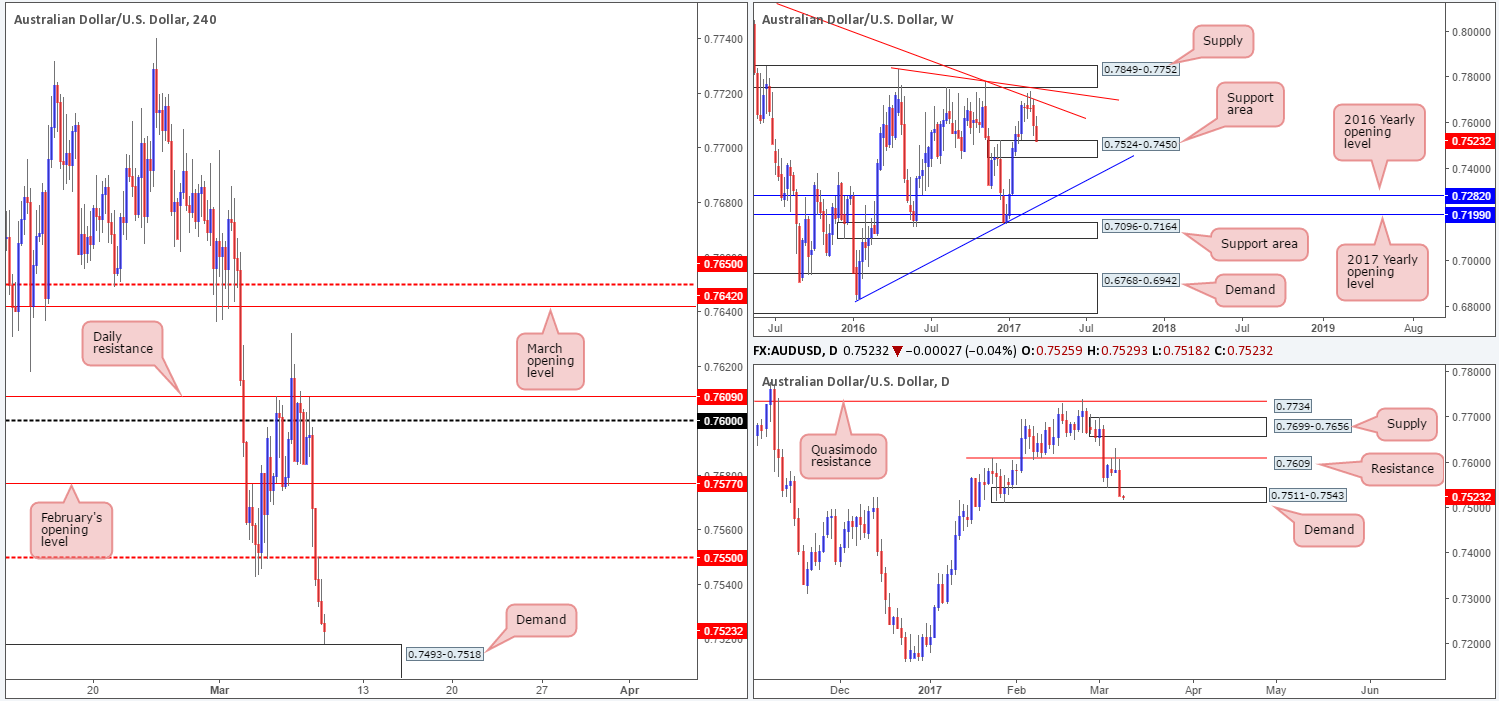
AUD/USD:
With China’s trade balance coming in at -60.4 billion CNY versus 172.5 billion expected, the Aussie dollar responded bearishly. Additional selling was seen during the early hours of London, which, as you can see, was later fuelled further by a better-than-expected US ADP print. As can be seen from the H4 chart, the pair has settled around the top edge of a H4 demand area at 0.7493-0.7518 and is, for the time being, holding firm.
Looking over to the bigger picture, it’s clearly seen that both the weekly and daily charts are trading within supportive structures at present (weekly support area at 0.7524-0.7450/Daily demand at 0.7511-0.7543). Because of this, we feel that there’s a good chance price could advance north from the current H4 demand base today and at least tap the underside of the H4 mid-way resistance at 0.7550.
Our suggestions: While a buy from the present H4 demand is tempting, there’s not much room to play with before price strikes 0.7550 (27 pips at current price). As such, an ideal scenario would be for the H4 bears to drive a little deeper into the aforementioned H4 demand, before looking to go long. Our cue here would be a reasonably sized H4 bull candle seen within the walls of this region.
Data poInts to consider: Chinese inflation data at 1.30am. US jobless claims at 1.30pm GMT.
Levels to watch/live orders:
- Buys: 0.7493-0.7518 ([wait for a reasonably sized H4 bull candle to form before looking to pull trigger here] stop loss: ideally beyond the trigger candle).
- Sells: Flat (stop loss: N/A).
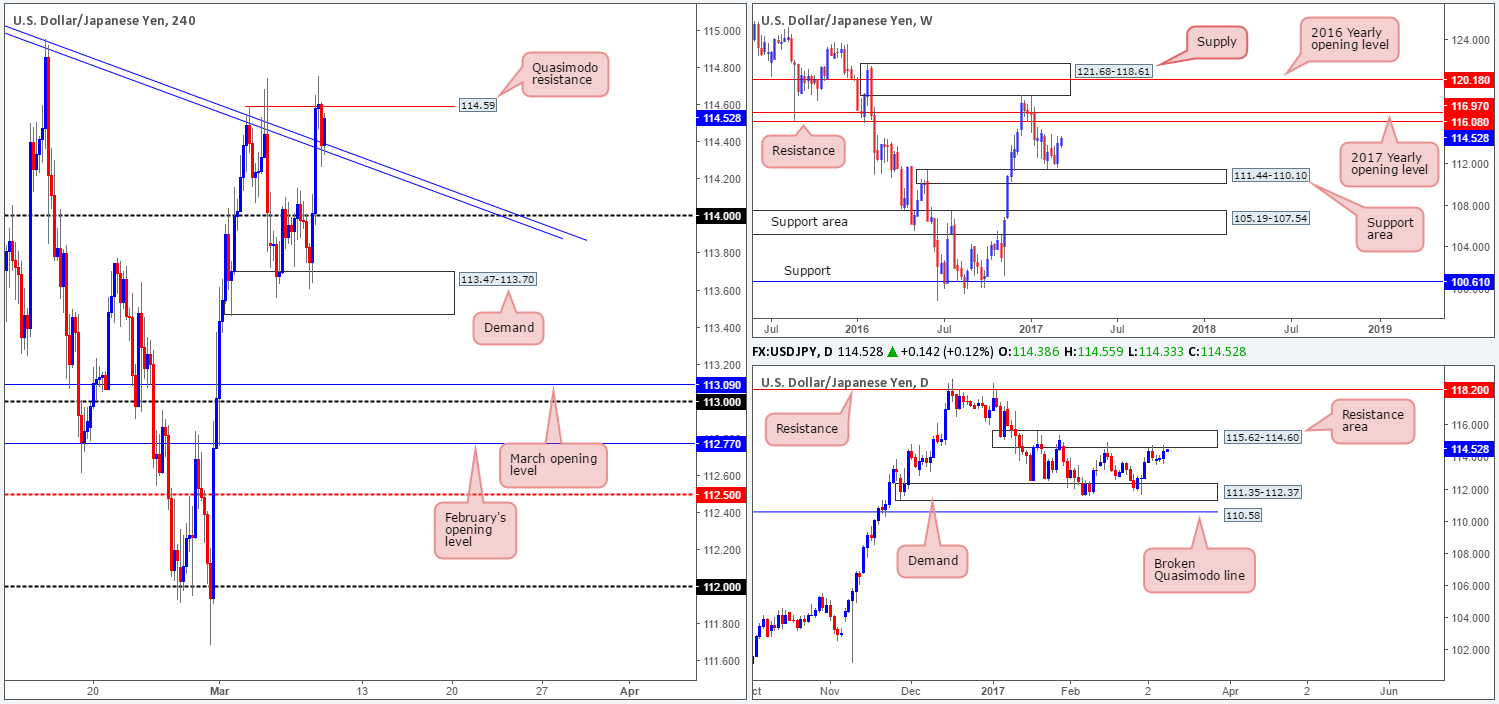
USD/JPY:
The value of the USD/JPY strengthened in aggressive fashion going into yesterday’s London open from a H4 demand base seen at 113.47-113.70. Following the release of US ADP non-farm employment data further buying was seen, consequently pulling the piece above a H4 trendline resistance taken from the high 115.62, and tapping the underside of a H4 Quasimodo resistance line at 114.59.
With the H4 candles now effectively loitering mid-range between the above said H4 Quasimodo resistance and (now) H4 trendline support, which direction do we see the pair heading to? Well, over on the daily chart, price is seen kissing the underside of a daily resistance area at 115.62-114.60 (capped upside since mid-Jan 2017). Looking up to the weekly candles, however, there’s room seen for an advance up to weekly resistance at 116.08.
Our suggestions: Given the above notes, it’s difficult to see which way the pair will break today as we have somewhat conflicting signals on the higher-timeframe picture. With this being the case, remaining on the sidelines for now may very well be the better path to take.
Data points to consider: US jobless claims at 1.30pm GMT.
Levels to watch/live orders:
- Buys: Flat (stop loss: N/A).
- Sells: Flat (stop loss: N/A).
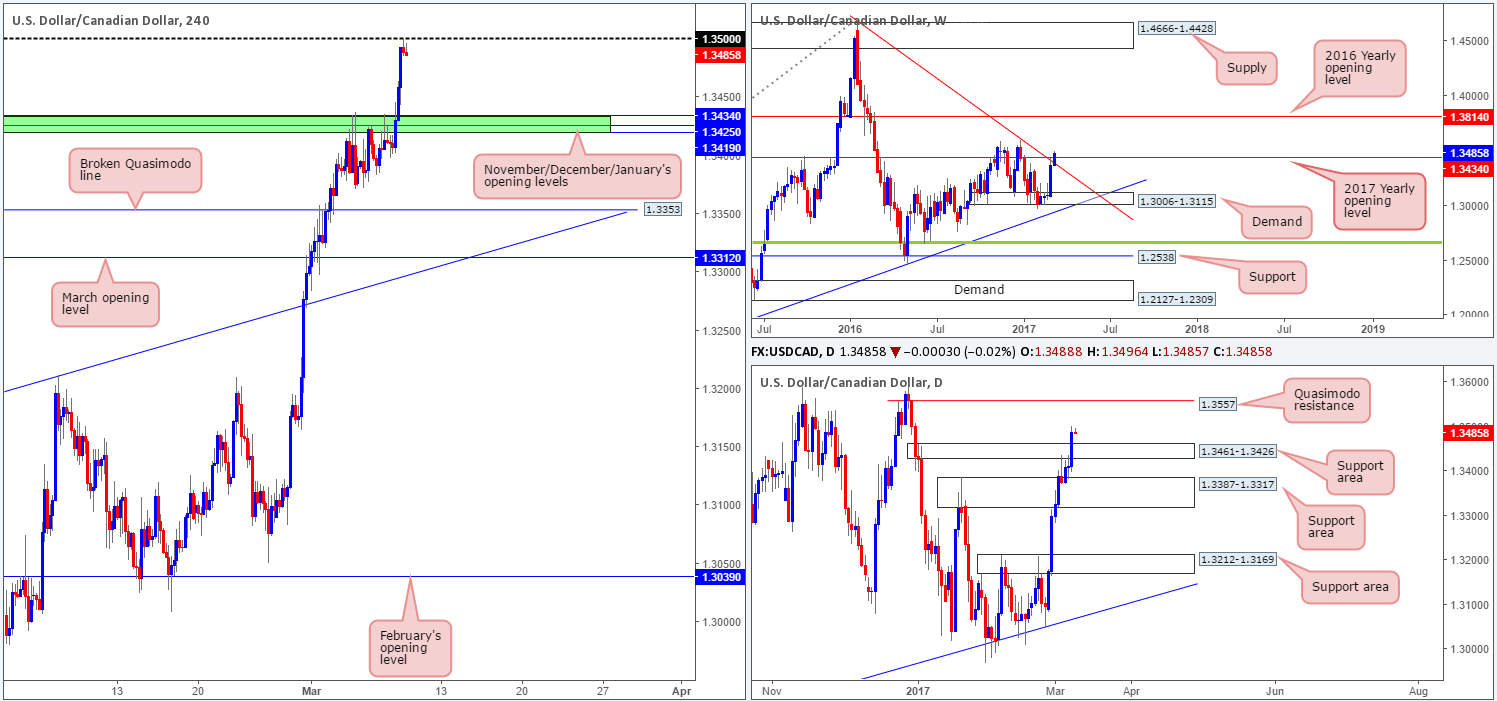
USD/CAD:
In recent trade, we saw the US bulls march higher against its Canadian counterpart, taking out the 1.3434/1.3419 (November, December and January’s opening levels) region and end the day shaking hands with the 1.35 handle. Although this number is holding steady for the time being, daily price indicates that there’s room to gravitate north up to a daily Quasimodo resistance level at 1.3557. In addition to this, we can also see that weekly action has recently pushed above a long-term weekly trendline resistance extended from the high 1.4689. So, as you can see, a selloff from 1.35 may not prove to be very fruitful!
Our suggestions: Instead of looking to short 1.35, we will watch for a H4 close to print above this level. A H4 close followed by a retest and a lower-timeframe confirming signal (see the top of this report) would, in our humble opinion, be enough to justify a buy trade, targeting the H4 mid-way resistance 1.3550 (positioned directly below the above said daily Quasimodo resistance).
Data points to consider: US jobless claims at 1.30pm GMT.
Levels to watch/live orders:
- Buys: Watch for price to engulf 1.35 and then look to trade any retest seen thereafter (waiting for a lower-timeframe confirming signal to form following the retest is advised] stop loss: dependent on where one confirms the level).
- Sells: Flat (stop loss: N/A).