EUR/USD:
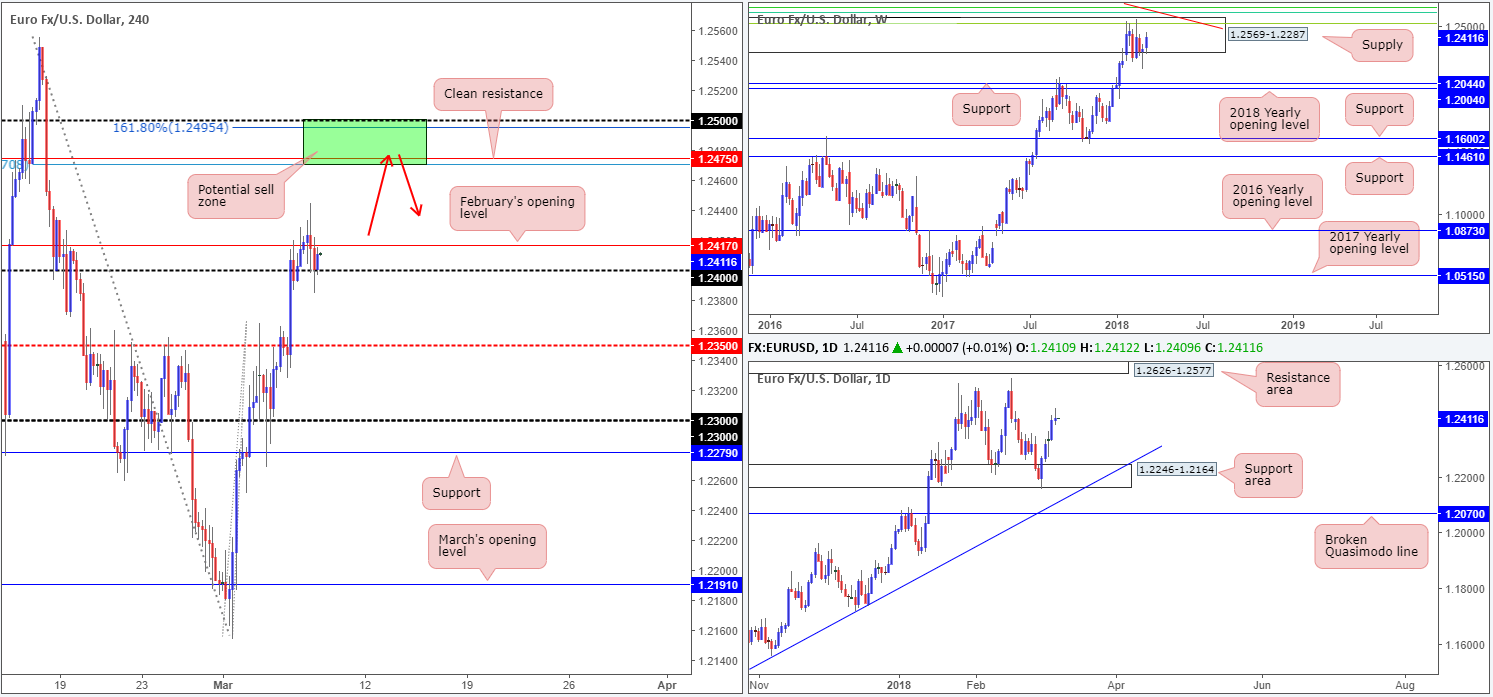
During the course of Wednesday’s movement, the EUR/USD stamped in a reasonably strong selling wick on the daily timeframe, hinting momentum may be diminishing. A downside push on this scale has the daily support area at 1.2246-1.2164 to target. Weekly action, on the other hand, remains within the limits of a weekly supply at 1.2569-1.2287. To date, this area has managed to cap upside for six consecutive weeks.
Over on the H4 candles, the currency held gains above the 1.24 handle yesterday, but appeared muted ahead of today’s ECB press conference. Capping upside in the short term here is February’s opening level at 1.2417. The US dollar index also rose from lows of 89.40 printed in the aftermath of Cohn’s resignation, and is, at the time of writing, seen trading at 89.60.
Potential trading zones:
Today’s spotlight remains focused on the H4 sell zone painted in green at 1.25/1.2470, seen 60 pips north of the Feb open line. We like this area for the following reasons:
• Located within the current weekly supply area.
• 1.25 handle.
• 161.8% H4 Fib ext. point at 1.2495.
• H4 resistance at 1.2475.
• 78.6% H4 Fib resistance at 1.2470.
Should this area be brought into play today, the first take-profit target from this region would be Feb’s open level/1.24. However, this could change depending on the H4 approach.
Data points to consider: EUR minimum bid rate at 12.45pm; ECB press conference at 1.30pm; US unemployment claims at 1.30pm GMT.
Areas worthy of attention:
Supports: 1.24 handle; 1.2246-1.2164.
Resistances: 1.25/1.2470; 1.2626-1.2577; 1.2569-1.2287.
GBP/USD:
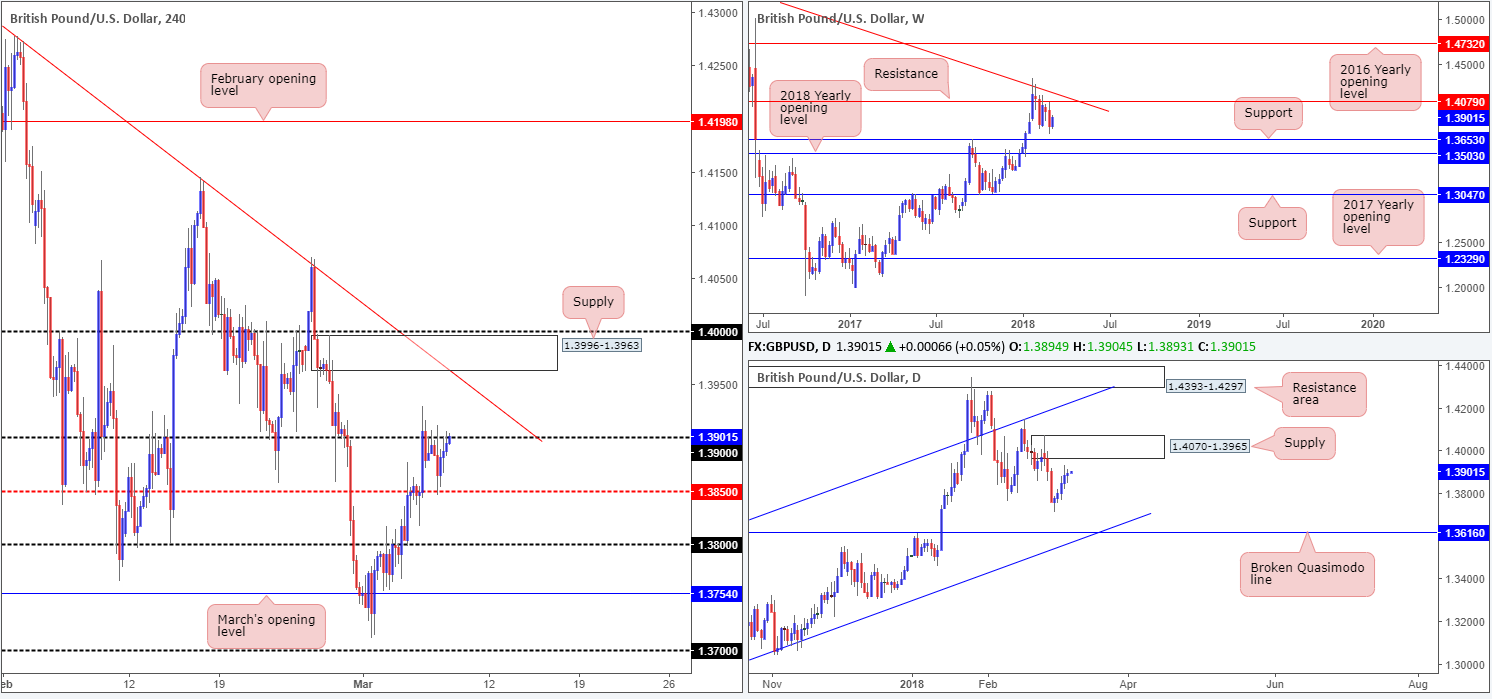
Wednesday’s action employed more of a subdued approach, unable to breach Tuesday’s range.
In recent news, a new EU draft on Brexit offers banks limited access to the markets. The draft states that the UK will not be given special treatment. There have also been reports that Goldman Sachs will be moving some staff in London to Frankfurt, potentially leading the way for others. Despite this, the GBP/USD remain bid above the H4 mid-level support at 1.3850 and ended the day closing 5 pips shy of the 1.39 handle. Beyond this number, there’s the H4 trendline resistance taken from the high 1.4345, a H4 supply at 1.3996-1.3963 and the large psychological band 1.40 in view.
Weekly flow remains floating mid-range between weekly resistance pegged at 1.4079 and a weekly support level seen at 1.3653. Meanwhile, daily price appears on track to connect with a nearby daily supply base coming in at 1.4070-1.3965.
Potential trading zones:
The H4 supply mentioned above at 1.3996-1.3963 is, at least for us, considered fresh. This – coupled with its surrounding H4 confluence, as well as the areas being located within the confines of the noted daily supply – is certainly an area to keep an eyeball on today for possible shorting opportunities. Waiting for additional candle confirmation in the form of a full or near-full-bodied H4 bearish candle is recommended, however, as large psychological levels such as 1.40 are prone to fakeouts. The first take-profit target, assuming the H4 approach is reasonably smooth, would be set around the 1.39 neighborhood.
Data points to consider: US unemployment claims at 1.30pm GMT.
Areas worthy of attention:
Supports: 1.3850; 1.3653.
Resistances: 1.39/40 handle; 1.3996-1.3963; H4 trendline resistance; 1.4070-1.3965; 1.4079.
AUD/USD:
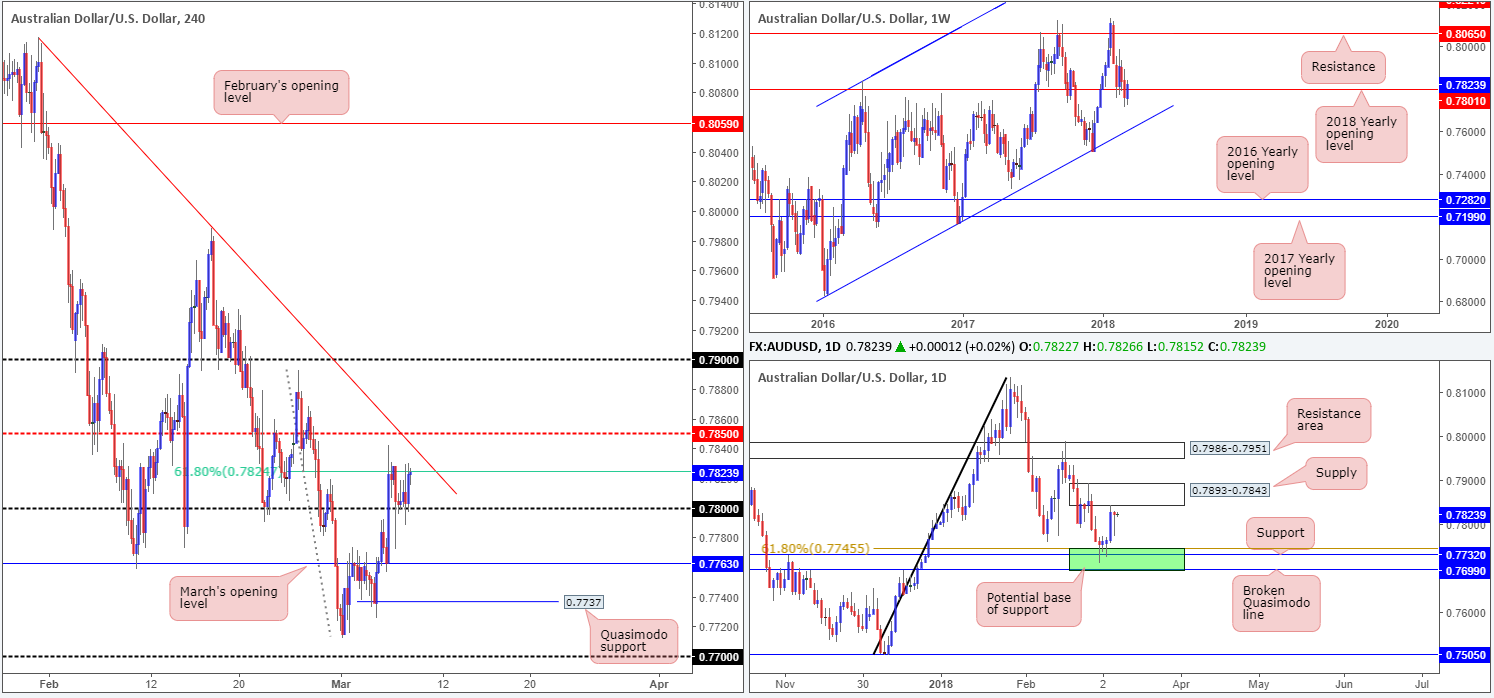
The commodity currency managed to hold ground above the 0.78 handle on Wednesday, but remained capped at 0.7831ish. A miss on Australian GDP, a dovish Lowe and trade wars collectively contributed in keeping the AUD weighed down. To the upside, intraday buyers have a H4 61.8% Fib resistance at 0.7824, a H4 trendline resistance extended from the high at 0.8116, followed closely by the mid-level H4 resistance at 0.7850 to contend with.
Weekly movement is currently attempting to nudge its way above the 2018 yearly opening level at 0.7801. In the event of a rejection here we could potentially see the unit shake hands with a weekly channel support taken from the low 0.6827. A little lower on the curve, daily price recently came within an inch of connecting with daily supply positioned at 0.7893-0.7843. A selloff from here has the daily support area marked in green at 0.7699/0.7745 to target.
Potential trading zones:
In light of the nearby resistances in play right now, buying the market is likely to be a challenge. Even with a H4 close above the 0.7850 mark, one still has to compete with potential selling from the daily supply!
In regard to selling, a small intraday move from 0.7824 could possibly make its way back down to 0.78. A break beyond this line, nonetheless, would likely open the door for a test of March’s opening level at 0.7763.
Data points to consider: AUD trade balance at 12.30am; Chinese trade balance (tentative timing); US unemployment claims at 1.30pm GMT.
Areas worthy of attention:
Supports: 0.7699/0.7745; weekly channel support; 0.7763; 0.78 handle.
Resistances: 0.7801; 0.7893-0.7843; 0.7824; H4 trendline resistance; 0.7850.
USD/JPY:
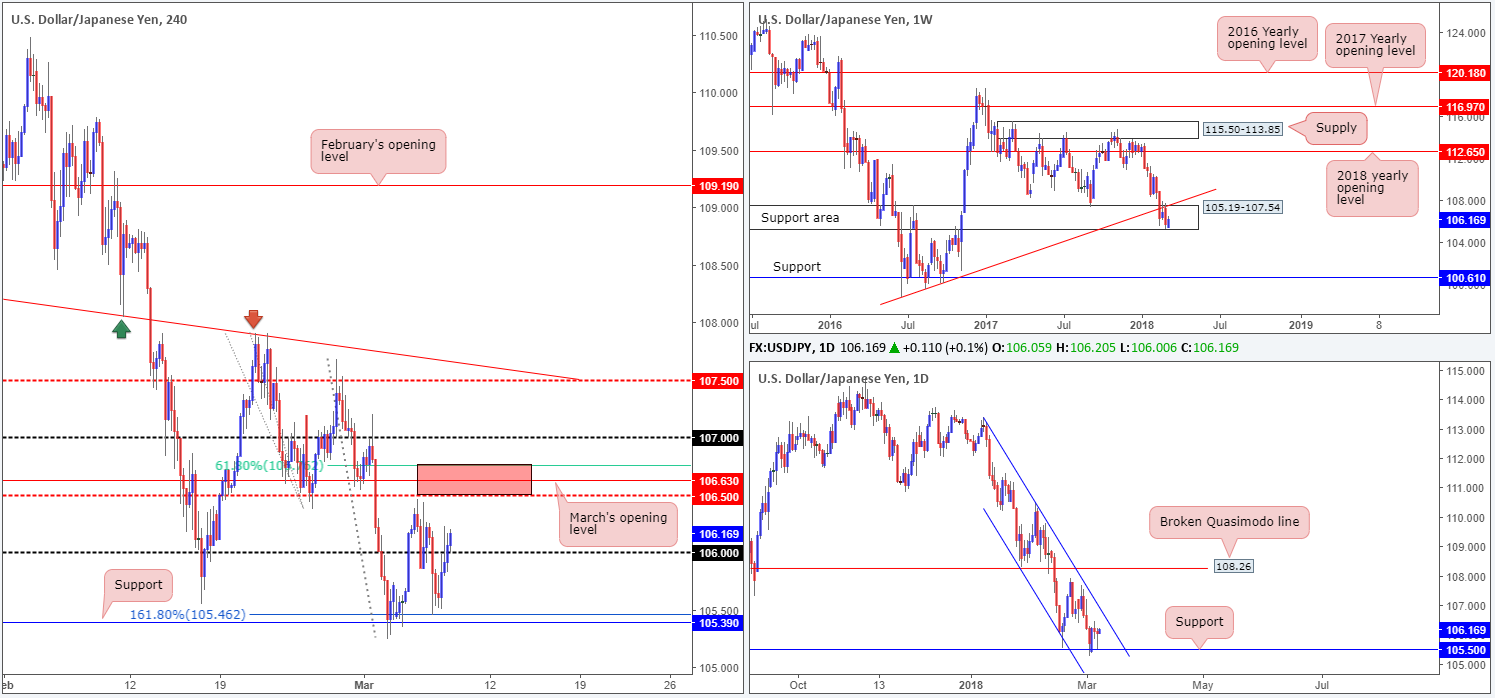
Recent action shows that H4 price extended its bounce from the 161.8% H4 Fib ext. at 105.46/H4 support at 105.39 area on Wednesday, and ended the segment marginally above the 106 handle. The next resistances on tap can be seen at 106.50: a H4 mid-level resistance, March’s opening level at 106.63 and a 61.8% H4 Fib resistance at 106.76 (painted in red).
The latest upside move was likely influenced by a rise in the US dollar index in the aftermath of Cohn’s resignation, and also the fact that we have price trading within the lower limits of a weekly support area coming in at 105.19-107.54 and from a daily support level at 105.50. The next upside objective on the bigger picture can be seen in the shape of a daily channel resistance drawn from the high 113.38.
Potential trading zones:
The red zone noted on the H4 timeframe is likely to produce a bounce. However, traders will want to keep an eye on stop-loss placement here since the 107 handle above could act as a magnet to price.
Something else to keep an eyeball on is a potential retest of 106 as support. Ultimately a bounce from here should be considered an intraday move, given the H4 resistances above and the daily channel resistance line lurking nearby.
Data points to consider: US unemployment claims at 1.30pm GMT.
Areas worthy of attention:
Supports: 105.39; 105.46; 106 handle; 105.50; 105.19-107.54.
Resistances: 106.76/106.50; 107 handle; daily channel resistance.
USD/CAD:
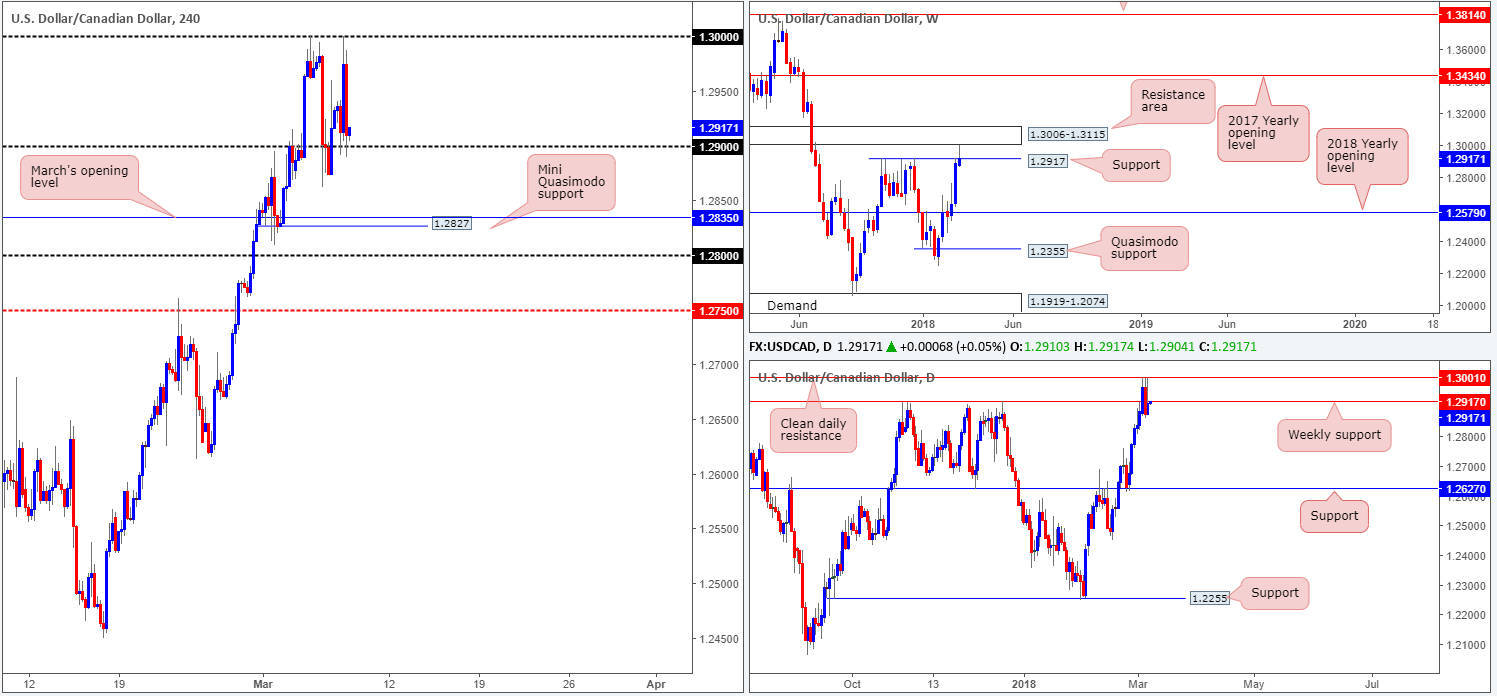
Following a slip to lows of 1.2875, the USD/CAD reclaimed the 1.29 handle and retested it as support during yesterday’s trade. Bolstered by the BoC meeting, this sparked a strong push to the upside which saw the unit reconnect with the 1.30 handle. The Central bank said higher rates are likely warranted over time, but some continued policy accommodation will likely be needed to keep the economy close to potential and inflation on target. The BoC rate decision was left unchanged at 1.25%, as expected.
As of current price, we can see that H4 price is once again toying with 1.29. Weekly price, on the other hand, is seen trading a few pips beneath a weekly level at 1.2917 after coming within a couple of pips of connecting with a weekly resistance area printed at 1.3006-1.3115. Higher-timeframe downside exhibits a healthy range to push lower, with the closest support target seen on the daily timeframe at 1.2627.
Potential trading zones:
With weekly price showing signs of a possible downturn in the midst, trading long from 1.29 is out of the question. Instead, the team’s focus is on a close beneath this number. A close lower, followed up with a retest as resistance would, in our humble view, be enough to warrant further selling down to at least March’s opening level at 1.2835, followed closely by a mini H4 Quasimodo support at 1.2827.
Data points to consider: US unemployment claims at 1.30pm; CAD building permits m/m, CAD NHPI at 1.30pm; BoC Gov. Poloz speaks at 4pm; Gov. Council member Lane speaks at 8.35pm GMT.
Areas worthy of attention:
Supports: 1.29 handle; 1.2835/27; 1.2627.
Resistances: 1.30 handle; 1.3006-1.3115; 1.3001; 1.2917.
USD/CHF:
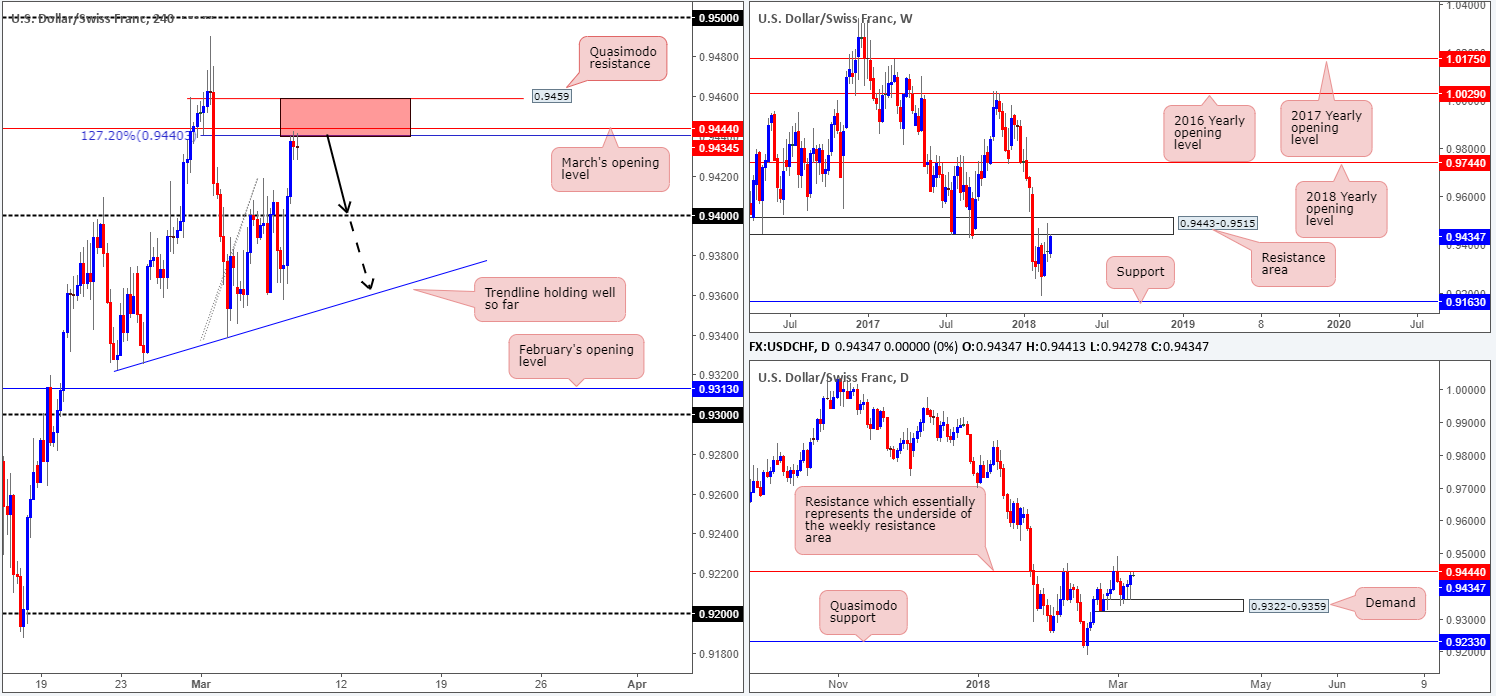
The USD/CHF managed to register its third consecutive gain on Wednesday, breaking through the 0.94 handle and topping just ahead of March’s opening band at 0.9444. This was likely helped by a modest recovery over on the USDX.
March’s opening level at 0.9444 is an interesting barrier. Besides representing a daily resistance level that also denotes the underside of a weekly resistance area at 0.9443-0.9515, the H4 level also boasts a nice-looking 127.2% Fib ext. point at 0.9440. This – coupled with the nearby H4 Quasimodo resistance level at 0.9459 – is, we believe, a strong-looking sell zone.
Potential trading zones:
Between 0.9459/0.9440 (a H4 sell zone highlighted above) we expect to see a downside move take place today, targeting the 0.94 handle, followed by the daily demand at 0.9322-0.9359 (fuses nicely with a H4 trendline extended from the low 0.9322).
Data points to consider: US unemployment claims at 1.30pm GMT.
Areas worthy of attention:
Supports: 0.94 handle; 0.9322-0.9359.
Resistances: 0.9459/0.9440; 0.9444; 0.9443-0.9515.
DOW 30:
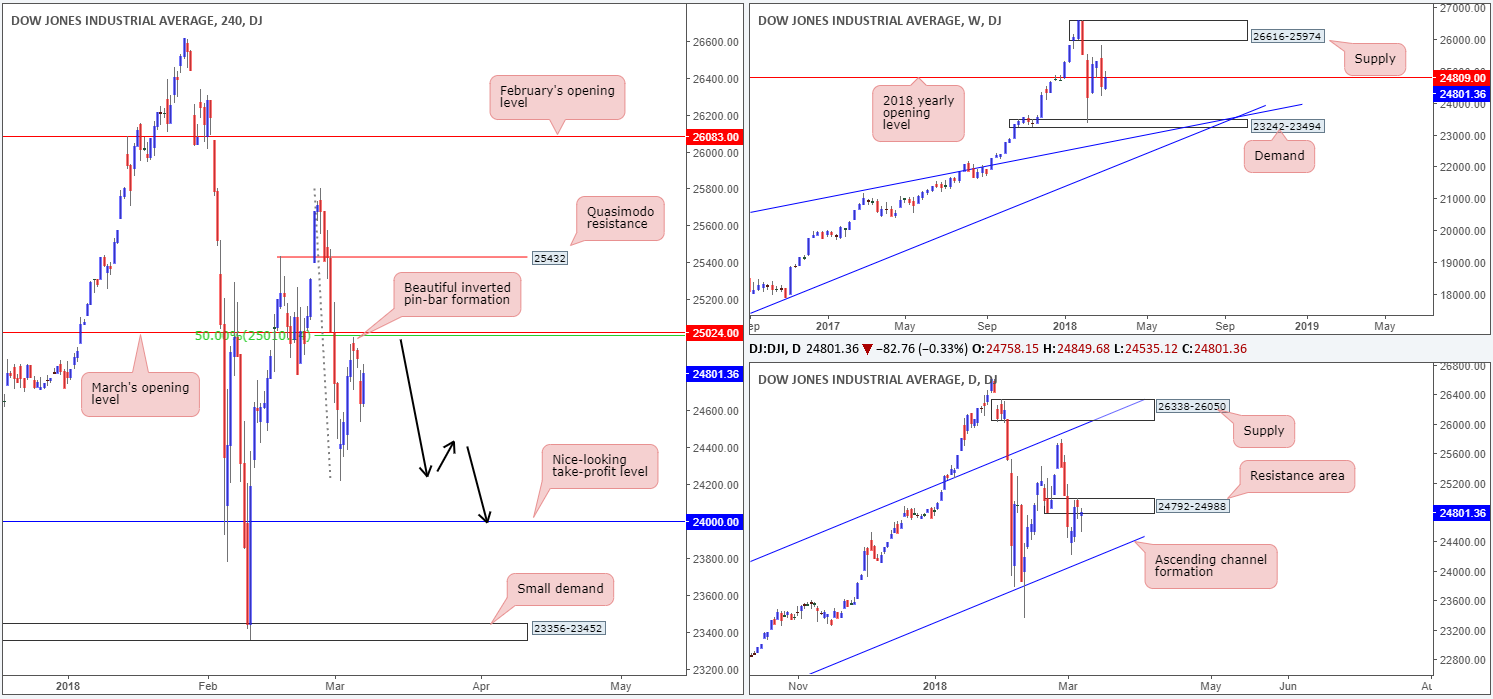
US equities opened with losses on Wednesday as traders reacted to Cohn’s resignation. Cohn had opposed Trump’s plan to introduce tariffs on steel and aluminium imports and his resignation, as the head of President Donald Trump's National Economic Council, increased fears that Trump will impose steep metal tariffs, risking a global trade war.
From a technical standpoint, the downside move was somewhat expected. Writing in Wednesday’s morning report, the team highlighted a potential H4 sell zone in the form of March’s opening level at 25024 and a 50.0% resistance value at 25010. These levels were further reinforced given their position within a daily resistance area printed at 24792-24988 and also due to being located nearby the 2018 yearly opening level at 24809.
Potential trading zones:
Apart from the H4 area underlined on Wednesday, we do not see much else to hang our hat on at the moment. For those already short the unit, we see an ideal take-profit target sited at the 24k mark/the daily channel support extended from the low 17883.
Data points to consider: US unemployment claims at 1.30pm GMT.
Areas worthy of attention:
Supports: 24000; daily channel support.
Resistances: 25024; 24792-24988; 24809.
GOLD:
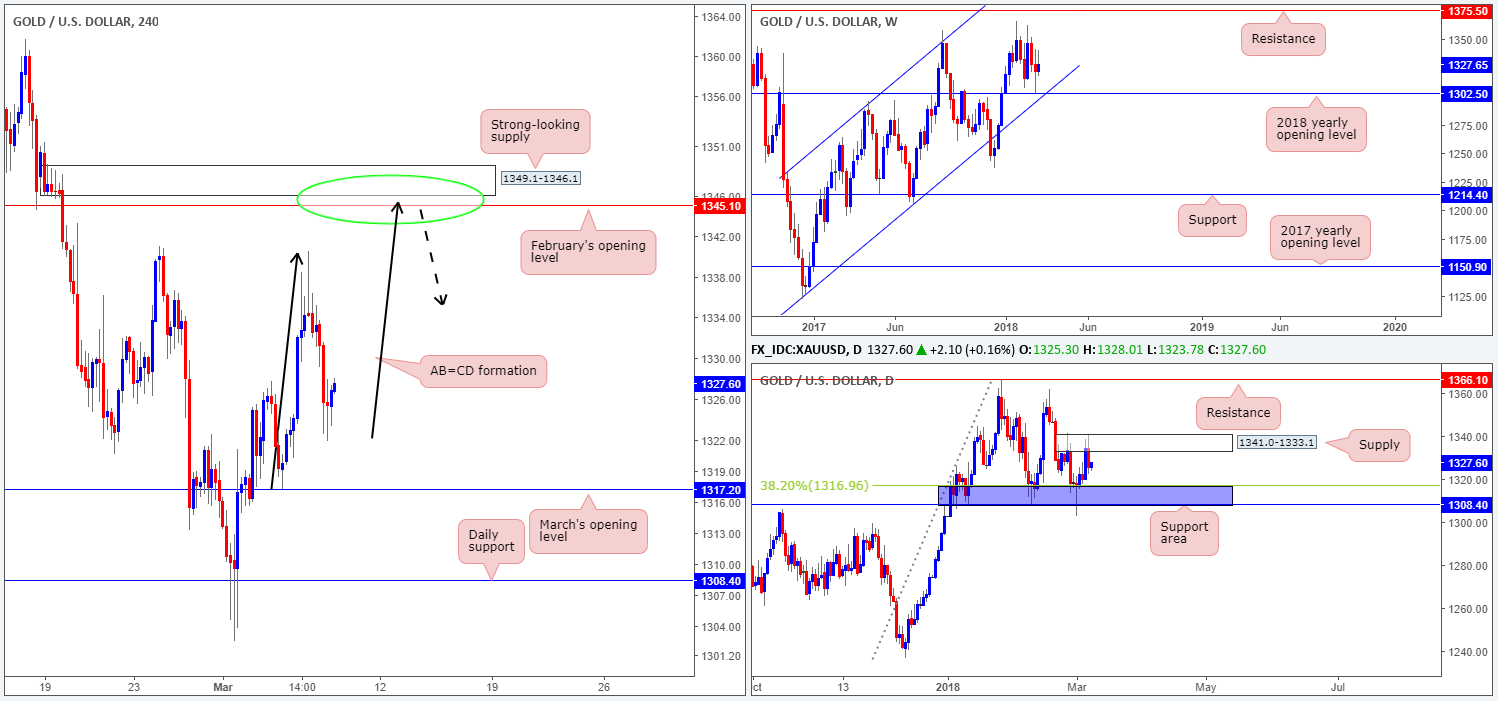
Coming in from the top this morning, we can clearly see that price remains bolstered by the 2018 yearly opening level at 1302.5 on the weekly timeframe. Meanwhile, down on the daily timeframe the unit is seen sandwiched between at daily support area painted in blue at 1308.4/1316.9 and a daily supply zone at 1341.0-1333.1.
Looking across to the H4 timeframe, the yellow metal looks as though its beginning the form a D-leg for a potential H4 AB=CD move that completes around February’s opening level at 1345.1. This – coupled with a robust H4 supply base penciled in at 1349.1-1346.1 – is likely to produce a bounce should it enter the fray today.
Potential trading zones:
Although the above noted H4 area circled in green is positioned slightly above the current daily supply area, and also boasts limited weekly convergence, there’s still a healthy chance that we could see a bounce materialize from here, judging by its surrounding H4 structures. Is it enough to consider placing pending orders? No! Remember, we have limited higher-timeframe confirmation here! Therefore, waiting for a full or near-full-bodied H4 bearish candle to form within the noted H4 zone would, in our book, be a far better approach before pulling the trigger.
In regard to take-profit targets it is still a little difficult to judge when the approach has yet to complete. Ultimately, though, the team has highlighted March’s opening level at 1317.2 (situated directly above the current daily support area) as the final take-profit base.
Areas worthy of attention:
Supports: 1317.2; 1308.4/1316.9; 1302.5.
Resistances: 1349.1-1346.1; 1345.1; 1341.0-1333.1.
This site has been designed for informational and educational purposes only and does not constitute an offer to sell nor a solicitation of an offer to buy any products which may be referenced upon the site. The services and information provided through this site are for personal, non-commercial, educational use and display. IC Markets does not provide personal trading advice through this site and does not represent that the products or services discussed are suitable for any trader. Traders are advised not to rely on any information contained in the site in the process of making a fully informed decision.
This site may include market analysis. All ideas, opinions, and/or forecasts, expressed or implied herein, information, charts or examples contained in the lessons, are for informational and educational purposes only and should not be construed as a recommendation to invest, trade, and/or speculate in the markets. Any trades, and/or speculations made in light of the ideas, opinions, and/or forecasts, expressed or implied herein, are committed at your own risk, financial or otherwise.
The use of the site is agreement that the site is for informational and educational purposes only and does not constitute advice in any form in the furtherance of any trade or trading decisions.
The accuracy, completeness and timeliness of the information contained on this site cannot be guaranteed. IC Markets does not warranty, guarantee or make any representations, or assume any liability with regard to financial results based on the use of the information in the site.
News, views, opinions, recommendations and other information obtained from sources outside of www.icmarkets.com.au, used in this site are believed to be reliable, but we cannot guarantee their accuracy or completeness. All such information is subject to change at any time without notice. IC Markets assumes no responsibility for the content of any linked site. The fact that such links may exist does not indicate approval or endorsement of any material contained on any linked site.
IC Markets is not liable for any harm caused by the transmission, through accessing the services or information on this site, of a computer virus, or other computer code or programming device that might be used to access, delete, damage, disable, disrupt or otherwise impede in any manner, the operation of the site or of any user’s software, hardware, data or property.


