EUR/USD:
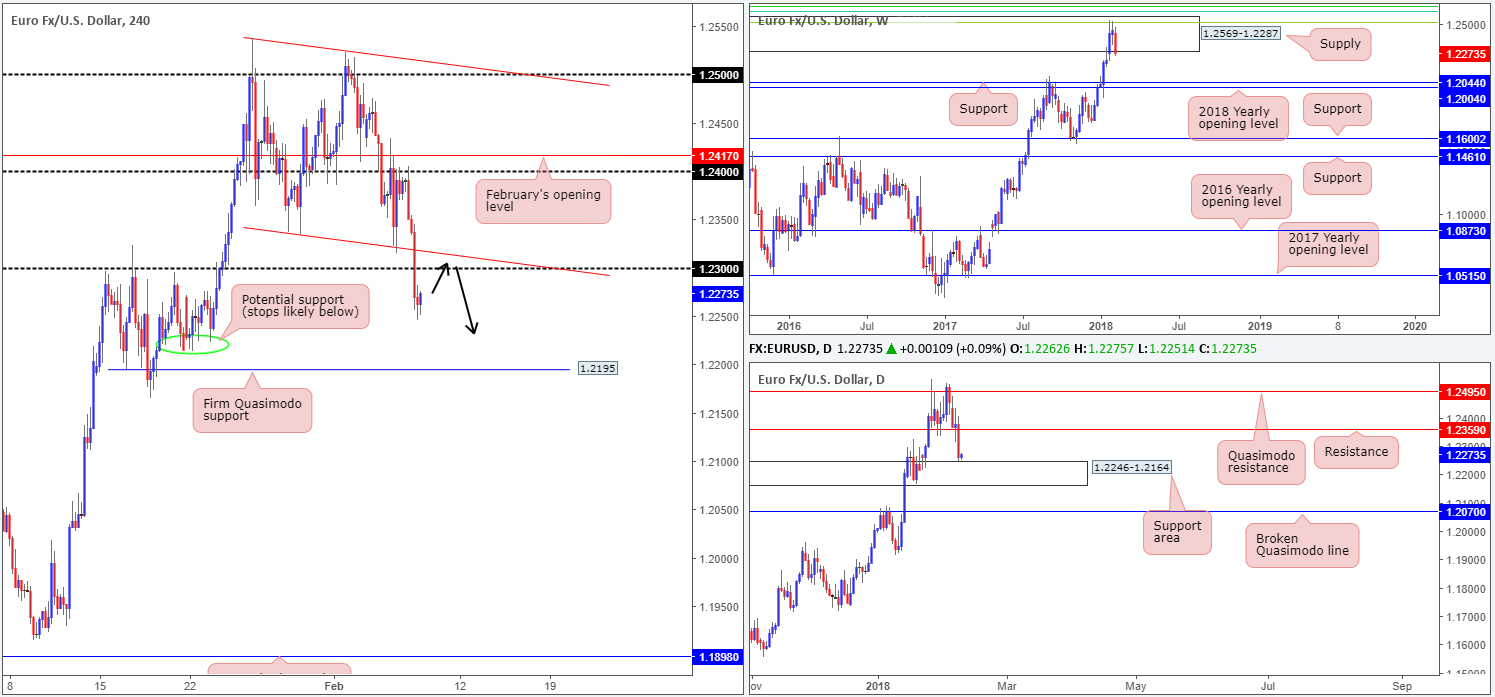
Across the board, the US dollar rose higher against the majority of its trading peers (currently trading at 90.26 on the US dollar index) on Wednesday, consequently placing the single currency under pressure. The euro, as you can see, engulfed both a H4 channel support extended from the low 1.2336 and a psychological support at 1.23, finishing the day at lows of 1.2246.
Meanwhile, over on the bigger picture we can see that weekly sellers are making their presence felt from weekly supply marked at 1.2569-1.2287. Continued selling from this point could lead to an attempt to invade the weekly support at 1.2044, followed closely by the 2018 yearly opening line at 1.2004. On the other side of the coin, however, we have daily price currently shaking hands with the top edge of a daily support area printed at 1.2246-1.2164.
Potential trading zones:
Bids from the top edge of the daily support area will likely pull the unit back up to the underside of the 1.23 region today. Given the number fuses with a nearby H4 channel support-turned resistance, along with weekly price trading from weekly supply, a short from this area could be something to consider. Target objectives are local H4 support circled in green around the 1.2220ish region, shadowed closely by the H4 support level at 1.2195 (both H4 levels are located within the aforementioned daily support area – weekly selling pressure will likely override this).
Data points to consider: German Buba President Weidmann speaks at 8.45am; US unemployment claims at 1.30pm GMT.
Areas worthy of attention:
Supports: 1.2195; 1.2220; 1.2246-1.2164; 1.2044; 1.2004.
Resistances: 1.2569-1.2287; 1.2359; H4 channel resistance; 1.23 handle.
GBP/USD:
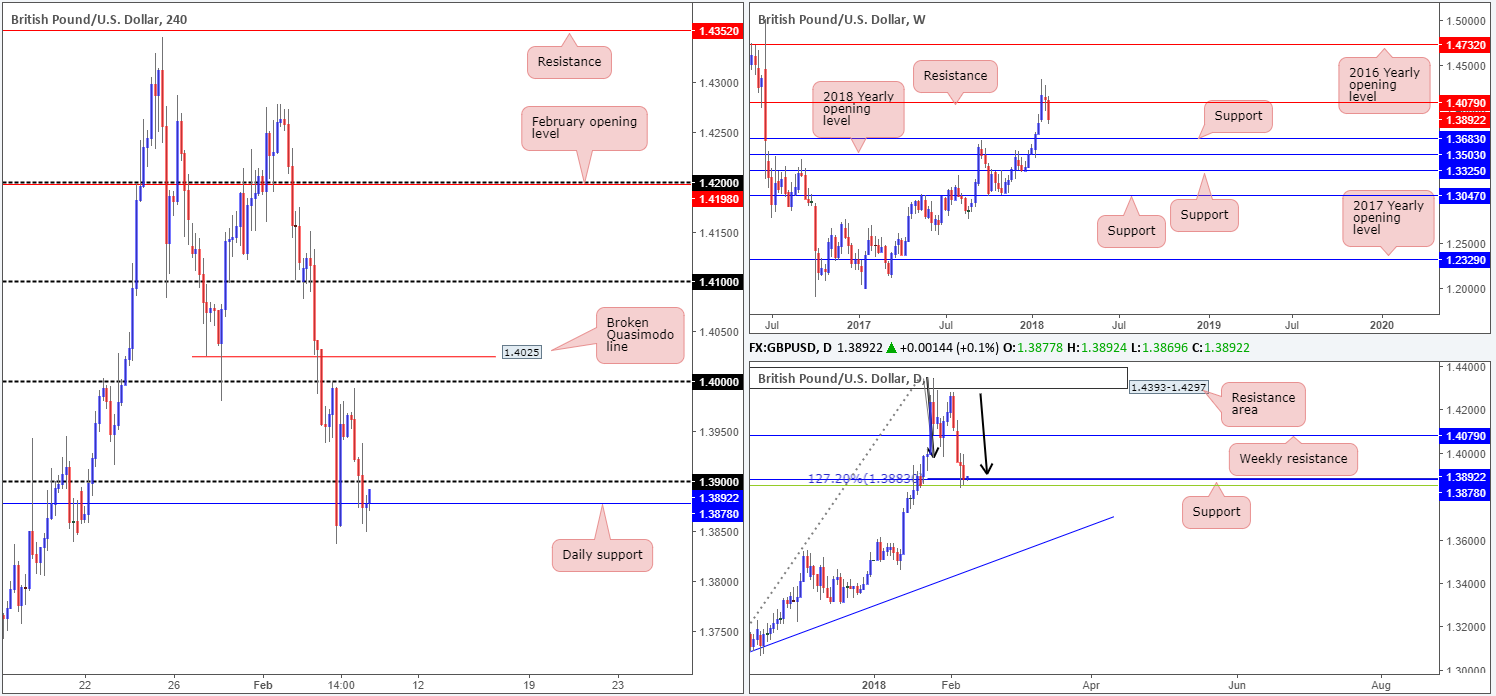
Leaving the large psychological band 1.40 unchallenged, the British pound staged a rather dominant selloff on Wednesday. As you can see, the move enabled the sellers to push the pair beyond the 1.39 handle to a session low of 1.3848. Despite this somewhat bearish tone, the daily support at 1.3878 remains in motion. This level also brings together a daily AB=CD (see black arrows) 127.2% correction point at 1.3883 and a 38.2% daily Fib support at 1.3849. Therefore, although weekly price shows little support on the horizon until we reach 1.3683, the sellers have their work cut out for them should they intend on hunting lower prices today/this week.
Potential trading zones:
Right now, neither a long nor shorts seems attractive.
Not only do we have conflicting opinions coming in from the higher timeframes, we also have limited trade confluence seen on the H4 scale, as a short from the underside of 1.39 has daily buying from the aforementioned daily support to contend with (it’s just too close for comfort, in our view).
Also, let’s keep in mind that we have a heavy day ahead for the GBP today regarding economic data (see below).
Data points to consider: BoE inflation report, MPC official bank rate votes, Monetary policy summary, Official bank rate and MPC asset purchase facility votes all at 12.00pm; US unemployment claims at 1.30pm GMT.
Areas worthy of attention:
Supports: 1.3878; 1.3883; 1.3849; 1.3683.
Resistances: 1.39 handle.
AUD/USD:
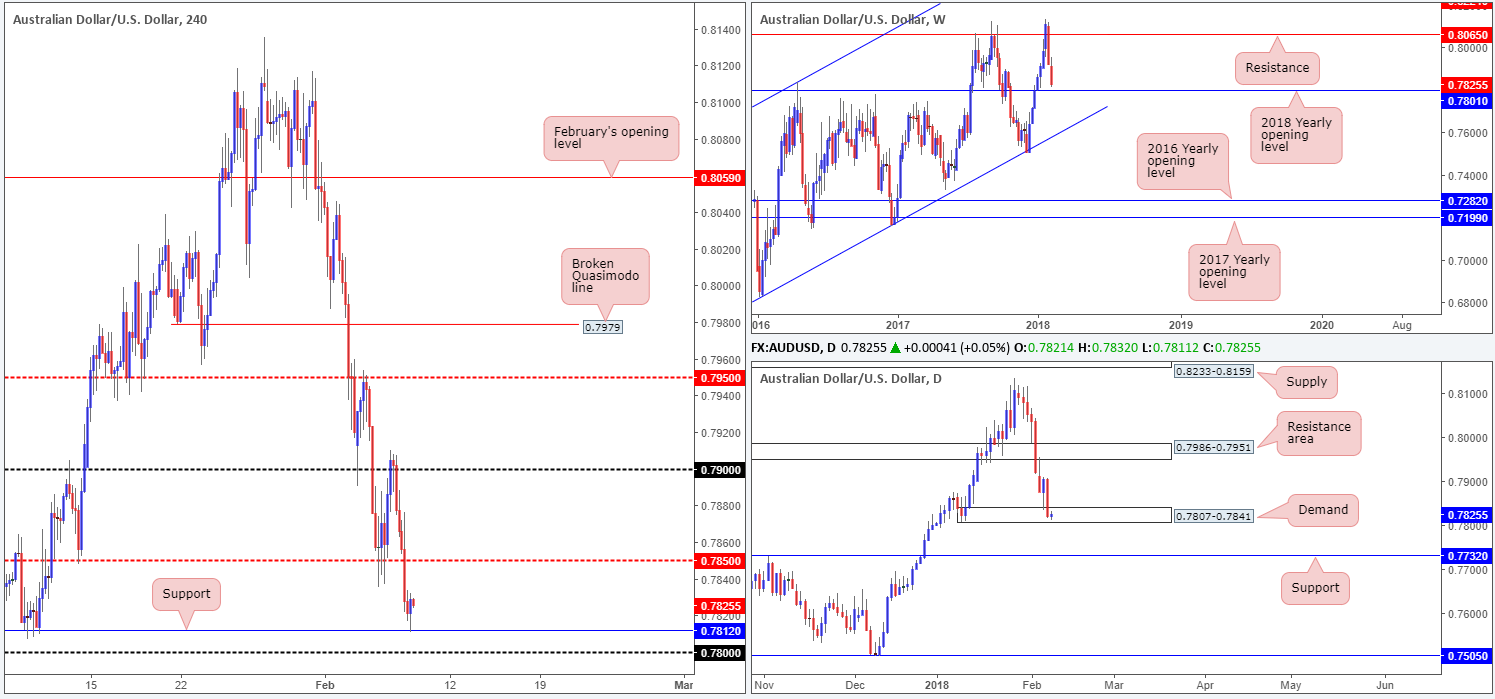
Despite printing a healthy recovery from the top edge of a daily demand base at 0.7807-0.7841 on Tuesday, the commodity currency came under renewed pressure during yesterday’s segment. The daily base, as you can see, remains in play but appears as though it’s on the verge of giving way, which may call for a downside move to daily support pegged at 0.7732.
H4 support at 0.7812 (seen positioned a few pips ahead of the 0.78 handle) is currently holding ground and could encourage further buying back up to retest the recently broken H4 mid-level base at 0.7850. However, with weekly price seen approaching the 2018 yearly opening level seen on the weekly timeframe at 0.7801, the round number 0.78 may be brought into play today.
Potential trading zones:
The current daily demand will, according to weekly structure, likely suffer a breach/fakeout. Breakout sellers will, therefore, likely want to tread carefully here!
Buying from the 0.78 region seems a reasonable location for a bounce, given the connection between this number and the weekly 2018 yearly opening level. In addition to this, stop-loss orders positioned below the current H4 support and the daily demand area will likely be filled should we see an approach to 0.78. These orders, when filled, become sell orders, and therefore provide liquidity for traders to buy from 0.78.
Data points to consider: RBA Gov. Lowe speaks at 9am GMT; US unemployment claims at 1.30pm GMT.
Areas worthy of attention:
Supports: 0.7812; 0.78 handle; 0.7807-0.7841; 0.7801.
Resistances: 0.7850.
USD/JPY:
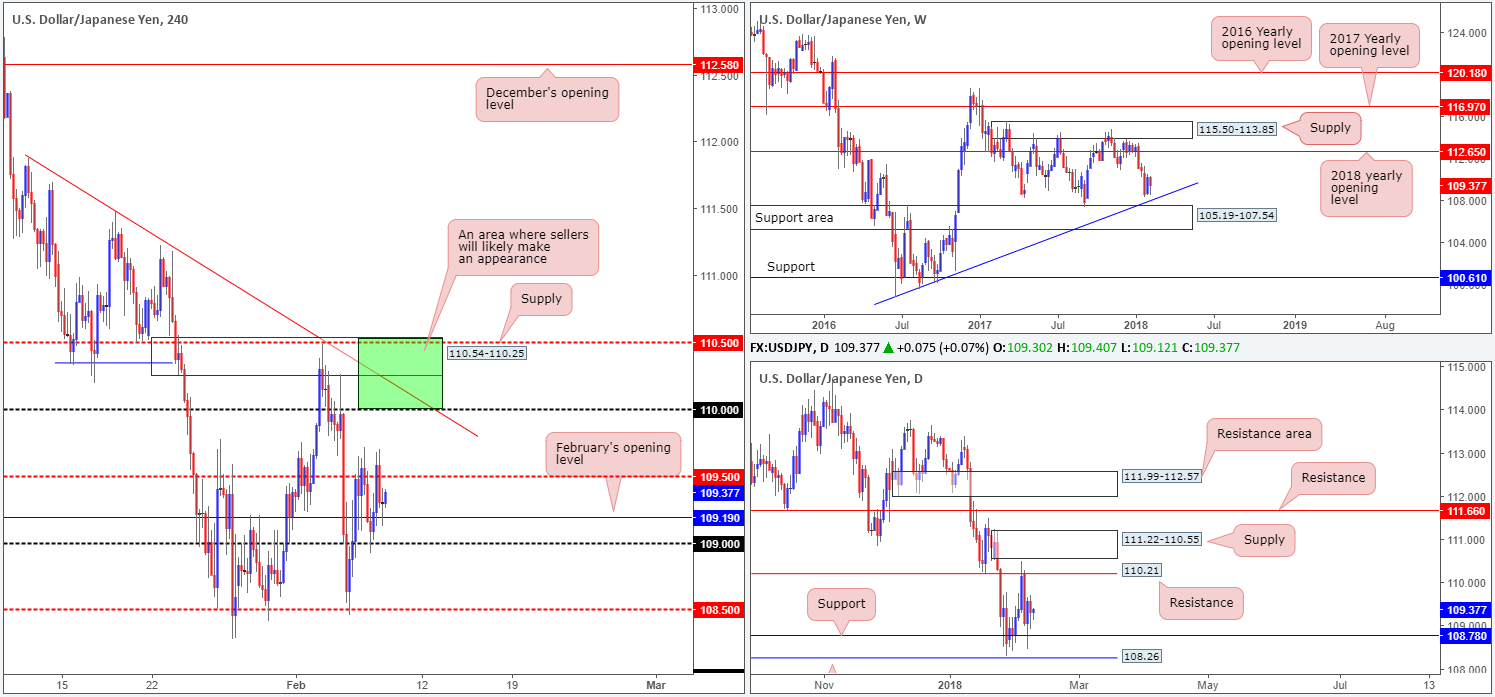
Coming at you from the top this morning, weekly price continues to float ahead of a weekly trendline support etched from the low 98.78 and a nearby weekly support area coming in at 105.19-107.54. Daily price, at the time of writing, remains locked between a daily support level at 108.78 and a daily resistance line at 110.21.
H4 movement spent the majority of Wednesday’s segment oscillating between the H4 mid-level resistance at 109.5 and the 109 handle (also note February’s opening level jammed inside this area at 109.19). Given that there has not been much structural change to this market, much of the following will echo thoughts put forward in yesterday’s report.
Potential trading zones:
As can be seen on the H4 timeframe this morning, price action is reasonably cramped. Above 109.50, however, we have the 110 handle, followed closely by a H4 trendline resistance extended from the high 111.87 and a H4 supply base at 110.54-110.25. Given that these H4 structures collide with the aforesaid daily resistance level, active selling could be seen from the H4 area marked in green.
Data points to consider: US unemployment claims at 1.30pm GMT.
Areas worthy of attention:
Supports: 109 handle; 109.19; 108.78; Weekly trendline support; 105.19-107.54.
Resistances: 109.50; 110 handle; H4 trendline resistance; 110.54-110.25.
This site has been designed for informational and educational purposes only and does not constitute an offer to sell nor a solicitation of an offer to buy any products which may be referenced upon the site. The services and information provided through this site are for personal, non-commercial, educational use and display. IC Markets does not provide personal trading advice through this site and does not represent that the products or services discussed are suitable for any trader. Traders are advised not to rely on any information contained in the site in the process of making a fully informed decision.
This site may include market analysis. All ideas, opinions, and/or forecasts, expressed or implied herein, information, charts or examples contained in the lessons, are for informational and educational purposes only and should not be construed as a recommendation to invest, trade, and/or speculate in the markets. Any trades, and/or speculations made in light of the ideas, opinions, and/or forecasts, expressed or implied herein, are committed at your own risk, financial or otherwise.
The use of the site is agreement that the site is for informational and educational purposes only and does not constitute advice in any form in the furtherance of any trade or trading decisions.
The accuracy, completeness and timeliness of the information contained on this site cannot be guaranteed. IC Markets does not warranty, guarantee or make any representations, or assume any liability with regard to financial results based on the use of the information in the site.
News, views, opinions, recommendations and other information obtained from sources outside of www.icmarkets.com.au, used in this site are believed to be reliable, but we cannot guarantee their accuracy or completeness. All such information is subject to change at any time without notice. IC Markets assumes no responsibility for the content of any linked site. The fact that such links may exist does not indicate approval or endorsement of any material contained on any linked site.
IC Markets is not liable for any harm caused by the transmission, through accessing the services or information on this site, of a computer virus, or other computer code or programming device that might be used to access, delete, damage, disable, disrupt or otherwise impede in any manner, the operation of the site or of any user’s software, hardware, data or property.


