EUR/USD:
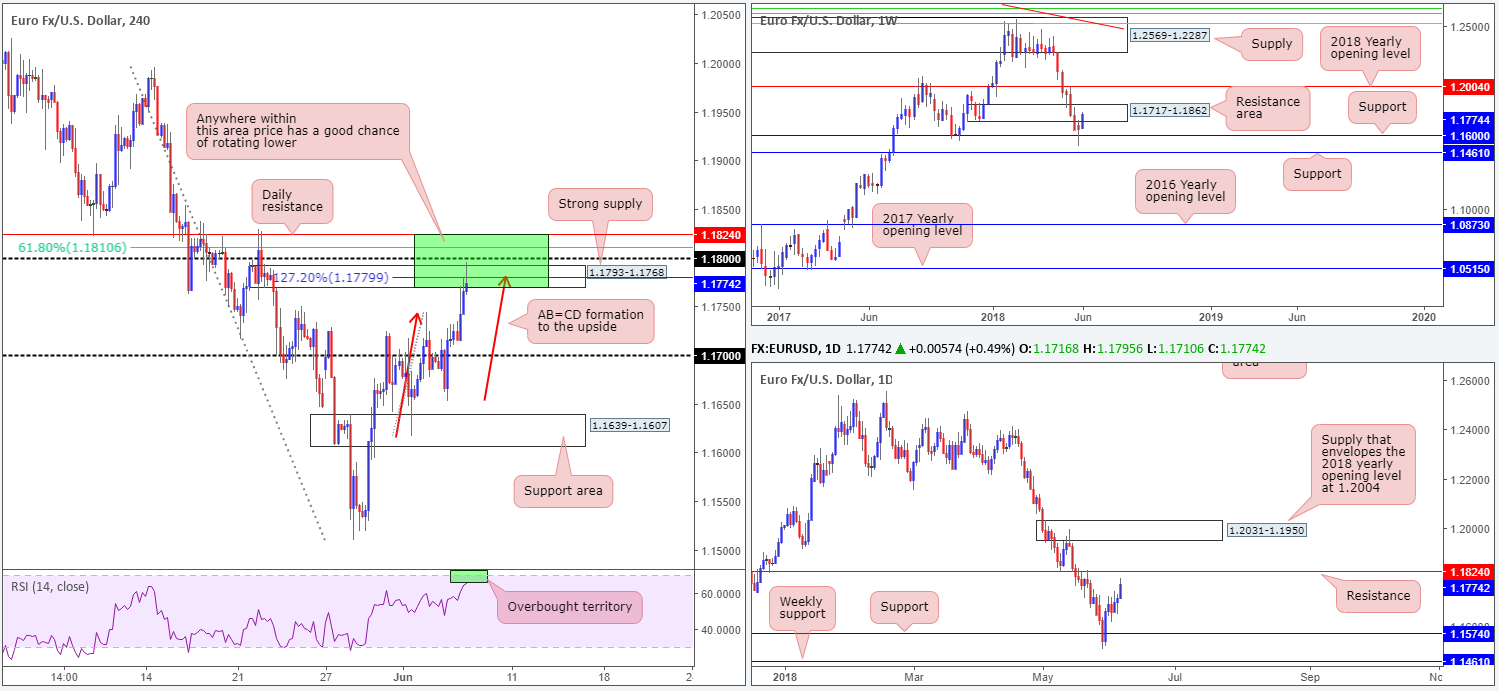
The EUR/USD continued to entice bidders into the market amid trade on Wednesday, consequently lifting H4 price through mid-level resistance at 1.1750 and testing nearby supply seen printed at 1.1793-1.1768. The latest advance came as a consequence of the market’s positive mood on ECB headlines.
What’s also notable from a technical perspective is the H4 AB=CD approach (see red arrows), the 127.2% H4 Fib ext. at 1.1779, the 1.18 handle, a nearby 61.8% H4 Fib resistance at 1.1810 and the H4 RSI approaching overbought territory.
Other key things possibly worth noting is weekly price is currently seen entering the jaws of a resistance area coming in at 1.1717-1.1862, along with daily price seen working towards a test of resistance priced in at 1.1824 (seen within the current weekly resistance zone).
Areas of consideration:
Despite recent buying, we feel price action has entered into an area of strong confluence that suggests the sellers may make an appearance soon. The green area marked on the H4 timeframe at 1.1824/1.1768 is a zone offering multiple resistances spanning an area no greater than 60 pips.
An ideal scenario for a short out of 1.1824/1.1768, at least from where we’re standing, would be for H4 price to drive higher into the noted green sell zone and chalk up a full or near-full-bodied bearish candle around the 1.18 neighborhood. This, given the surrounding confluence, would be considered a strong indication to think about shorts, targeting 1.1750ish as the initial port of call, followed then by the 1.17 region.
Today’s data points: US unemployment claims.
GBP/USD:
In recent sessions, the GBP/USD consolidated its recovery above the 1.34 handle amid USD weakness. Although the pair managed to remain above 1.34, overhead resistance seen on the H4 timeframe in the form of a channel resistance taken from the high 1.3347 and a three-drive completion at around 1.3445ish clearly hindered upside. Also noticeable here is the collection of H4 selling wicks.
If H4 action manages to drive sub 1.34, further downside to the opposite end of the current H4 channel (extended from the low 1.3204) will likely be on the cards. The vibe over on the higher timeframes, however, appears somewhat positive at the moment. Daily structure shows room to appreciate north until we reach the daily resistance area coming in at 1.3458-1.3534, which happens to hold the 2018 yearly opening level situated on the weekly timeframe at 1.3503.
Areas of consideration:
Keeping it Simple Simon today, we see two possible scenarios to keep a tab on:
- Wait and see if H4 price can CLOSE below 1.34 and retest the underside of this number as resistance, before reaching 1.3350. Should this occur, and price action holds firm beneath 1.34, intraday shorts are potentially possible to at least 1.3350.
- Assuming the bulls remain in the driving seat, the nearby H4 resistance area at 1.3488-1.3453 appears prime for a sell. This is due to the H4 zone being glued to the underside of the aforementioned daily resistance area, and a 61.8% H4 Fib resistance value at 1.3459 seen fixed within its walls. The only grumble here is a possible fakeout above the area to tag in orders around 1.35, which also represents the 2018 yearly opening level on the weekly timeframe at 1.3503. To help avoid this fakeout, one could simply wait and see if H4 price prints a full or near-full-bodied bearish candle before pulling the trigger. This helps show seller intent and allows one to position stops above the candle’s wick, sometimes offering a more favorable risk/reward scenario.
Today’s data points: UK Halifax HPI m/m; MPC member Ramsden speaks; US unemployment claims.

AUD/USD:
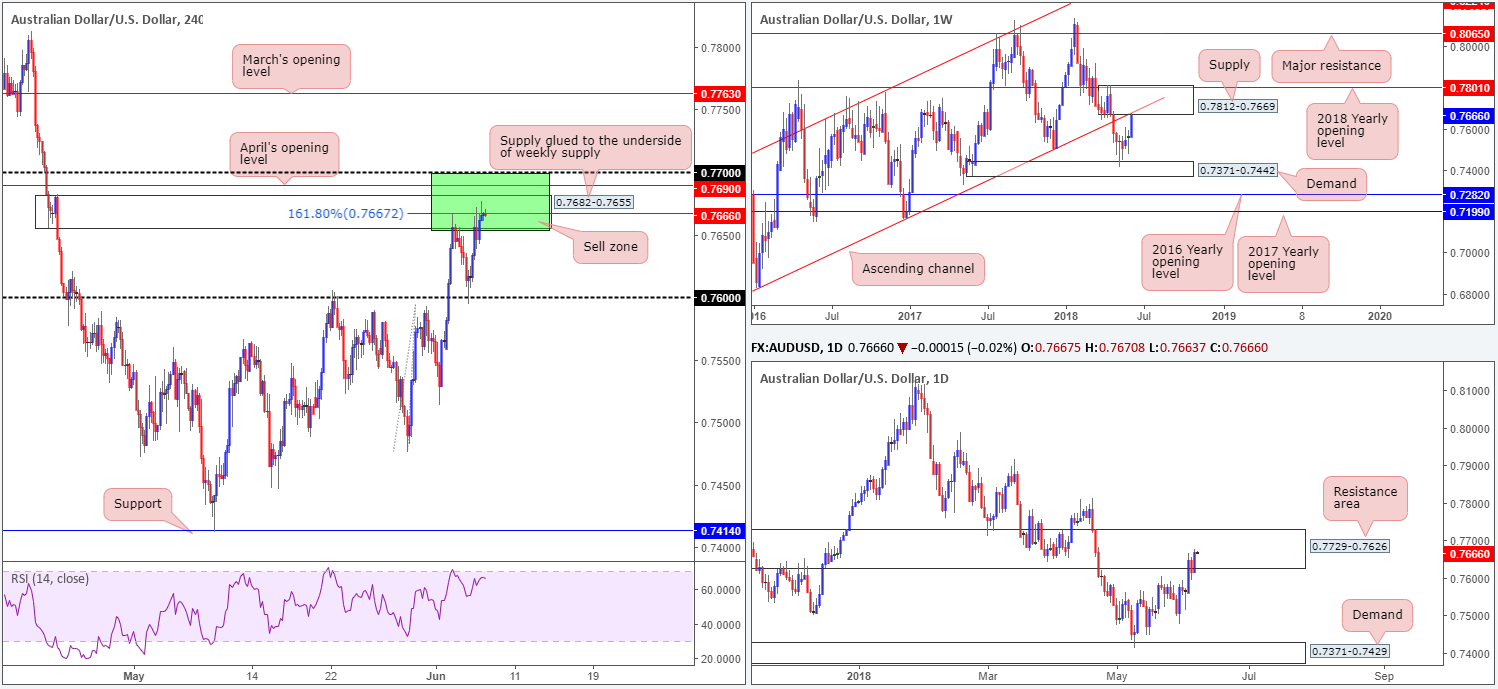
Following considerably stronger-than-expected Australian growth data, the Aussie dollar regained momentum and propelled itself into the walls of a nearby H4 supply seen at 0.7682-0.7655.
While risk appetite remains healthy, the technical pendulum appears to be swinging toward more of a downside move at the moment. As already mentioned, H4 price is currently seen treading water within the confines of a supply zone at 0.7682-0.7655. Note that this area also houses a 161.8% H4 Fib ext. point at 0.7667 within, and is positioned just south of April’s opening level on the H4 scale at 0.7690 and the 0.77 handle. This area also benefits from being sited within a daily resistance area drawn from 0.7729-0.7626, and pasted to the underside of a weekly supply at 0.7812-0.7669 and its intersecting channel support-turned resistance (extended from the low 0.6827).
Areas of consideration:
On account of the above, the current H4 supply could offer traders the opportunity to get short today. With that being said, though, we would be inclined to include April’s opening level at 0.7690 and the 0.77 handle here, since these levels are likely to act as a magnet for a fakeout above the said H4 supply.
To that end, should H4 price print a full or near-full-bodied bearish candle within the green H4 zone between 0.77/0.7655, shorts are a strong possibility with an initial target objective set at 0.76.
Today’s data points: US unemployment claims.
USD/JPY:
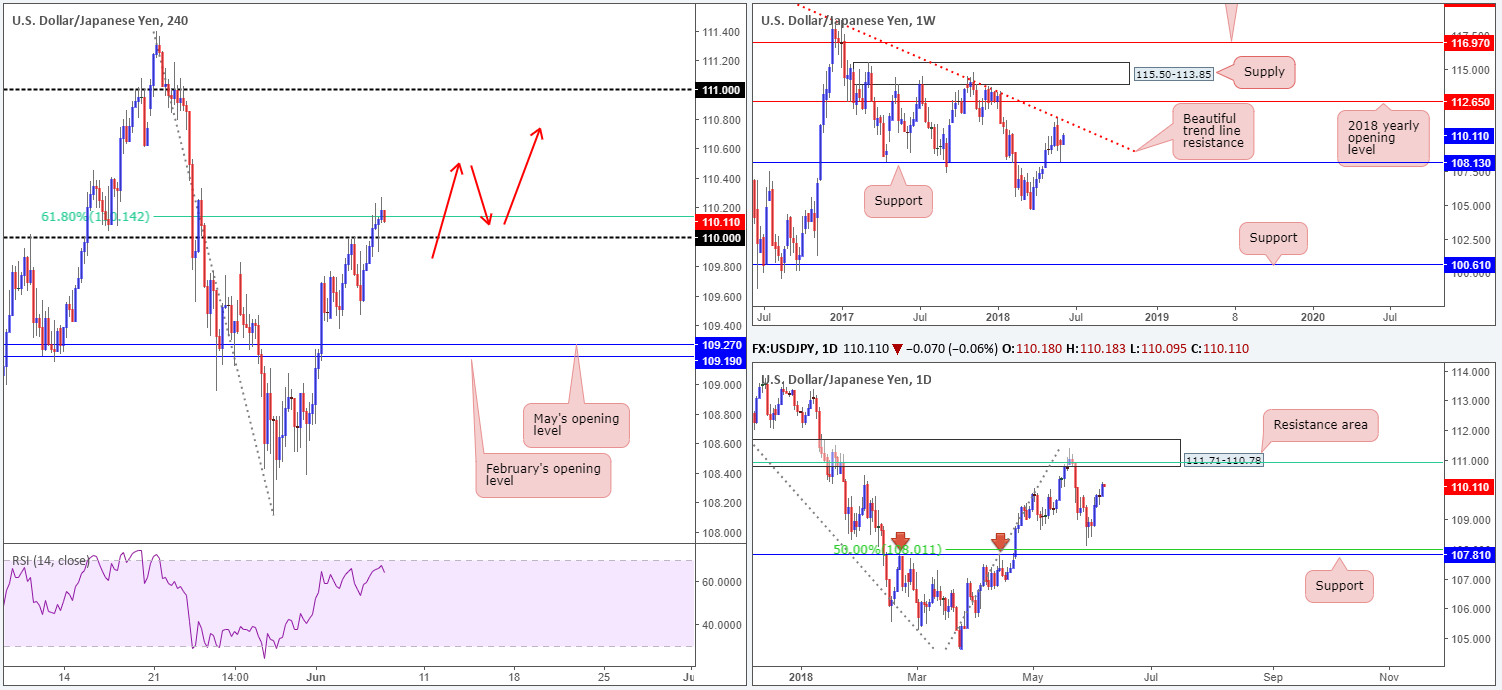
The USD/JPY is seen trading with a reasonably strong bias to the upside this morning. Bolstered by a firmly bid US equity market, the 110 handle on the H4 timeframe, along with the nearby 61.8% H4 Fib resistance seen at 110.14, came under pressure during the course of Wednesday’s movements.
Turning our attention to daily structure, the next port of call to the upside can be seen at 111.71-110.78: a strong resistance area that converges with a 61.8% daily Fib resistance value at 110.91 (green line). Further to this, we can also see that the daily area unites with long-term weekly trend line resistance extended from the high 123.67.
Areas of consideration:
Given the higher timeframes display possible intent to gravitate higher, the team has noted that longs above the 110.14/110 region on the H4 scale are worthy of attention.
An ideal setup, as highlighted in Wednesday’s briefing, would be for H4 price to decisively close above 110.14/110 followed by a retest of the area as support in the shape of a full or near-full-bodied bull candle. A long on the close of this candle, with stops tucked below the tail, will likely offer favorable risk/reward should your take-profit target be set at the underside of the noted daily resistance area.
Today’s data points: US unemployment claims.
USD/CAD:
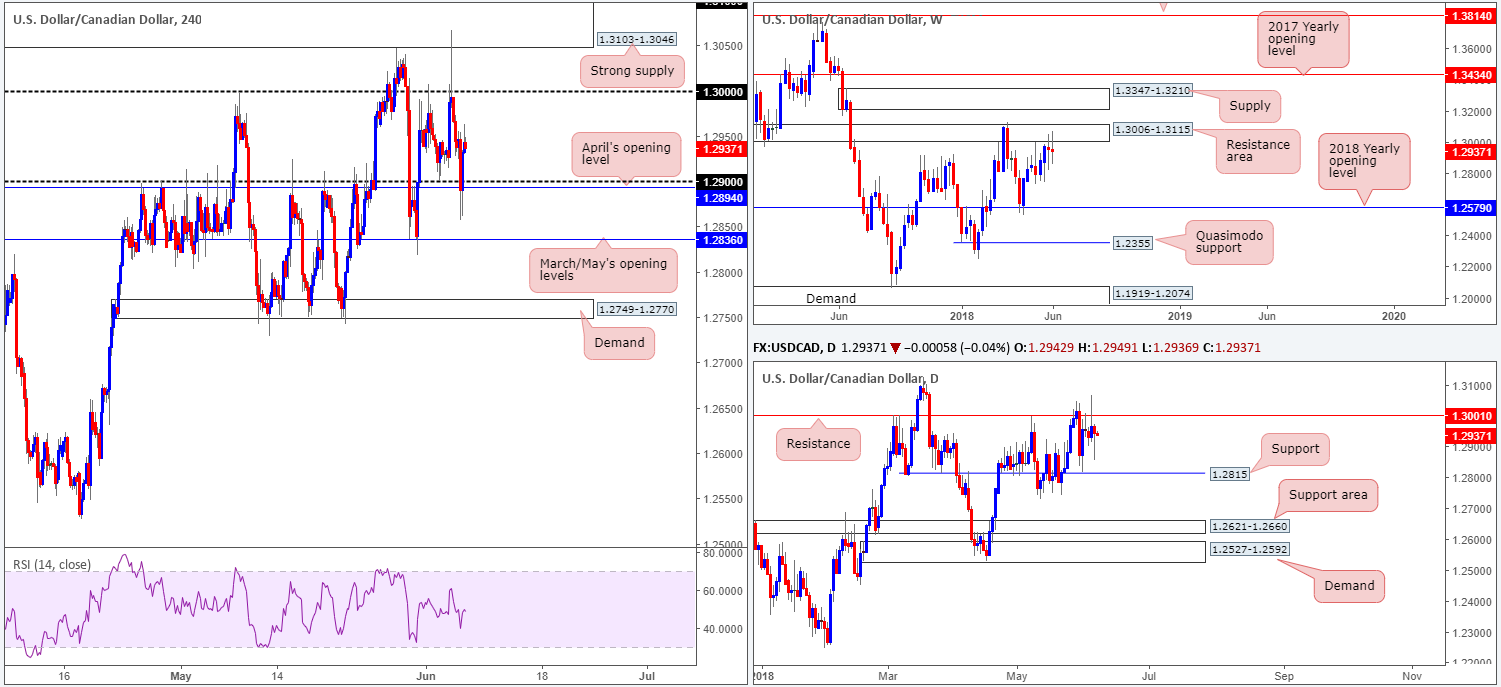
The commodity-sensitive Canadian dollar experienced a modest bout of selling amid early London hours on Wednesday, forcing H4 action to surpass 1.29 and test fresh weekly lows of 1.2856. As you can see, though, the move was quickly countered, bringing the H4 candles back above 1.29 into the closing bell.
In terms of economic data, Canadian trade balance rose to a record high in April, bringing the trade deficit down to $1.9B. Meanwhile, crude oil inventories showed an unexpected build in crude oil stockpiles.
While H4 price is finding it difficult to set direction beyond 1.30/1.29, the bigger picture reveals weekly flow remains capped around the underside of a resistance area seen at 1.3006-1.3115. In conjunction with weekly structure, the daily candles are seen interacting with resistance coming in at 1.3001. We must, however, point out that yesterday’s action formed a nice-looking bullish pin-bar formation not too far from daily support priced in at 1.2815.
Areas of consideration:
Having noted that both weekly and daily price show potential to selloff, we see the two possible scenarios:
- Wait and see if H4 price can close below 1.29 and retest the underside of this number as resistance. A successful retest should be enough to draw in intraday sellers with an initial target objective set at 1.2836 (March/May’s opening levels), followed by daily support priced in at 1.2815.
- A pullback to 1.30 for a sell could also be an option, targeting 1.29 as the initial take-profit target. However, on taking trades off 1.30 traders need to remain cognizant of the possibility that price could fake above 1.30 to test H4 supply seen at 1.3103-1.3046, which happens to be sited within the walls of the noted weekly resistance area. Therefore, an ideal scenario here would be for H4 price to print a bearish pin-bar formation that pierces through 1.30 and taps the underside of the said H4 supply. Stop-loss orders could then comfortably be positioned above the rejection candle’s tail.
Today’s data points: BoC financial system review; BoC Gov. Poloz speaks; US unemployment claims.
USD/CHF:
Note – Outlook remains similar to that advertised in Wednesday’s report.
The USD/CHF managed to claw back some of its recent losses on Wednesday, as the Swiss Franc struggled to find demand.
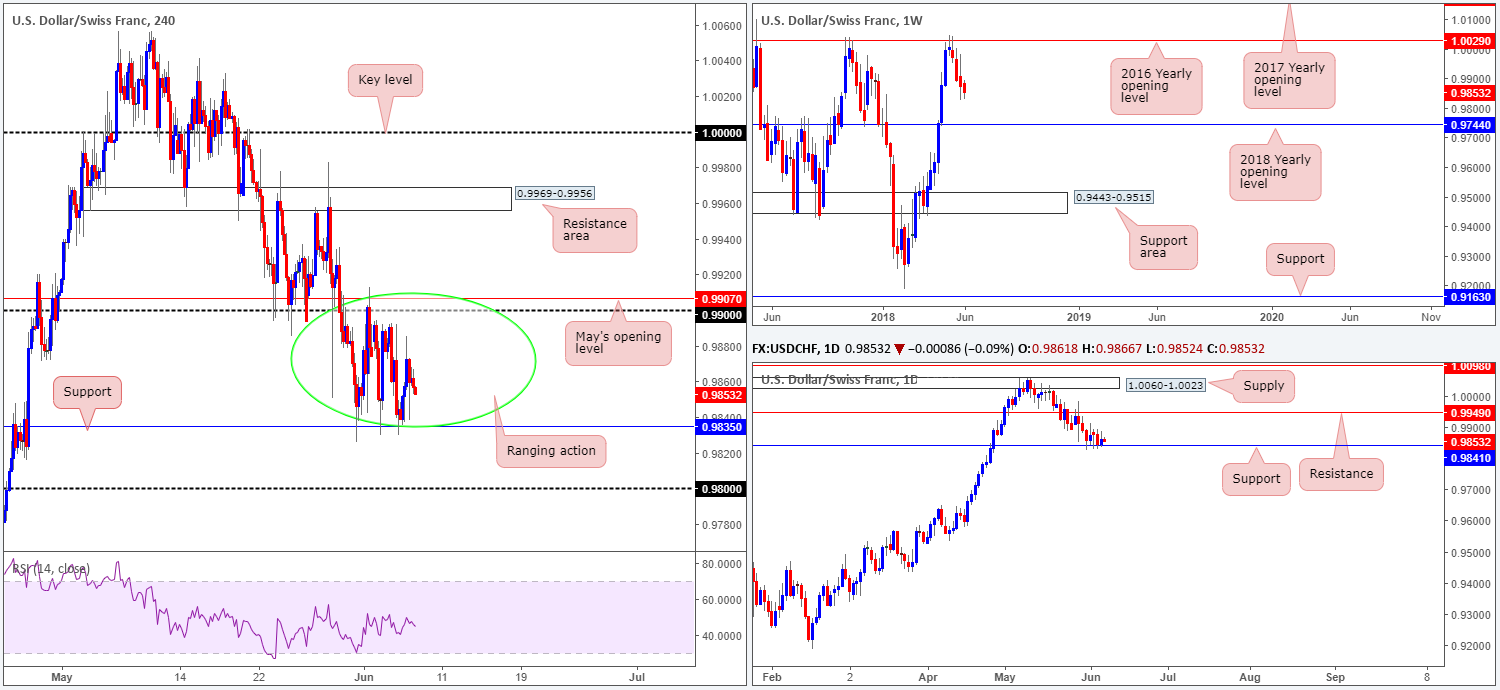
As you can see on the H4 timeframe this morning, the pair remains entrenched within a consolidation between H4 support at 0.9835 and the 0.99 handle/May’s opening level at 0.9907. Surrounding structure on the H4 scale remains at the 0.98 handle and a H4 resistance zone coming in at 0.9969-0.9956.
Traders may have also noticed that supporting the lower edge of the H4 range is a daily support level seen at 0.9814. This level boasts historical significance stretching as far back as mid-2013. Therefore, it is not a barrier one should overlook! Contrary to this, though, weekly movement continues to reflect a bearish stance. The pair sustained further losses during last week’s action, marking the unit’s third consecutive weekly loss off the 2016 yearly opening level seen on the weekly timeframe at 1.0029. In terms of weekly structure, there’s really not very much support seen in view until the unit reaches the 2018 yearly opening level marked at 0.9744.
Areas of consideration:
Intraday, traders may look to the current H4 range for opportunity. We would, however, advise waiting for additional candle confirmation in the shape of a full or near-full-bodied candle rotation, be it on the H4 or H1 timeframe, before pulling the trigger. Stops are best placed beyond the candles rejection wick/tail and the take-profit targets are best set at the opposite end of the range.
Longer term, this market is at conflict. Daily price suggests buying could be in store, whereas weekly action indicates that we could be in for further downside.
Today’s data points: US unemployment claims.
Dow Jones Industrial Average:
Risk appetite soared on Wednesday, as traders closely tracked developments between the US and its key global partners.
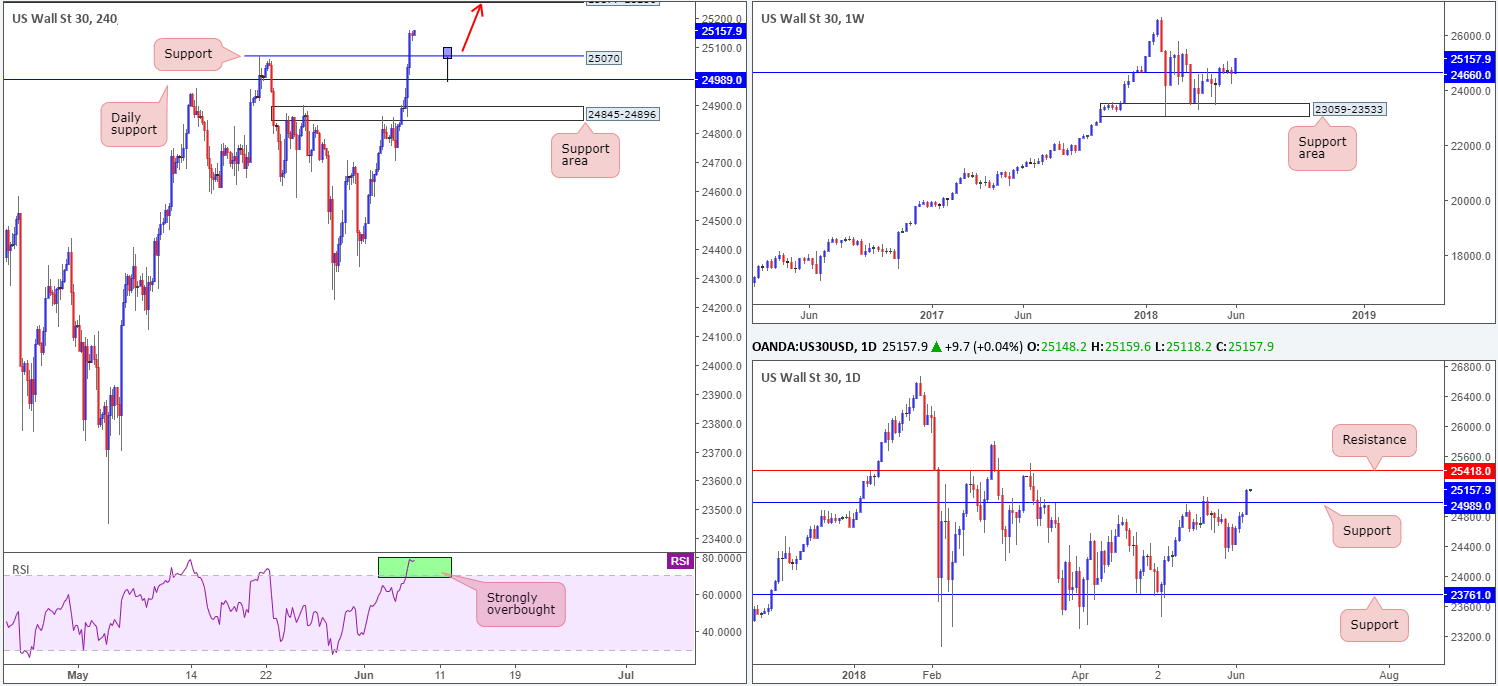
The recent advance, as can be clearly seen on the weekly timeframe, has placed the DJIA firmly above its 2018 yearly opening level at 24660. What this move also accomplished was a break of daily resistance marked at 24989, potentially clearing the pathway north for a move towards daily resistance plotted at 25418.
Across on the H4 timeframe, the RSI indicator is seen clearly displaying a strong overbought reading at the moment, as H4 price hovers above nearby support at 25070. The next upside hurdle, should the buyers continue to feed the market, can be seen at a H4 supply zone coming in at 25377-25256 (not seen on the screen).
Areas of consideration:
Watch for H4 price to retest the recently broken line of 25070 as support today for a possible move up to the aforementioned H4 supply, followed by daily resistance mentioned above at 25418. An ideal scenario for buyers here, in our humble view, would be for H4 price to chalk up a bullish pin-bar formation that pierces through the current support and tags in buyers waiting around the nearby daily support at 24989 (see H4 chart for a drawn image). Entry can be found at the candle close, with stops positioned beneath the candle’s tail.
Today’s data points: US unemployment claims.
XAU/USD (Gold)
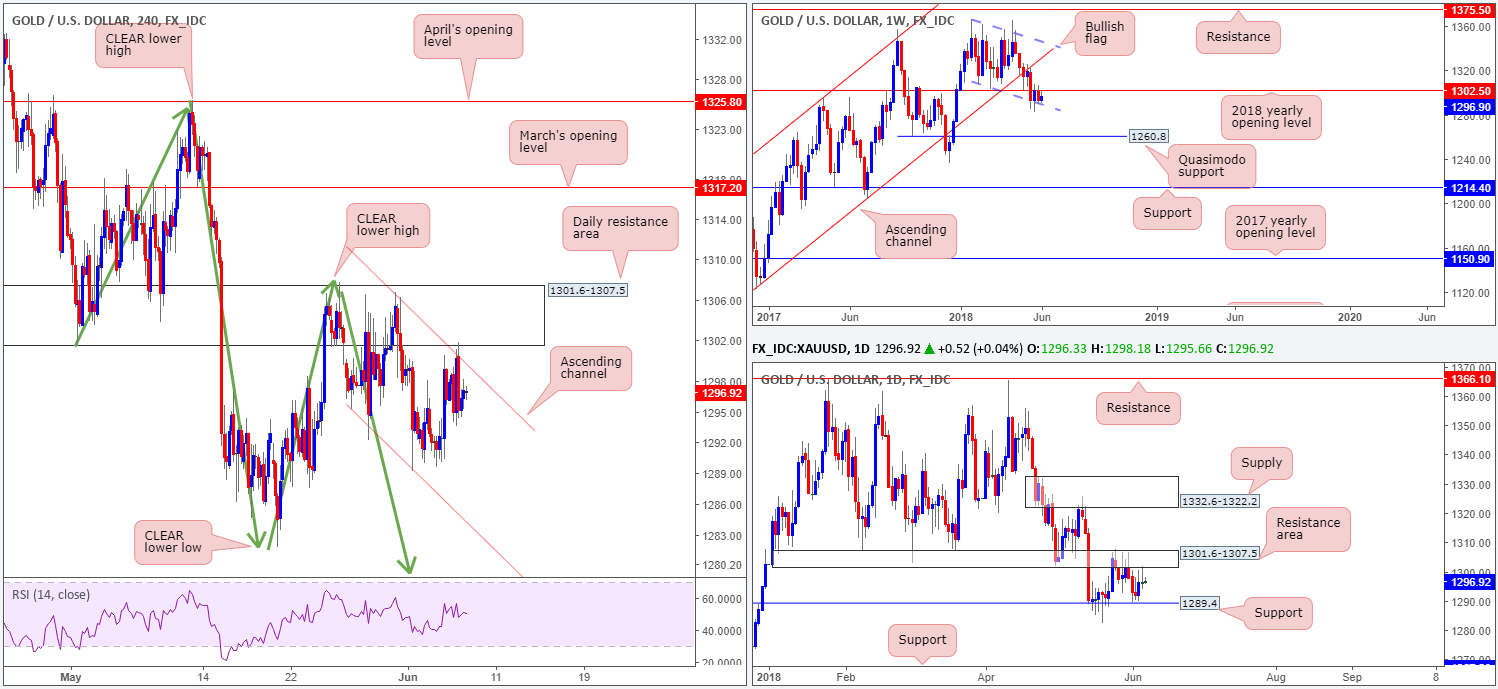
Amid Wednesday’s trade, we can see that H4 price grazed the underside of a daily resistance area at 1301.6-1307.5, and its intersecting H4 channel resistance extended from the high 1306.8. From this point, the team remains supportive of a lower low taking place on the H4 scale (a break of the swing low 1285.8). This expectation will only be discounted on a H4 close above the clear lower high seen on the H4 timeframe at 1307.7.
Casting our lines a little higher, we are able to see that daily movement remains sandwiched between the aforementioned daily resistance area and a daily support level drawn in from 1289.4. In similar fashion, weekly movement is also seen tightly confined between the 2018 yearly opening level at 1302.5 and the lower edge of a weekly bullish flag formation taken from the low 1346.1. Anyone get the feeling that this market is about ready to burst?
Areas of consideration:
As the expectation is for a lower low to form on the H4 timeframe, we feel shorts at current price could be a consideration, with stop-loss orders placed above the clear lower high on the H4 timeframe at 1307.7. Reducing risk to breakeven and taking partial profits off the table once, or indeed if, H4 flow tests lows of 1281.8 is recommended.
The use of the site is agreement that the site is for informational and educational purposes only and does not constitute advice in any form in the furtherance of any trade or trading decisions.
The accuracy, completeness and timeliness of the information contained on this site cannot be guaranteed. IC Markets does not warranty, guarantee or make any representations, or assume any liability with regard to financial results based on the use of the information in the site.
News, views, opinions, recommendations and other information obtained from sources outside of www.icmarkets.com.au, used in this site are believed to be reliable, but we cannot guarantee their accuracy or completeness. All such information is subject to change at any time without notice. IC Markets assumes no responsibility for the content of any linked site. The fact that such links may exist does not indicate approval or endorsement of any material contained on any linked site.
IC Markets is not liable for any harm caused by the transmission, through accessing the services or information on this site, of a computer virus, or other computer code or programming device that might be used to access, delete, damage, disable, disrupt or otherwise impede in any manner, the operation of the site or of any user’s software, hardware, data or property.


