A note on lower timeframe confirming price action…
Waiting for lower timeframe confirmation is our main tool to confirm strength within higher timeframe zones, and has really been the key to our trading success. It takes a little time to understand the subtle nuances, however, as each trade is never the same, but once you master the rhythm so to speak, you will be saved from countless unnecessary losing trades. The following is a list of what we look for:
- A break/retest of supply or demand dependent on which way you’re trading.
- A trendline break/retest.
- Buying/selling tails – essentially we look for a cluster of very obvious spikes off of lower timeframe support and resistance levels within the higher timeframe zone.
- Candlestick patterns. We tend to only stick with pin bars and engulfing bars as these have proven to be the most effective.
For us, lower timeframe confirmation starts on the M15 and finishes up on the H1, since most of our higher timeframe areas begin with the H4.
EUR/USD:
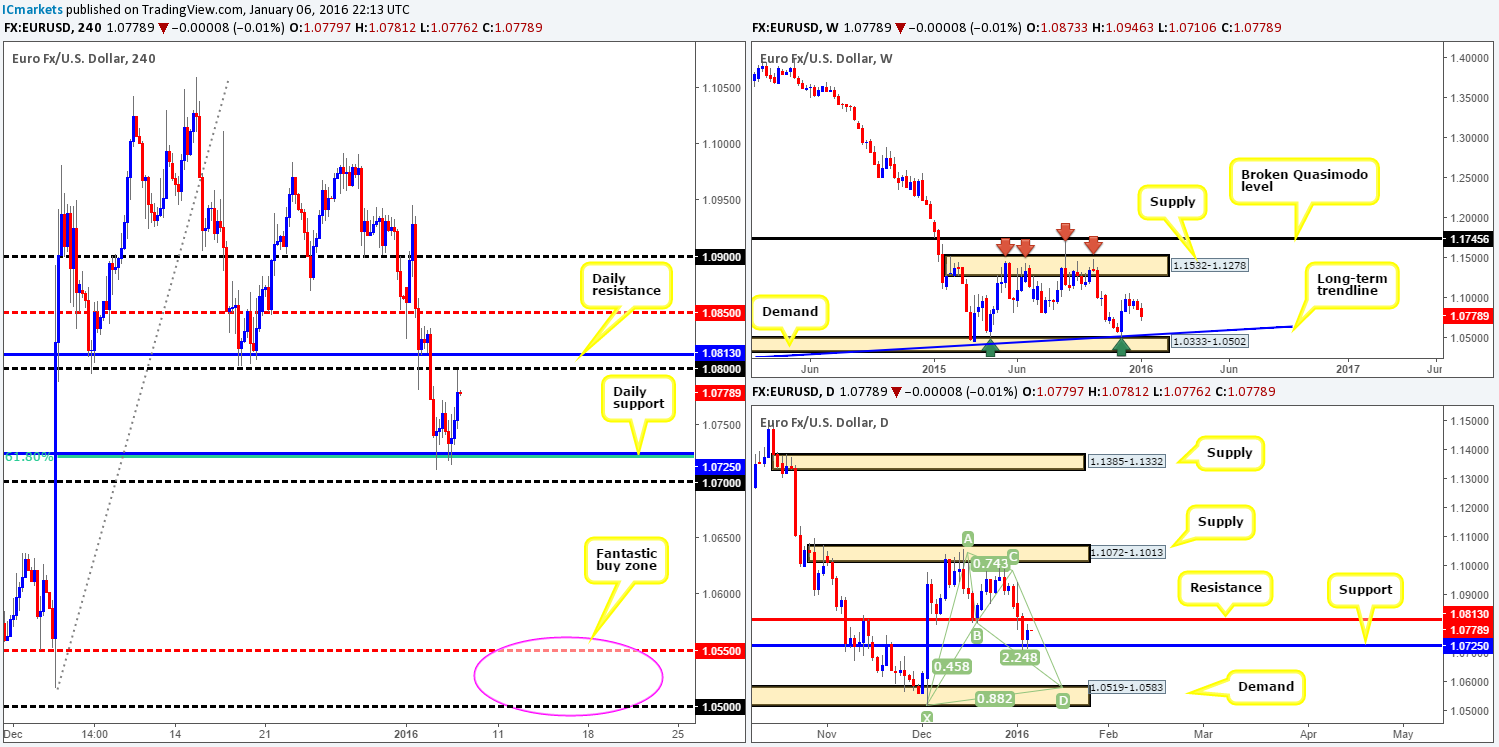
In our previous report (http://www.icmarkets.com/blog/wednesday-6th-january-heavy-volatility-expected-from-midday-onwards-today-remain-vigilant/) we mentioned that psychological support 1.0700/daily support 1.0725 would potentially be a nice platform to look for lower timeframe buying opportunities. Well done to any of our readers who managed to take advantage of this move from here yesterday, as price has just successfully reached its final target – 1.0800.
With this trade complete, where we go from here is a difficult one due to the single currency now being sandwiched between the aforementioned daily support, and a daily resistance just above current prices at 1.0813. Of course, trading in between this capped area is a possibility. However, we would require lower timeframe confirmation at these extremes before risking capital here due to the high probability a fakeout could occur.
If this area breaks, ideally we’re looking for it to break south. Reason being, as we explained in our previous report, market participants will likely then be honing in on the bullish Harmonic Bat pattern currently forming on the daily chart. The completion point of this pattern converges with daily demand at 1.0519-1.0583, and lurks very close to weekly demand at 1.0333-1.0502 as well. Therefore, to include the upper limits of each higher timeframe structures, our buy zone on the H4 chart (if it comes to fruition) can be seen between 1.0550/1.0500 (pink circle).
With this being the case, a close below 1.0800 today could provide traders the chance to short if a confirmed retest of this barrier is seen thereafter, targeting our (pink circle) H4 buy zone just mentioned above.
Levels to watch/live orders:
- Buys: 1.0725/1.0700 [Tentative – confirmation required] (Stop loss: Dependent on where one confirms this area). 1.0550/1.0500 [Tentative – confirmation required] (Stop loss: Dependent on where one confirms this area).
- Sells: 1.0800/1.0813 [Tentative – confirmation required] (Stop loss: Dependent on where one confirms this area). Watch for bids to be consumed around 1.0725/1.0700 and then look to trade any retest of this area thereafter (lower timeframe confirmation preferred).
GBP/USD:
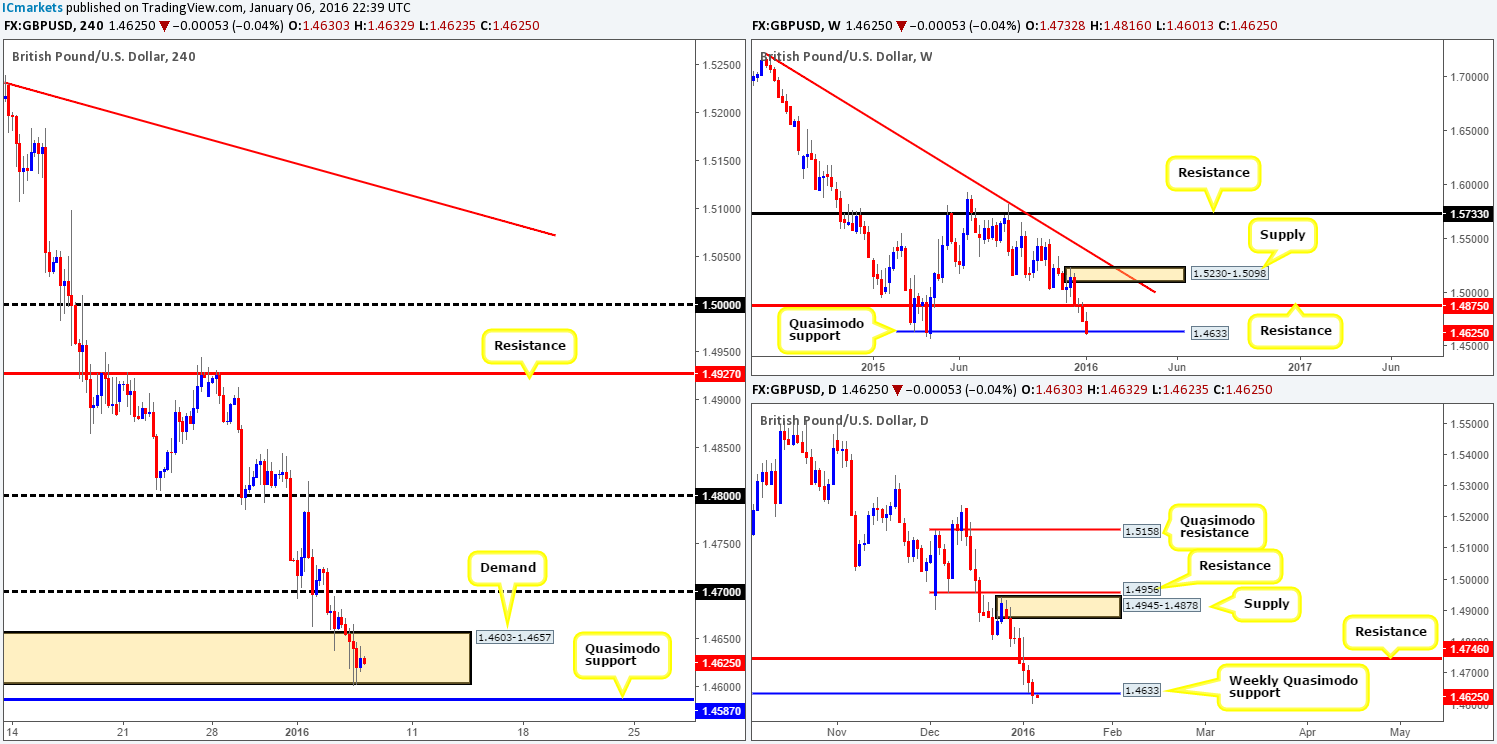
Following on from our previous report (http://www.icmarkets.com/blog/wednesday-6th-january-heavy-volatility-expected-from-midday-onwards-today-remain-vigilant/), our live buy trade taken from 1.4658 came within four pips of being stopped out yesterday, before rallying a little higher into the close 1.4630. As you can see, price still resides in H4 demand drawn from 1.4603-1.4657, but is not exactly showing much in the way of bullish strength at present. Nevertheless, despite the clear bearish tone this market has taken on in the New Year, higher timeframe action remains trading at a strong-looking weekly Quasimodo support level found at 1.4633. So we’re not giving up hope just yet!
Be that as it may, we have a sneaky suspicion price may take out our stop here and attack fresh bids at the H4 Quasimodo support sitting just below at 1.4587. This is something we never took into account at the time, and could potentially stop us out as a result. For now though, we’re going to let this trade play out and see what today’s sessions bring, as moving our stop is NOT something we do once the trade has been placed!
Levels to watch/live orders:
- Buys: 1.4658 [LIVE] (Stop loss: 1.4597).
- Sells: Flat (Stop loss: N/A).
AUD/USD:
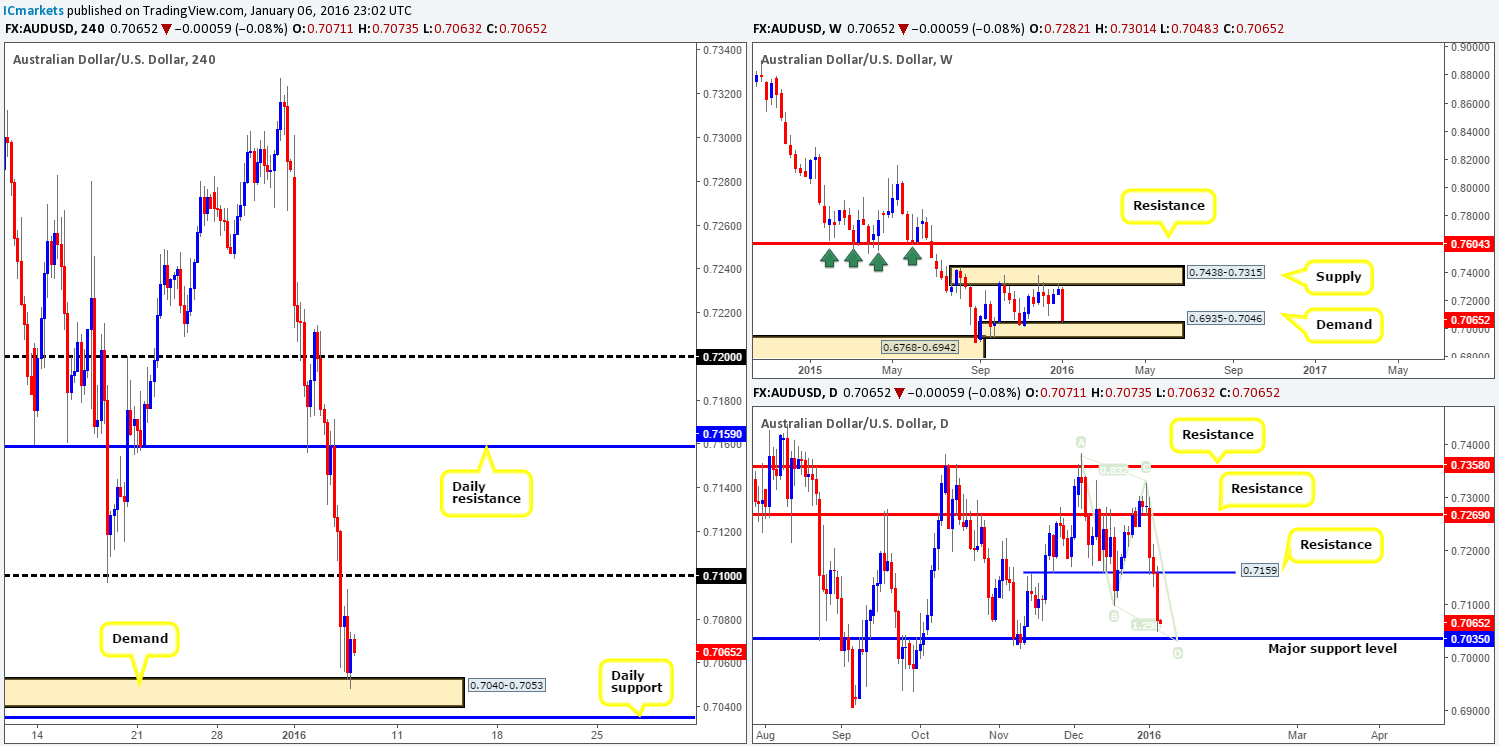
Kicking off our analysis this morning with a peek at the weekly chart shows the Aussie has recently drove into the jaws of demand fixed between 0.6935-0.7046. Could this be enough to stop this 2016 sell-off we’re seeing at the moment? Well, it could well be, as down in the pits of the daily timeframe price is trading within touching distance of a major support level coming in at 0.7035. In addition to it being a previously respected number in this market, it’s also joined together with an AB=CD bull pattern completion point which could heighten the odds of a bounce from here.
Looking to the H4 chart, nevertheless, we can see that price has now tested bids at H4 demand taken from 0.7040-0.7053. If it was not for the above said daily support level lurking just below here we would look to trade this demand. Risking money at this zone, however, with such a huge level looming below is not something we’d label high probability – a fakeout is highly likely.
Given the above, our focus today will be on the 0.7035 hurdle. Blindly trading this level (setting a pending buy order) might not be the best path to take (even though it’s bolstered by weekly demand at 0.6935-0.7046) due to the sheer velocity of selling being seen at present. That being the case, we have placed an alert at this daily barrier, once/if triggered, we’ll then being looking for lower timeframe buy entries into this market.
Levels to watch/live orders:
- Buys: 0.7035 region [Tentative – confirmation required] (Stop loss: Dependent on where one confirms this level).
- Sells: Flat (Stop loss: N/A).
USD/JPY:
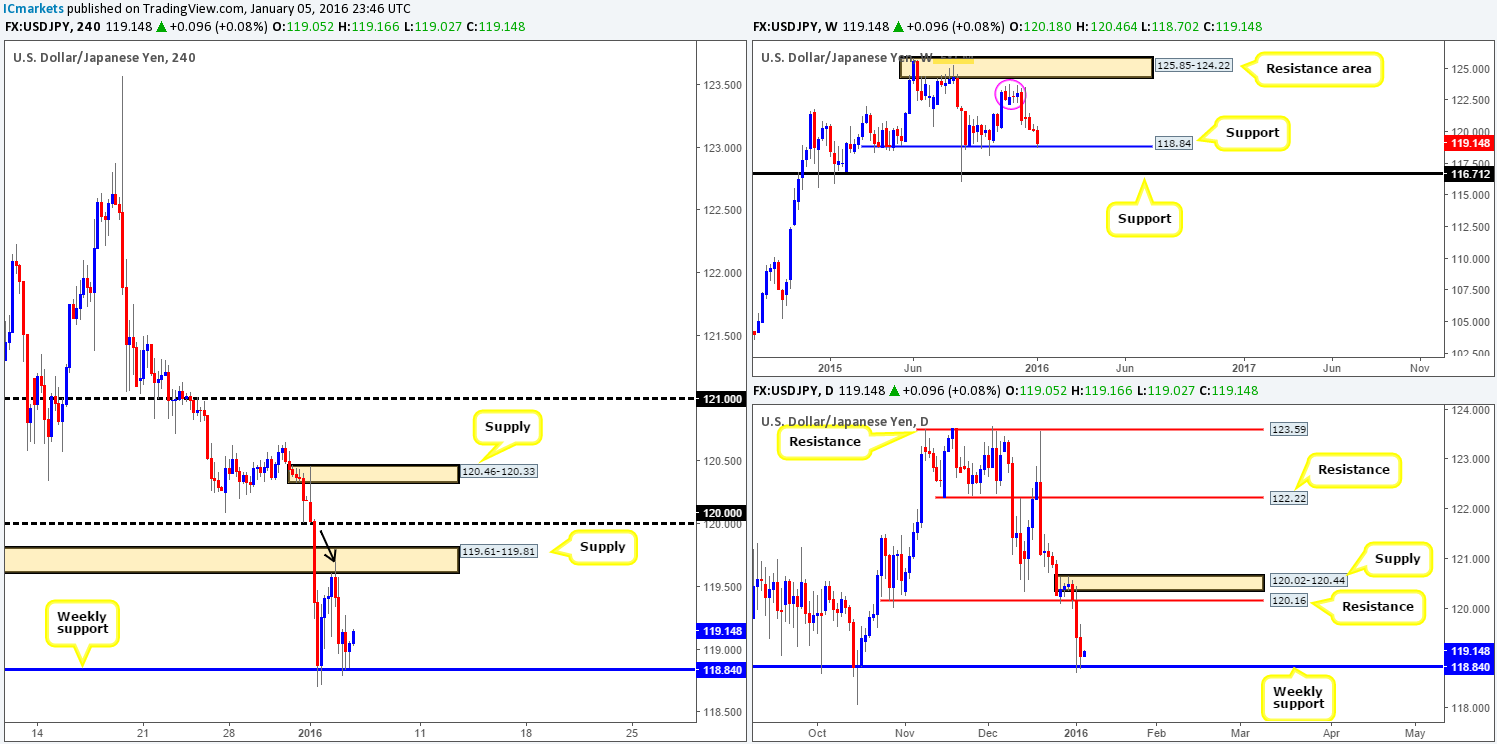
Yesterday’s 65-pip drop marks the fourth consecutive decline for this pair. Clearly investors are fleeing to safety right now. The big question for us though is how long can the sellers sustain this momentum?!?!
The most recent bearish assault, as you can see, has driven price below weekly support (now considered resistance on the daily and H4 charts) found at 118.84. This, as a result, forced price to attack bids around H4 demand at 118.06-118.40, which merges nicely with daily support drawn from 118.32. Given the H4 response to this demand, however, there appears to be uncertainty at this area. What is more, technical traders are likely concerned by the recently broken weekly level lurking just above (118.84) as a potentially dangerous resistance, and so are we! In view of this, opting to stand on the sidelines here may very well be the best path to take today, at least until we see a decisive break.
Levels to watch/live orders:
- Buys: Flat (Stop loss: N/A).
- Sells: Flat (Stop loss: N/A).
USD/CAD:
Coming at you directly from the weekly timeframe this morning, we can see the bulls continue to push this pair higher into major supply at 1.4190-1.3794. With the predominant trend strongly pointing north and sellers clearly struggling to find footing here, it’s not a very appealing sell zone for us at present! Down on the daily timeframe, supply (now demand) at 1.4001-1.3904 was aggressively taken out yesterday, resulting in offers being triggered at resistance located just above it at 1.4103.
Turning our attention to the H4 chart, there was an absolutely perfect buy signal to take advantage of. The red arrow marks the wick that took out stops from above both the large psychological resistance 1.4000 and also above daily supply at 1.4001-1.3904. What followed was a bull candle (marked with a black arrow) that stabbed lower to support at 1.3977 to collect unfilled buy orders, which forced price to close positively above 1.4000 for a buy up to 1.4100. Unfortunately, we never took advantage of this move as we were (and still are) long Cable.
In that price is now trading from resistive structures on each timeframe we follow, we could see a pullback in this bullish trend. With that, we may consider shorting from 1.4100 today should lower timeframe action deem it viable. On the flip side, we’re going to be keeping an eye out for confirmed buys around 1.4000 (if price reaches this low), and also for a possible break above and confirmed retest of 1.4100.
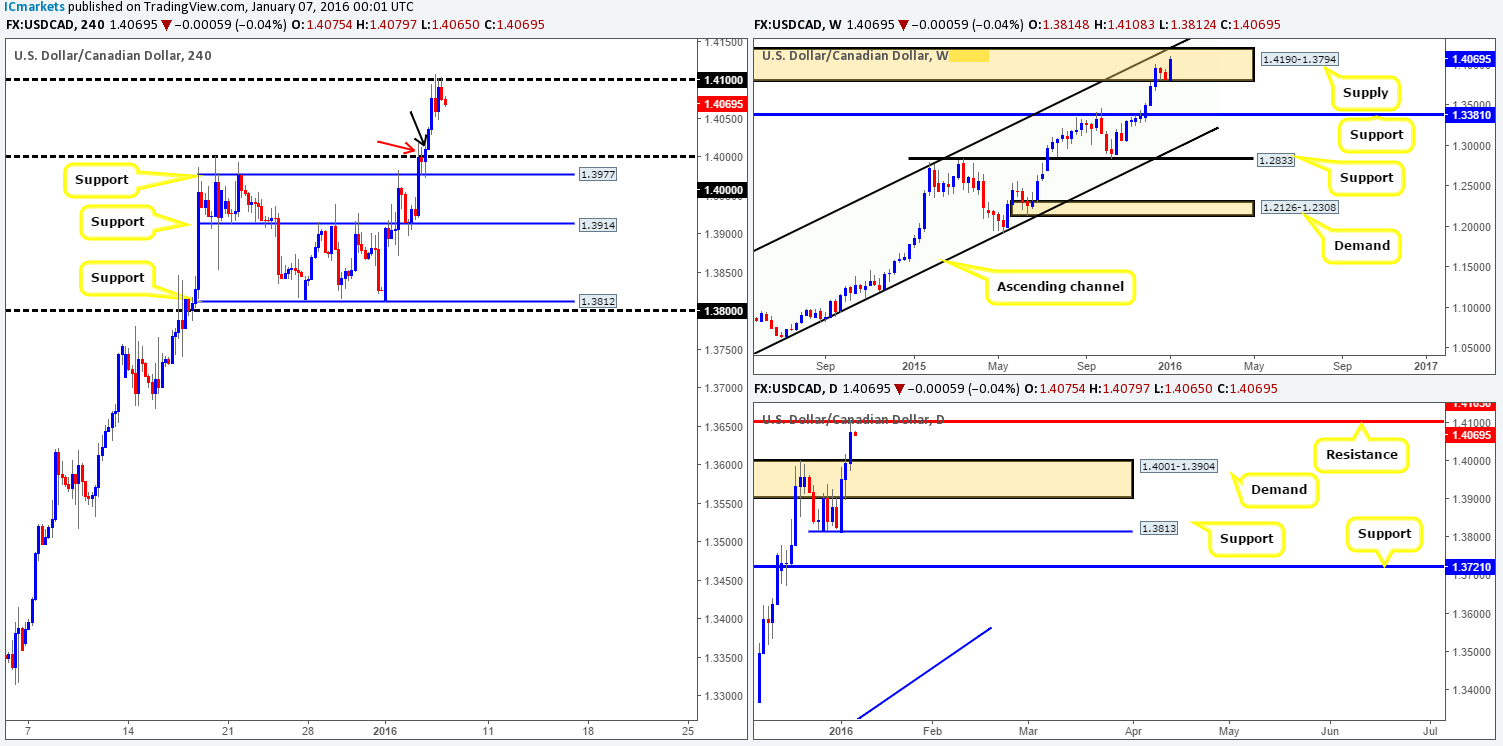
Levels to watch/live orders:
- Buys: Watch for offers to be consumed around 1.4100 and then look to trade any retest of this level thereafter (lower timeframe confirmation preferred). 1.4000 [Tentative – confirmation required] (Stop loss: Dependent on where one confirms this level).
- Sells: 1.4100 [Tentative – confirmation required] (Stop loss: Dependent on where one confirms this level).
USD/CHF:
H4 resistance at 1.0123 – coupled with the 61.8% Fibonacci level at 1.0122 and psychological resistance 1.0100 was clearly enough to hold this unit lower yesterday, forcing price to shake hands with bids around a minor H4 support at 1.0062. Well done to anyone who managed to short from here as this was a noted area in our previous report.
Due to the weekly action showing price selling off from just below a recently faked supply at 1.0239-1.0131, and room for daily movement to retrace following the break of supply (now demand) at 0.9989-1.0043, we personally do not see 1.0062 holding today.
As such, a break below this number and confirmed retest would be something we’d consider shorting down to parity. Why parity and not the H4 demand circled in pink at 1.0007-1.0025? This demand has ‘fakeout’ written all over it due to it being located just above such a large number. As a result, 1.0000 could be a nice place to look for a confirmed bounce to take place, as it’s located within daily demand mentioned above at 0.9989-1.0043.
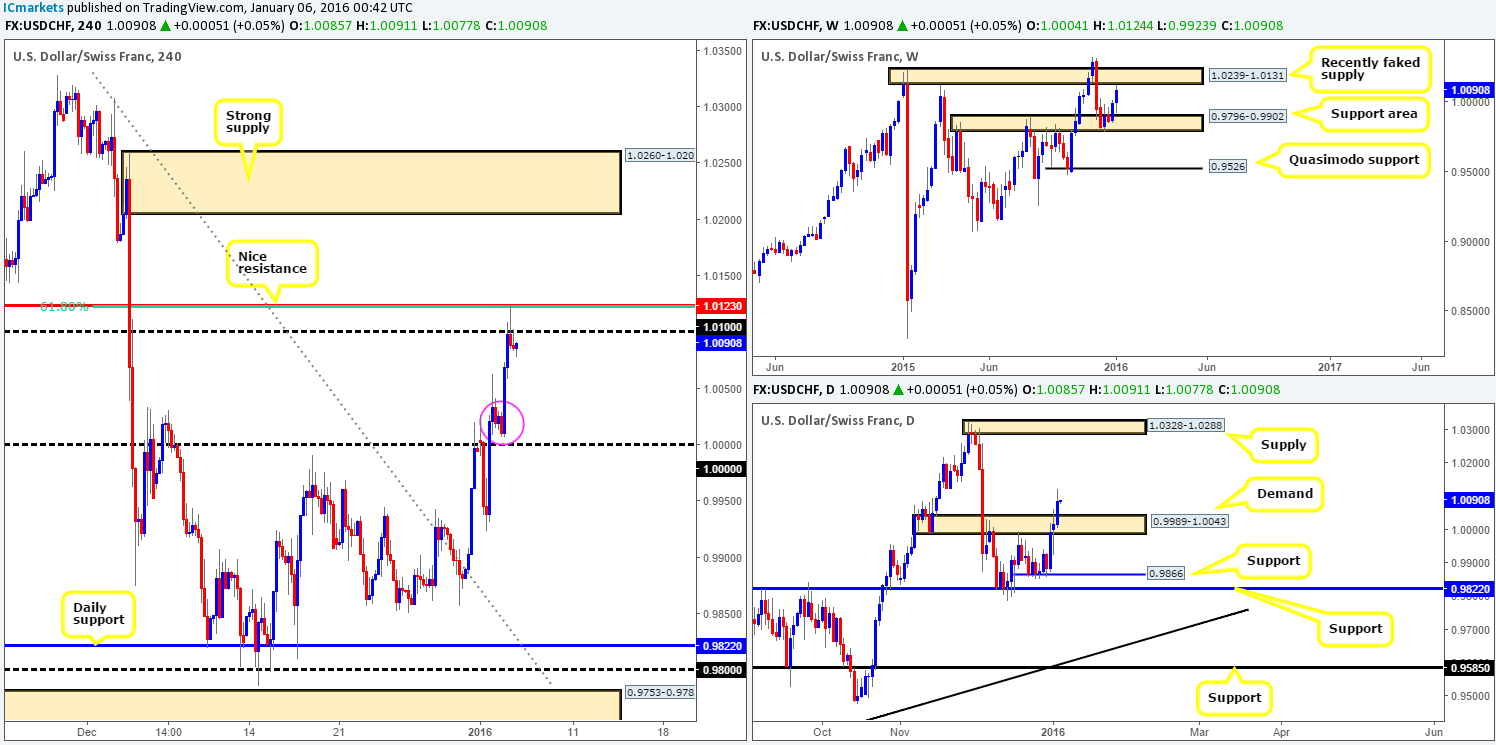
Levels to watch/live orders:
- Buys: 1.1000 [Tentative – confirmation required] (Stop loss: dependent on where one confirms this level).
- Sells: Watch for bids to be consumed around 1.0062 and then look to trade any retest of this level thereafter (lower timeframe confirmation preferred).
DOW 30:
The DOW index, once again, was painted in red yesterday, suffering a further 200 + point decline. Pressured by a combination of fundamental factors, weekly support (now resistance) at 17135 was taken out, bringing minor weekly support drawn from 16935 into play. Scrolling down to the daily chart, we can see that the most recent slump in stocks has seen price spike below demand at 16889-17056, and potentially opened the gates to support at 16708.
Yesterday’s H4 action surpassed demand at 16889-16976, and tested active bids at a demand just below taken from 16776-16840. This, as you can see, has since pushed this index back up into the recently broken demand which should theoretically act as supply now.
With a weekly support at 16935 now in play and demand on the daily chart at 16889-17056 holding firm despite its recent breach, our team is going to be looking for the bulls to come into the market today. For us to be permitted to long, however, a break above supply at 16889-16976 would need to be seen WITHOUT hitting supply above at 17190-17085 (our target). Following this, we’d need to see price retrace back to origin (demand at 16776-16840) to enter long at market (as per the red arrows). It will be interesting to see how this plays out.
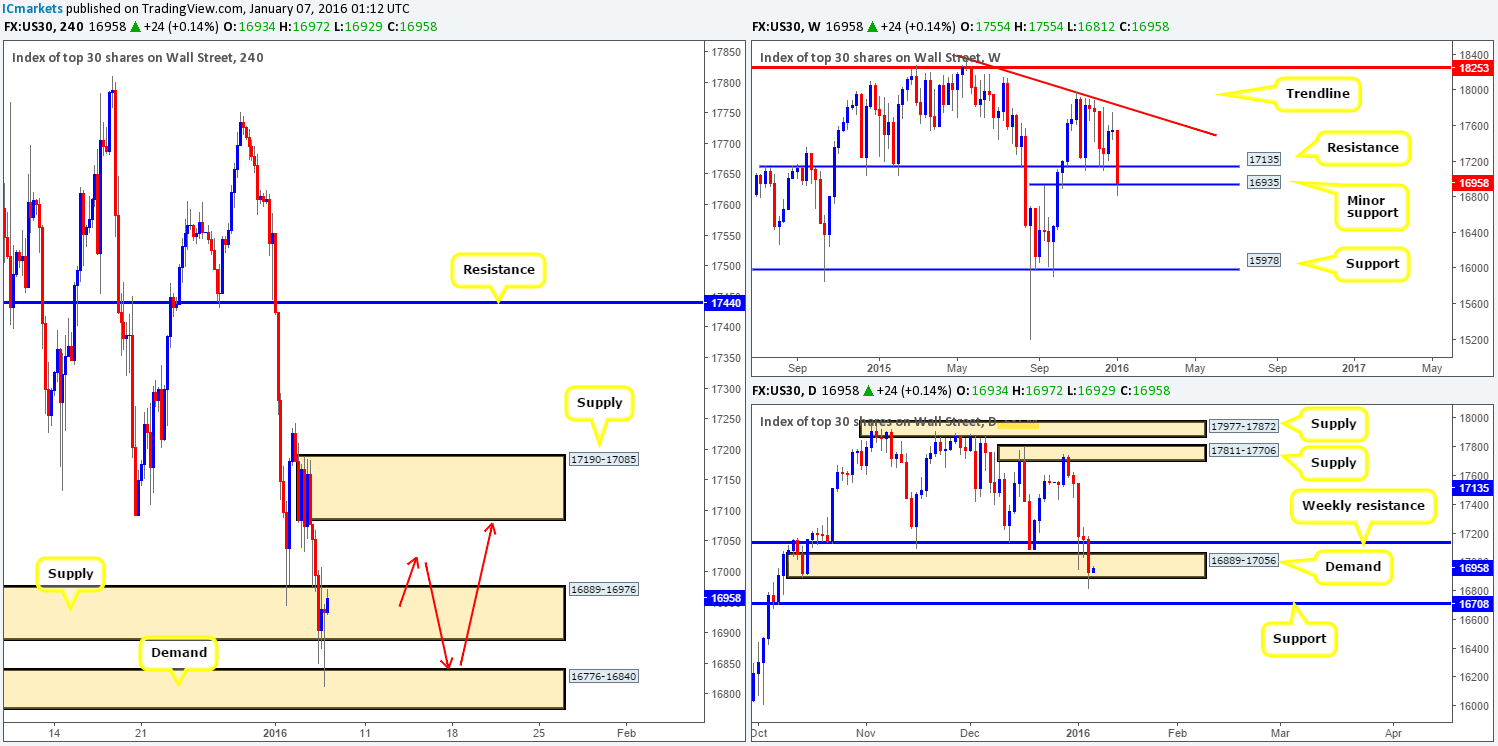
Levels to watch/live orders:
- Buys: Potential buys around demand at 16776-16840 if supply at 16889-16976 is consumed beforehand.
- Sells: Flat (Stop loss: N/A).
XAU/USD: (Gold)
During the course of yesterday’s sessions, Gold was well-bid as investors flee to safety. This third daily consecutive gain, as you can see, took out daily resistance (now support) at 1084.5, and is now trading within shouting distance of both weekly and daily supplies (1098.6-1121.7/ 1098.6-1108.6). Alongside the higher timeframe structures, H4 action can be seen just missing the Quasimodo resistance at 1095.6, before settling for the day at 1092.7.
At this point, our team has absolutely no interest in joining the Gold rush just yet. Instead, we’re going to be looking for confirmed shorts around the above said H4 Quasimodo level. Based on our analysis, we’re not expecting a to-the-pip touch at this H4 level, since a fakeout higher could be seen to tag in offers at the higher timeframe supplies mentioned above, hence the need for lower timeframe confirmation!
In the event that price drives too high above the H4 Quasimodo, all eyes will then be on the H4 supply coming in at 1110.3-1108.0. This zone is located not only at the very extreme of daily supply, but also deep within weekly supply as well (see above for levels), thus making this one heck of a sell zone to have noted on your watch lists.
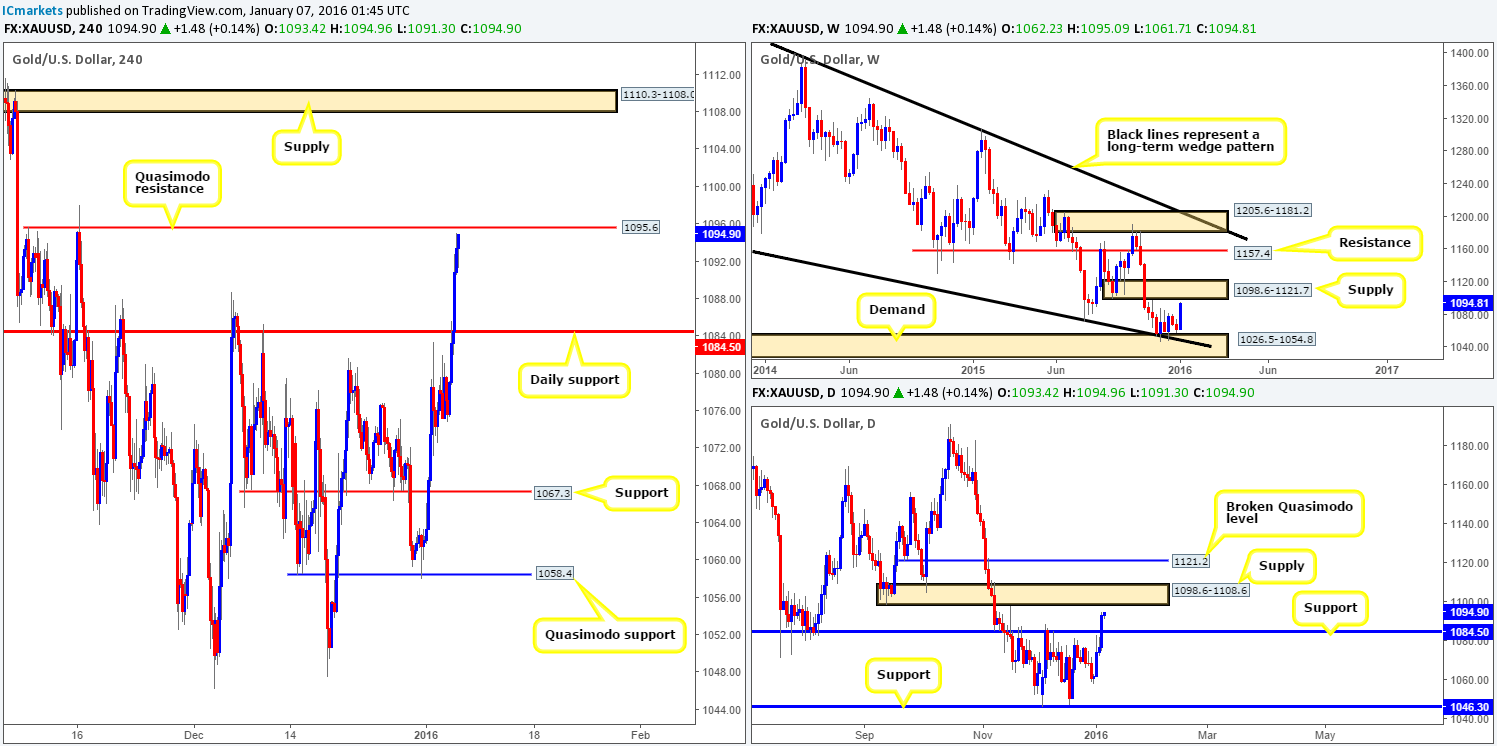
Levels to watch/live orders:
- Buys: Flat (Stop loss: N/A).
- Sells: 1095.6 [Tentative – confirmation required] (Stop loss: dependent on where one confirms this level). 1110.3-1108.0 [Possible short here at market] (Stop loss: 1112.0).