A note on lower timeframe confirming price action…
Waiting for lower timeframe confirmation is our main tool to confirm strength within higher timeframe zones, and has really been the key to our trading success. It takes a little time to understand the subtle nuances, however, as each trade is never the same, but once you master the rhythm so to speak, you will be saved from countless unnecessary losing trades. The following is a list of what we look for:
- A break/retest of supply or demand dependent on which way you’re trading.
- A trendline break/retest.
- Buying/selling tails/wicks – essentially we look for a cluster of very obvious spikes off of lower timeframe support and resistance levels within the higher timeframe zone.
- Candlestick patterns. We tend to only stick with pin bars and engulfing bars as these have proven to be the most effective.
We search for lower timeframe confirmation between the M15 and H1 timeframes, since most of our higher-timeframe areas begin with the H4. Stops are usually placed 5-10 pips beyond confirming structures.
EUR/USD:
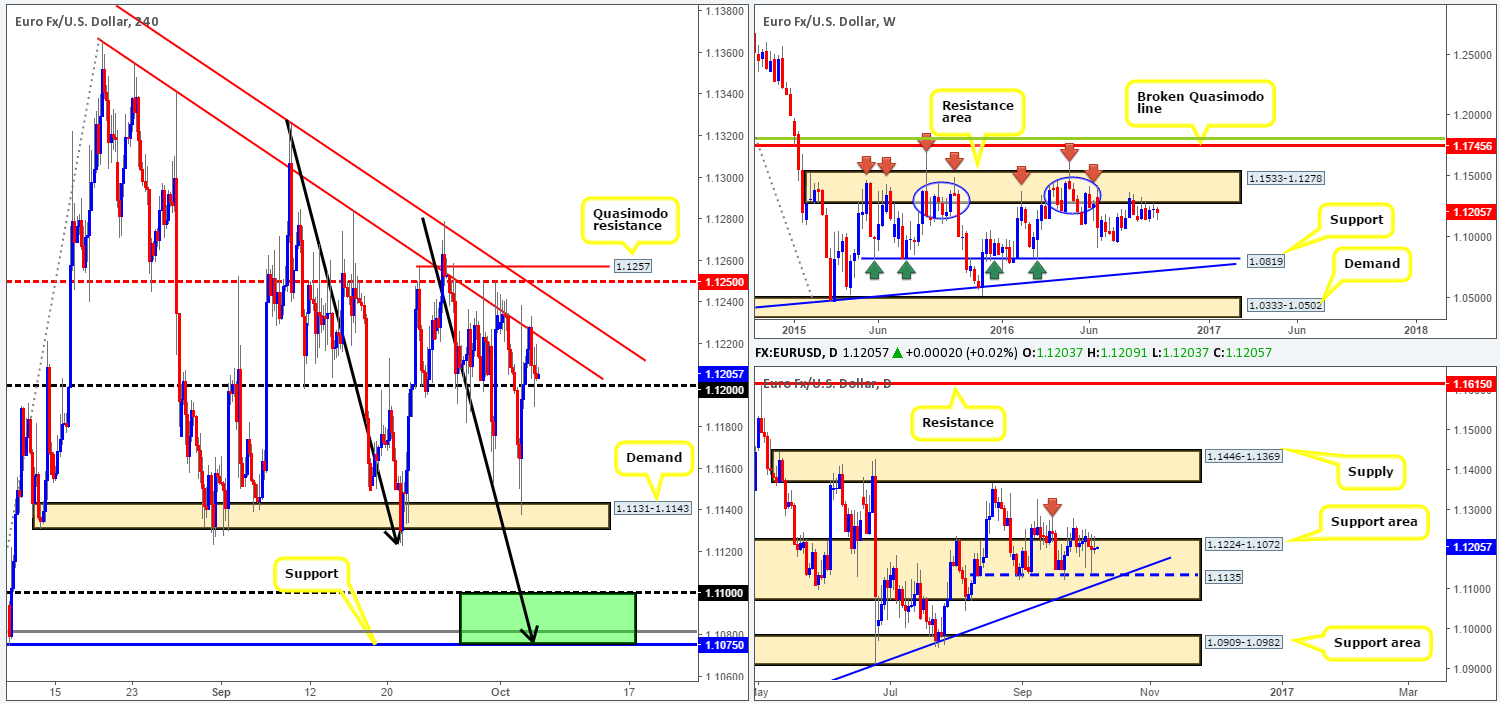
For the most part, it was a relatively quiet day in the EUR/USD market yesterday. After yet another rebound seen from the underside of the H4 trendline resistance extended from the high 1.1366, the pair briefly slipped below the 1.12 handle on the back of better than expected US ISM non-manufacturing PMI data.
Despite the 1.12 support currently in play and the fact that price has been loitering within a daily support area at 1.1224-1.1072 since Aug 30, our team is wary of buying this market. This is simply due to the weekly timeframe showing price trading around a major resistance area seen at 1.1533-1.1278, which has held this market lower since May 2015! However, as we mentioned in previous reports, a decisive break above the September 15th daily high at 1.1284 (red arrow) could portend further buying up to at least the daily supply barrier coming in at 1.1446-1.1369.
Our suggestions: For now guys, our outlook remains pretty much the same as in yesterday’s analysis. As price remains bid above 1.12, we once again find ourselves honing in on the H4 Quasimodo resistance level drawn from 1.1257. Not only does this level boast a converging H4 trendline resistance (1.1327) and H4 mid-way resistance at 1.1250, but the apex of this Quasimodo formation (1.1279) is bolstered by the underside of the aforementioned weekly resistance area! As such, a pending sell order has been placed at 1.1256, along with a stop set at 1.1281.
Of course, a decisive push below 1.12 today could also be considered a bearish cue. Nevertheless, this is risky in our book as you not only run the risk of selling into daily buyers, but there’s also the possibility that weekly price may tag the underside of the resistance area once more. Therefore, this setup would be a pass for us.
On the data front, we have the US Jobless claims scheduled for release at 12.30pm GMT today.
Levels to watch/live orders:
- Buys: Flat (Stop loss: N/A).
- Sells: 1.1256 [pending order] (Stop loss: 1.1281).
GBP/USD:
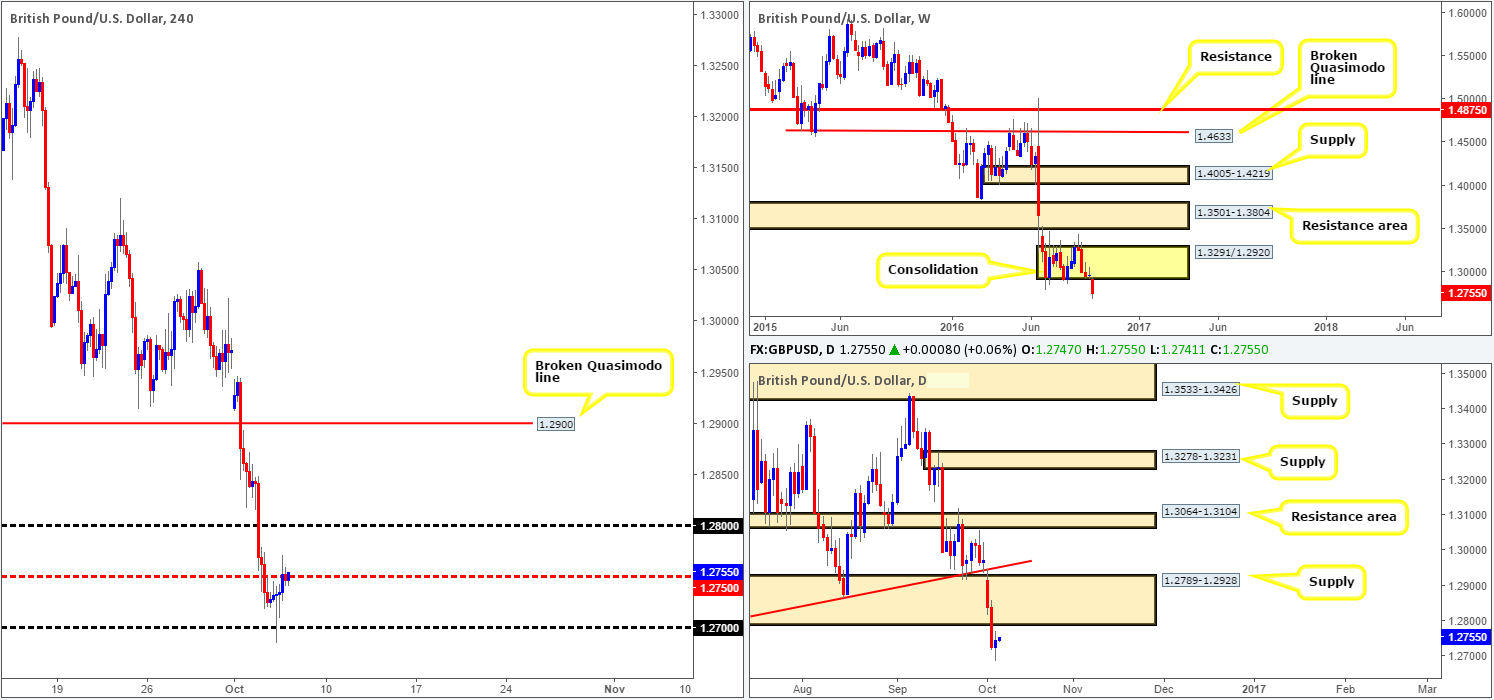
Following two solid days of selling, the pound found some relief around the 1.27 handle early on in yesterday’s European session. This move was further boosted by a stronger than expected UK services PMI print, which came in at 52.6 vs. 52.1.
As we write, the pair is seen clinging to the underside of the H4 mid-way resistance at 1.2750. As we highlighted in Wednesday’s report, this level is not somewhere our team would consider selling, despite the pronounced downtrend the GBP is in at the moment. The reason being is simply because the 1.28 handle sitting directly above is, at least in our view, the more attractive number to short from. This is due to it fusing with the underside of the recently broken daily demand-turned supply at 1.2789. In order for us to receive a green light to short 1.28, however, our team would, at the very least, require a reasonably sized H4 bear candle to form off this number, since fakeouts through psychological levels are common.
There is little GBP news on the docket today, but do keep in mind that we have the US Jobless claims scheduled for release at 12.30pm GMT.
Levels to watch/live orders:
- Buys: Flat (Stop loss: N/A).
- Sells: 1.28 region [At least a H4 bearish close is required here before pulling the trigger] (Stop loss: beyond the trigger candle).
AUD/USD:
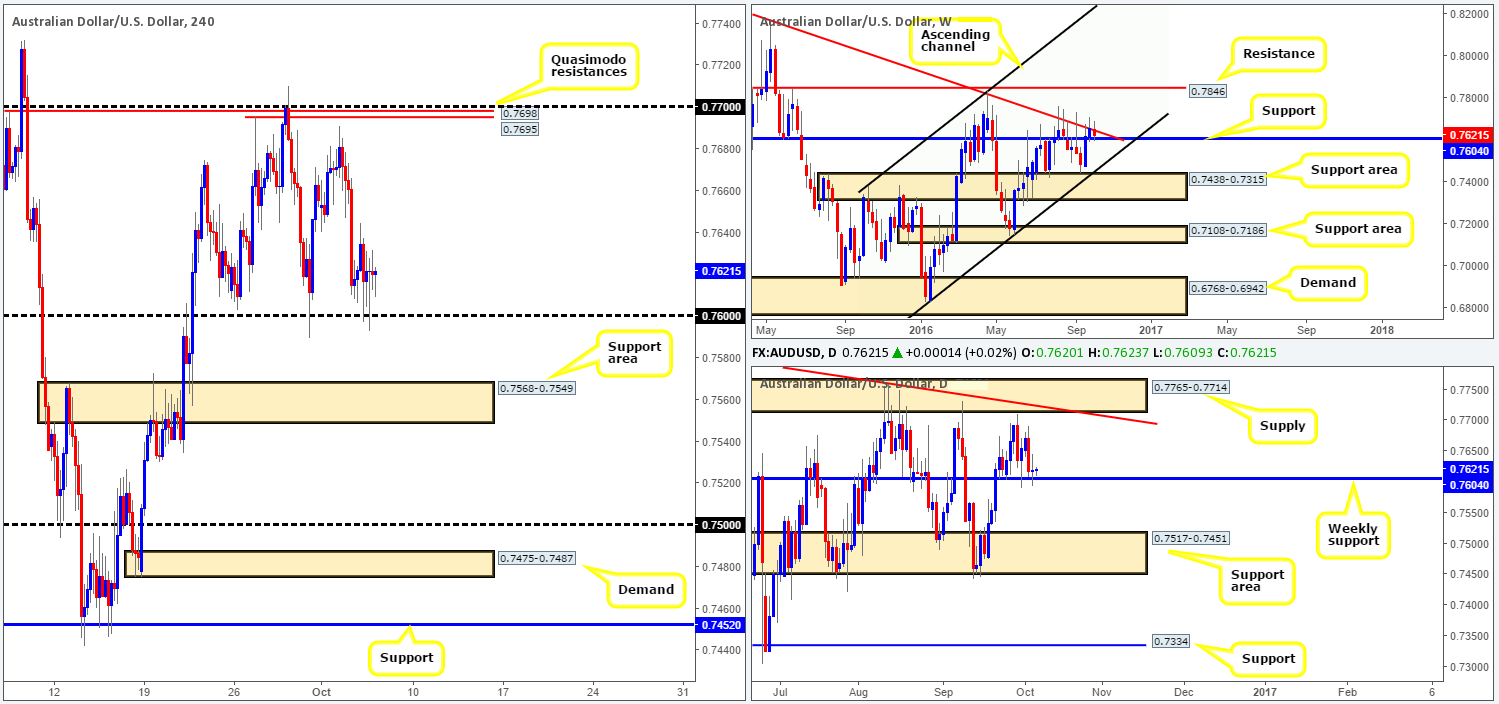
Try as it might, the commodity currency was unable to muster enough strength to break through the 0.76 handle yesterday, despite selling off from a weekly trendline resistance extended from the high 0.8295. This is where it gets interesting. Not only is 0.76 considered a psychological number and is watched by the majority of the market, it’s also positioned 4 pips below a weekly support level penciled in at 0.7604. A break below this weekly line could see a renewal of bearish sentiment down to a daily support area at 0.7517-0.7451. Looking at this from a H4 perspective, nonetheless, shows that close beyond 0.76 only clears the runway down to the support area seen at 0.7568-0.7549. This, of course, leaves little more than 30 pips of room to play with between this area and 0.76. It also may be worth noting that this support area was used to propel the commodity currency beyond the weekly resistance 0.7604 back on the 21st September. Therefore, this base has a fairly good chance of holding price.
Our suggestions: Similar to yesterday’s analysis, should the H4 candles close beyond 0.76 and retest the underside of this level and hold (without striking the top edge of the current H4 support area), we may look to short this market on the basis that we’re able pin down a lower timeframe sell setup that allows a small stop loss (see the top of this report for lower timeframe entry techniques). The first take-profit target would be the aforementioned H4 support area. Beyond here though, we have our eye on the 0.75 handle as our final take-profit zone given that it is lodged within the above said daily support area.
Event risks for the above setup, nevertheless, include the AUD Trade balance due in the next 30 minutes, and, of course, the US Jobless claims scheduled for release at 12.30pm GMT.
Levels to watch/live orders:
- Buys: Flat (Stop loss: N/A).
- Sells: Watch for a close below 0.76 and then look to trade any retest seen thereafter (lower timeframe confirmation required).
USD/JPY:
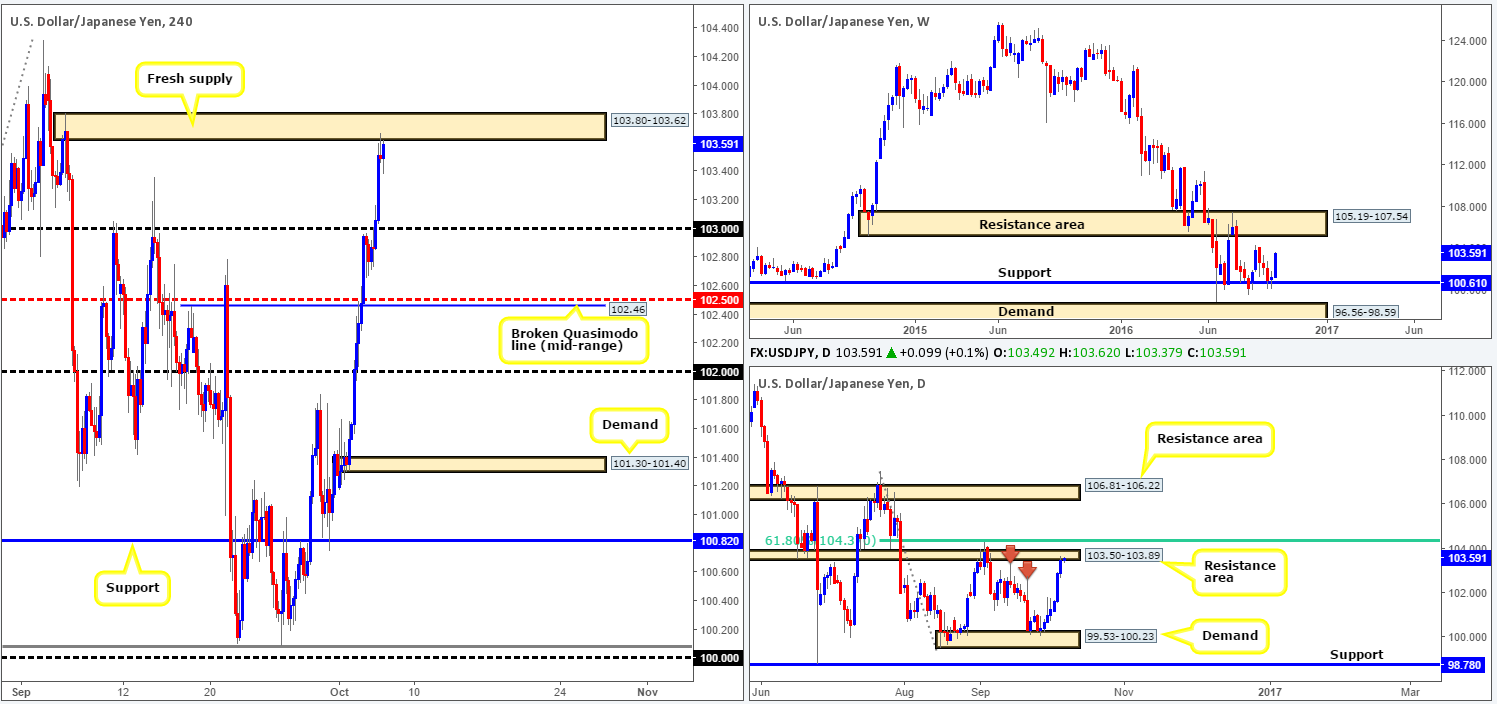
In recent sessions, we can see that the USD/JPY couple closed above the 103 handle during the early hours of London trading. A few hours later, going into US trading, the break above 103 was further bolstered by hotter than expected US ISM non-manufacturing PMI data, consequently pushing the pair up to a fresh H4 supply zone coming in at 103.80-103.62.
With a H4 bearish selling wick recently printed off this zone, and the fact that this supply is smothered by a daily resistance area drawn from 103.50-103.89, this is an interesting barrier for shorts. Our only concern is, of course, the weekly chart, which, other than the 29/08 high 104.32, there’s little stopping prices from pushing north and challenging the resistance area at 105.19-107.54. On top of this, there is also a chance that price may fake though this area to cross swords with the 104 boundary.
Our suggestions: Despite the drawbacks, we feel a short from the current H4 supply is worth the risk. As such, our team entered short at 103.58, with our stop loss placed above the daily resistance area at 103.92, targeting 103 as our immediate take-profit zone. For anyone who’s taken this trade alongside us, remain aware that we have the US Jobless claims scheduled for release at 12.30pm GMT later on today.
Levels to watch/live orders:
- Buys: Flat (Stop loss: N/A).
- Sells: 103.58 [live] (Stop loss: 103.92).
USD/CAD:
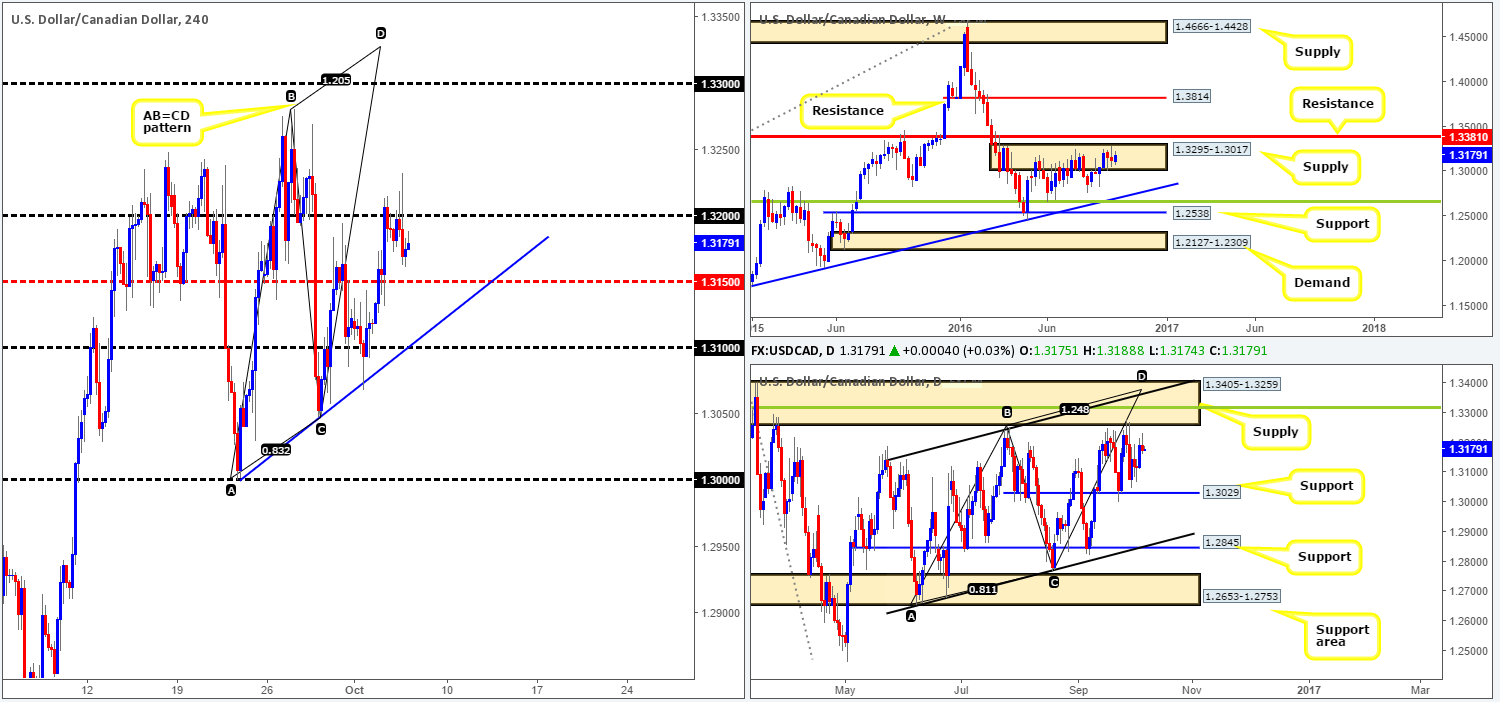
Yesterday’s stronger than expected US ISM non-manufacturing PMI reading aggressively pushed price beyond the 1.32 handle. However, as you can see, the bears managed to recover relatively quickly from here as weekly crude data hit the wire 30 minutes later! This forced the USD/CAD pair back below 1.32 and down to lows of 1.3161 on the day.
Looking over to the weekly chart, we can see the bears continue to be seen struggling to make headway within supply coming in at 1.3295-1.3017. A break above this area would almost immediately land the pair within striking distance of resistance seen at 1.3381. Conversely, a downside move from the current supply area could force price to connect with trendline support extended from the high 1.1278. Moving down to the daily chart, the pair remains capped between a support level coming in at 1.3029 and a supply zone drawn from 1.3405-1.3259. Within this zone, and this is something we have mentioned several times in past reports, there is also a daily convergence point seen located within this barrier: a 38.2% Fib resistance level at 1.3315 (green line), the weekly resistance level at 1.3381, a channel resistance taken from the high 1.3241 and an AB=CD completion point around the 1.3376ish range.
Our suggestions: Ideally, we’re looking for price to break above 1.32 today and trade higher. Just to be clear, we’re not looking to buy above this region due to the weekly supply currently in play. We know it could be a long way off, but our team remains focused on shorting around 1.3315ish region. Not only does this area boast a truckload of daily confluence (see above) and a H4 AB=CD bearish completion point (1.3328), it also allows one to place their stops above the current daily supply! With that in mind, our team has set a pending sell order at 1.3315, with a stop positioned above at 1.3407.
Data points to consider today are CAD Building permits and the US Jobless claims both scheduled for release at 12.30pm GMT.
Levels to watch/live orders
- Buys: Flat (Stop loss: N/A).
- Sells: 1.3315 [pending order] (Stop loss: 1.3407).
USD/CHF:
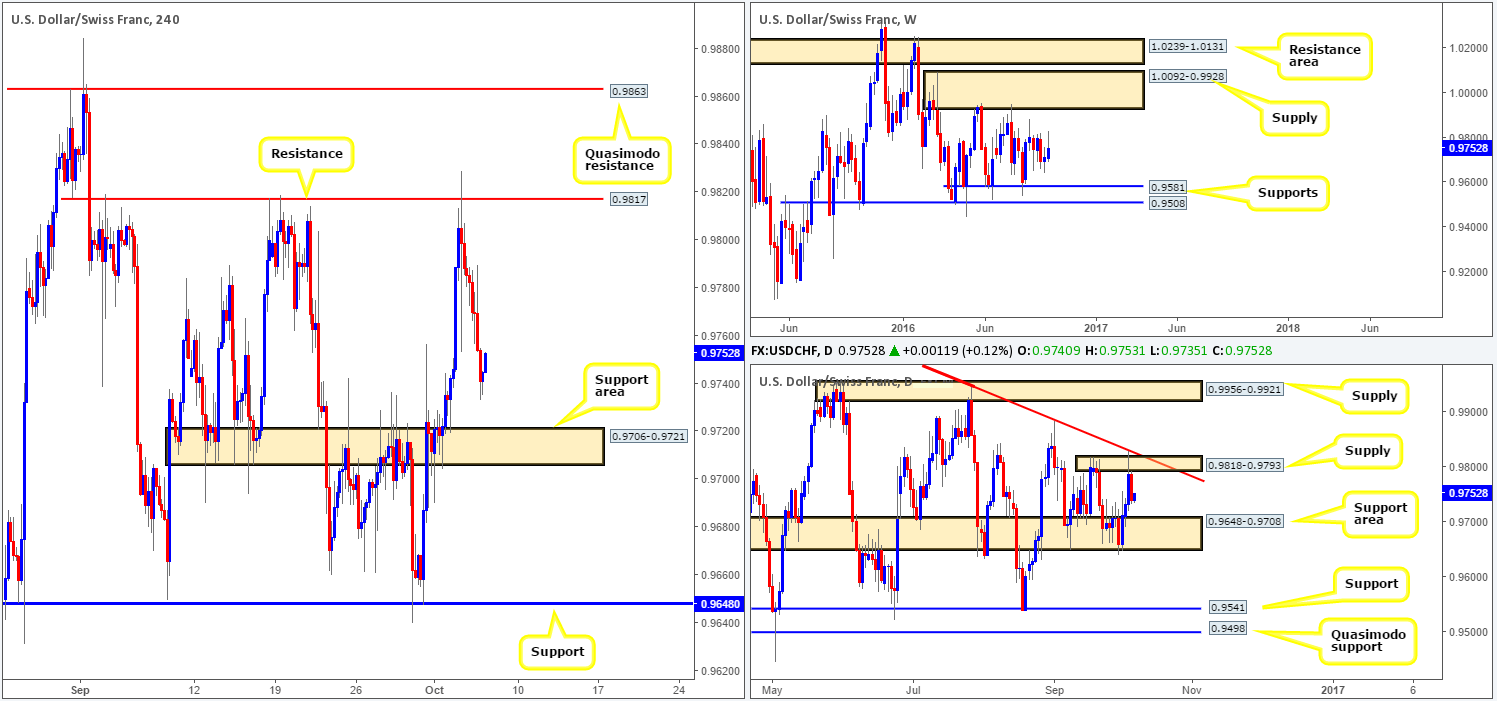
As anticipated, the USD/CHF pair continued to decline in value yesterday, following its rebound from the underside of a H4 resistance at 0.9817. Although price bottomed out around 0.9733, there’s room seen for price to continue lower today down to the H4 support area at 0.9706-0.9721, which happens to represent the top edge of a daily support area seen at 0.9648-0.9708 (the next downside target on the daily timeframe).
With the above points in mind, and little directional bias being seen from the weekly chart right now, our attention will mostly be driven toward looking for lower timeframe buy entries (see the top of this report for ideas on trading lower timeframe confirmation) from the aforementioned H4 support boundary – if prices reach this low of course. Apart from remaining vigilant around 12.30pm GMT today due to US Jobless claims data, we do not see much else to hang our hat on at the moment.
Levels to watch/live orders:
- Buys: 0.9706-0.9721 [lower timeframe confirmation required] (Stop loss: dependent on where one confirms this area).
- Sells: Flat (Stop loss: N/A).
DOW 30:
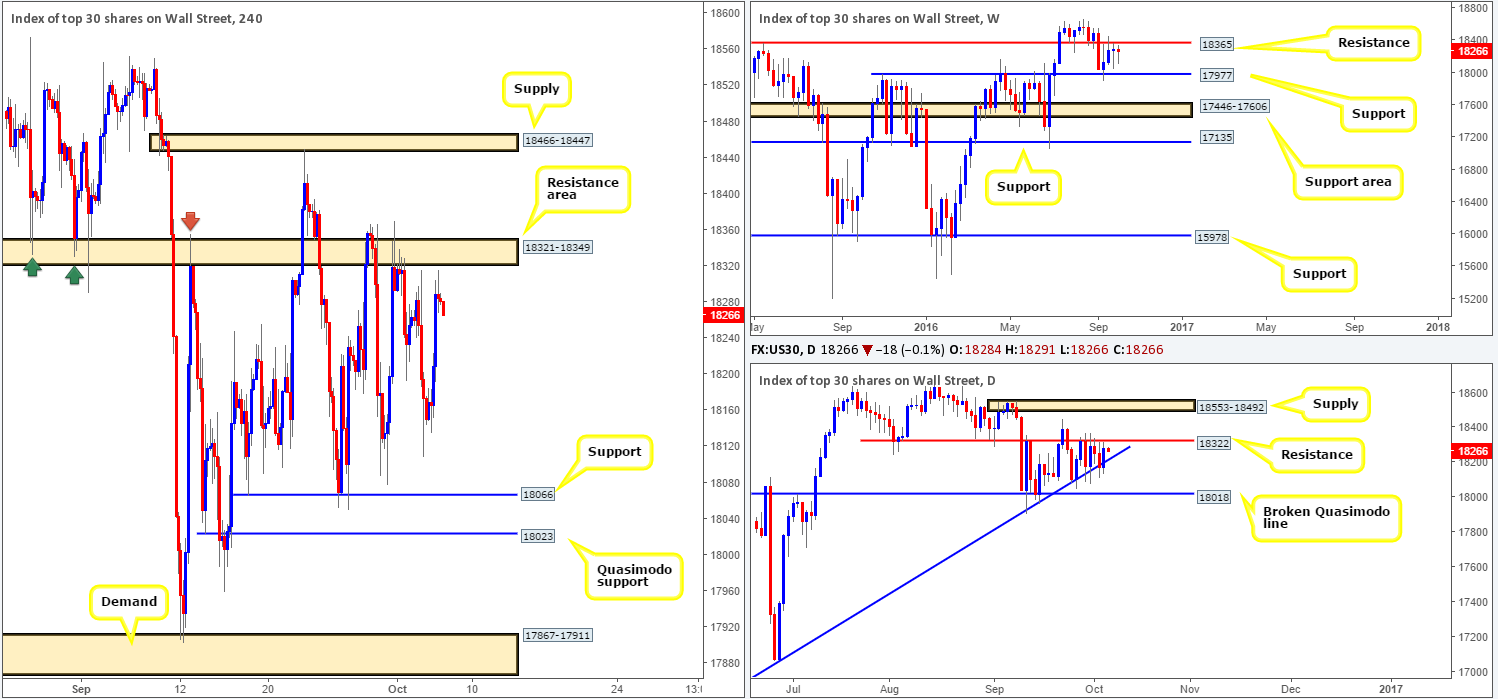
As can be seen from the H4 chart, trading action is currently capped between a resistance area coming in at 18321-18349 (located just below the weekly resistance level at 18365 and also encapsulates the daily resistance level seen at 18322) and a support band drawn from 18066.
In that price is now trading nearby a considerable H4 sell zone would we deem this a stable enough barrier to short from today? Yes. The reason, of course, is due to its connection with the above said higher-timeframe resistances. For those who agree and are looking to trade this zone, we suggest placing stops above the weekly resistance just to be on the safe side. In addition to this, we would also look to take partial profits and reduce risk to breakeven at the daily trendline support taken from the low 15501.
Buying from the current H4 support, nonetheless, is not something our team would be comfortable with. The reason? The next downside target, beyond the current daily trendline, is seen at 18018: a broken daily Quasimodo line, which sits only a few points below a H4 Quasimodo support penciled in at 18023. Further supporting this H4 Quasimodo, the head of this formation connects beautifully with the weekly support barrier at 17977 (the next downside target on the weekly scale).
Our suggestions: In light of the above points, our team will be watching for a reasonably sized H4 bear candle to form from the H4 resistance area at 18321-18349 to sell. On top of this, we will ignore the current H4 support and look to buy from the above said H4 Quasimodo support today. A pending buy order has been set at 18024 with a stop placed at 17955. The first take-profit target is likely to be the underside of the current support at 18066.
Levels to watch/live orders:
- Buys: 18024 [pending order] (Stop loss: 17955).
- Sells: 18321-18349 [H4 bearish close is required here before pulling the trigger] (Stop loss: beyond the trigger candle or above the weekly resistance level at 18365).
GOLD:
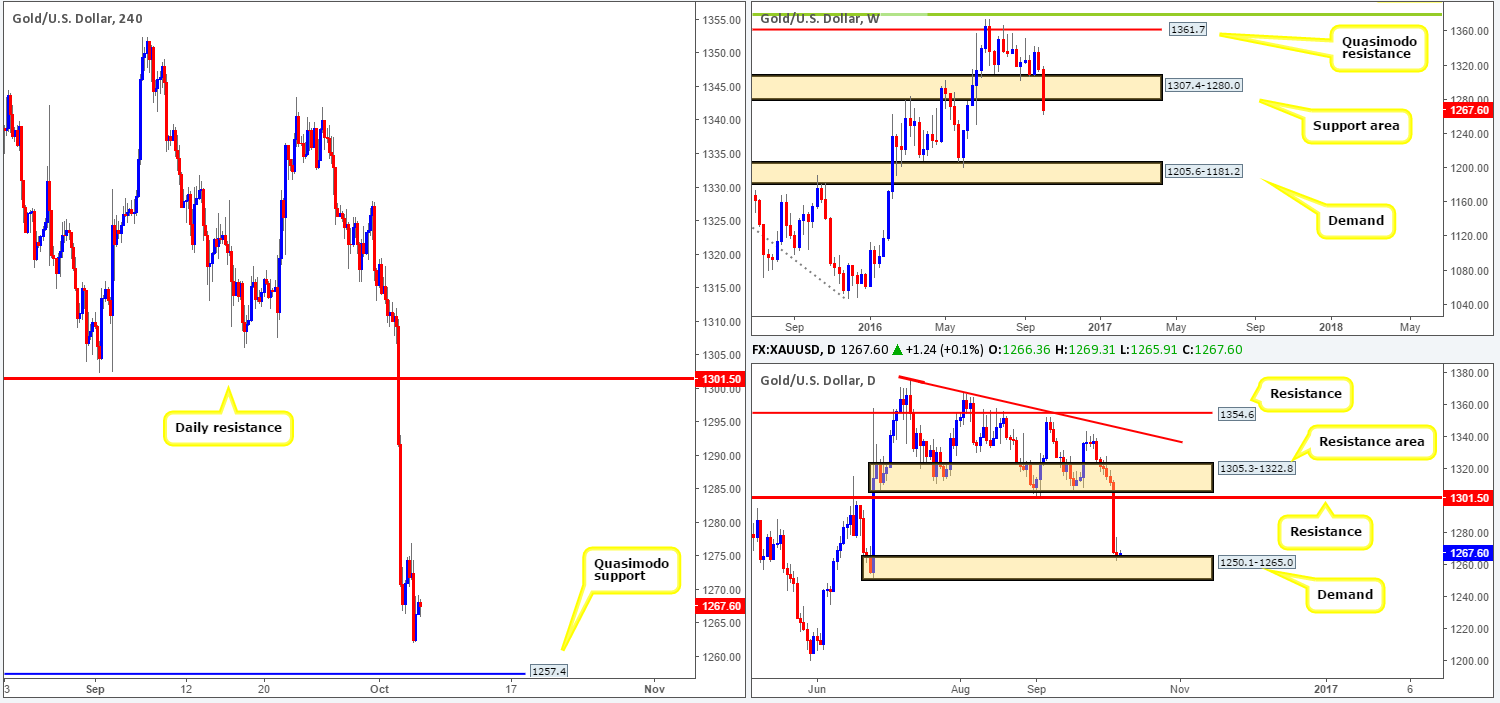
The gold market declined in value for the 7th consecutive day yesterday, consequently forcing the daily candles to unite with a demand base drawn from 1250.1-1265.0, and edge H4 price closer to the Quasimodo support level at 1257.4. Now, Tuesday’s selloff was quite something. It was enough to break through a weekly support area at 1307.4-1280.0, which by extension, could lead to further selling down to the weekly demand area at 1205.6-1181.2.
As we mentioned in yesterday’s report, our team would not look to become sellers in this market until a break below the aforementioned daily demand base has been seen. In regard to buying, however, we have our eye on the H4 Quasimodo support level at 1257.4, housed within the above said daily demand. Nevertheless, a buy from this H4 level is not without risk! The break below the weekly support area is concerning. Therefore, the best path, at least in our view, is to wait for a reasonably sized H4 bull candle to form off of 1257.4, before looking to enter long. Only once this is seen would we be comfortable buying here.
Levels to watch/live orders:
- Buys: 1257.4 region [H4 bullish close required] (Stop loss: beyond the trigger candle).
- Sells: Flat (Stop loss: N/A).


