A note on lower timeframe confirming price action…
Waiting for lower timeframe confirmation is our main tool to confirm strength within higher timeframe zones, andhas really been the key to our trading success. It takes a little time to understand the subtle nuances, however, as each trade is never the same, but once you master the rhythm so to speak, you will be saved from countless unnecessary losing trades. The following is a list of what we look for:
- A break/retest of supply or demand dependent on which way you’re trading.
- A trendline break/retest.
- Buying/selling tails – essentially we look for a cluster of very obvious spikes off of lower timeframe support and resistance levels within the higher timeframe zone.
- Candlestick patterns. We tend to only stick with pin bars and engulfing bars as these have proven to be the most effective.
EUR/USD:
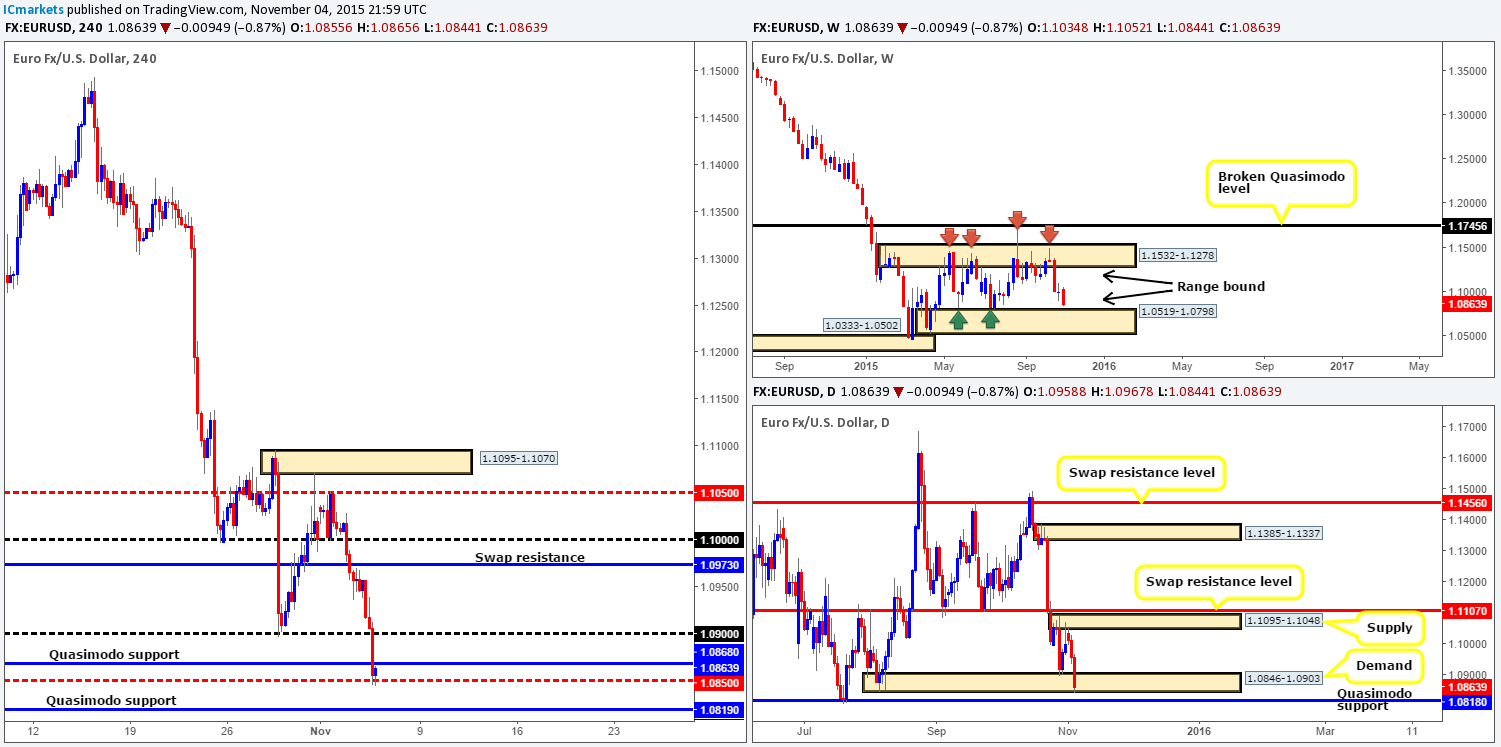
During the course of yesterday’s sessions, the EUR once again fell sharply against the U.S. dollar following a string of supportive U.S. data and comments from the FED chair Yellen. This, as you can see, took out both psychological support 1.0900 and Quasimodo support at 1.0868, before stabilizing around mid-level support drawn from 1.0850.
Despite the EUR’s present weakness, technically this pair is effectively in an oversold position. Here’s why:
- Weekly action shows price edging ever so close to range demand falling in at 1.0519-1.0798.
- Down on the daily timeframe, we can see that market action is already positioned deep within demand at 1.0846-1.0903. However, judging by how deep price has drove into this area and the fact that the weekly shows room to continue lower, we’re now watching the Quasimodo support below it at 1.0818.
- Similar to the daily timeframe, although 4hr price is currently showing support from 1.0850, we doubt this will hold. Sellers will likely continue to pummel this market lower down to a Quasimodo support seen on this timeframe coming in at 1.0819 – a pip’s difference to that of the daily chart!
Therefore, between the 4hr Quasimodo support at 1.0819, and the psychological support 1.0800 is where we intend to hunt for longs today.
Levels to watch/live orders:
- Buys: 1.0819/1.0800 [Tentative – confirmation required] (Stop loss: dependent on where one confirms this area).
- Sells:Flat (Stop loss: N/A).
GBP/USD:
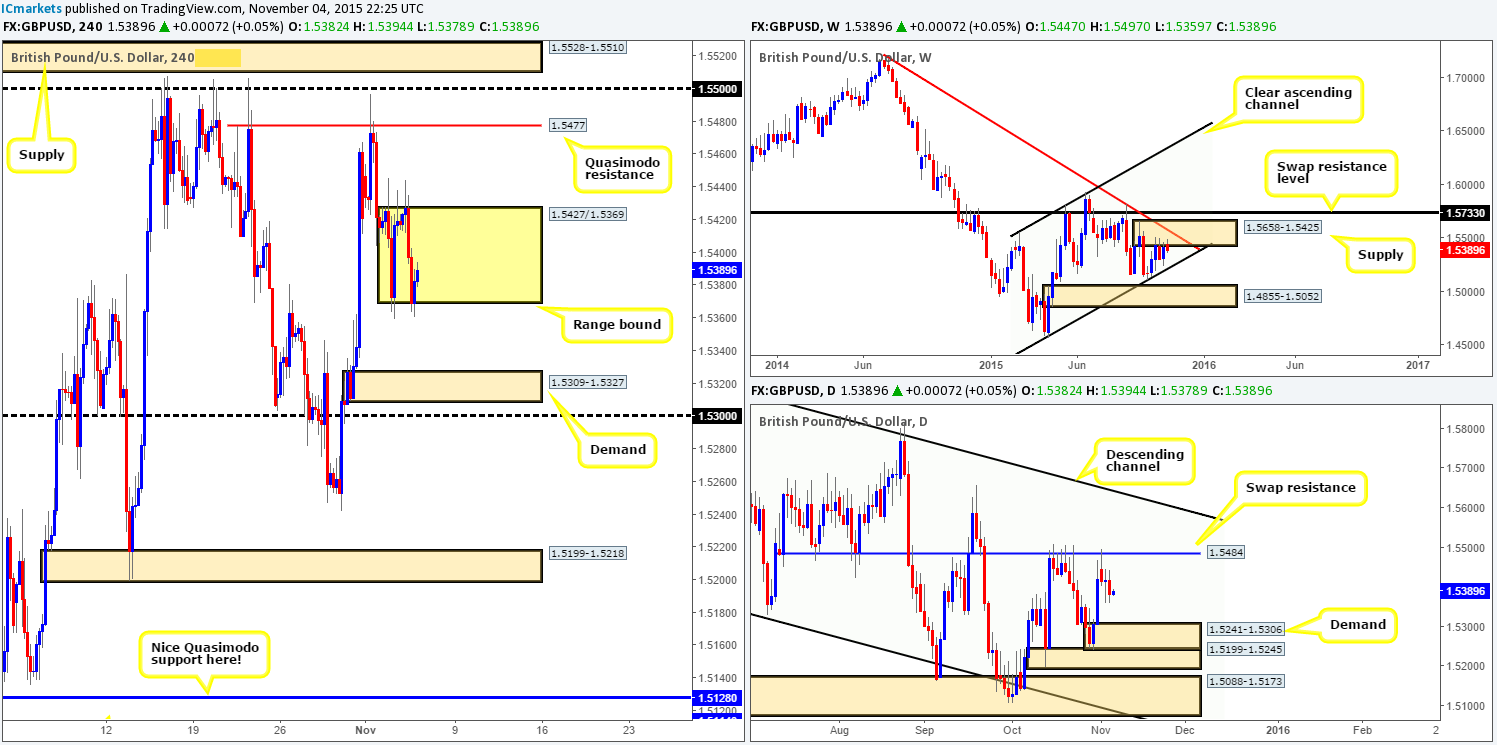
Based on recent price action, Cable, at least on the 4hr timeframe, appears to have entered into a phase of consolidation between 1.5427/1.5369. Due to the high-impacting data set to be released from the UK this lunch time, we may see this ranging action breached. Beyond the barriers of this range, we really like the Quasimodo resistance level sitting above visible at 1.5477, and the demand below it at 1.5309-1.5327, followed closely by psychological support 1.5300.
Given the above, here is what we have jotted down for today’s upcoming trade:
- A close below the range could provide a short trade, targeting the above said demand/round number. For us to trade this move, however, we’d need to see a successful retest to the underside of this consolidation along with lower timeframe selling action. By the same token, the target demand could also be somewhere to consider longs since it sits just above daily demand coming in at 1.5241-1.5306.
- A close above the range, nonetheless, could suggest further upside towards the aforementioned Quasimodo resistance level. Again, this could provide us with a trade long should price retest the broken range as support and show some form lower timeframe buying confirmation. A sell at the Quasimodo is high probability in our opinion due to this beauty being positioned not only close to a daily swap (resistance) level at 1.5484, but also located within weekly supply at 1.5658-1.5425.
Levels to watch/ live orders:
- Buys: Watch for offers to be consumed around 1.5427 and then look to trade any retest seen at this level (confirmation required) 1.5309-1.5327/1.5300 [Tentative – confirmation required] (Stop loss: dependent on where one confirms this area).
- Sells: Watch for bids to be consumed around 1.5369 and then look to trade any retest seen at this level (confirmation required) 1.5477 [Tentative – confirmation required] (Stop loss: dependent on where one confirms this level).
AUD/USD:
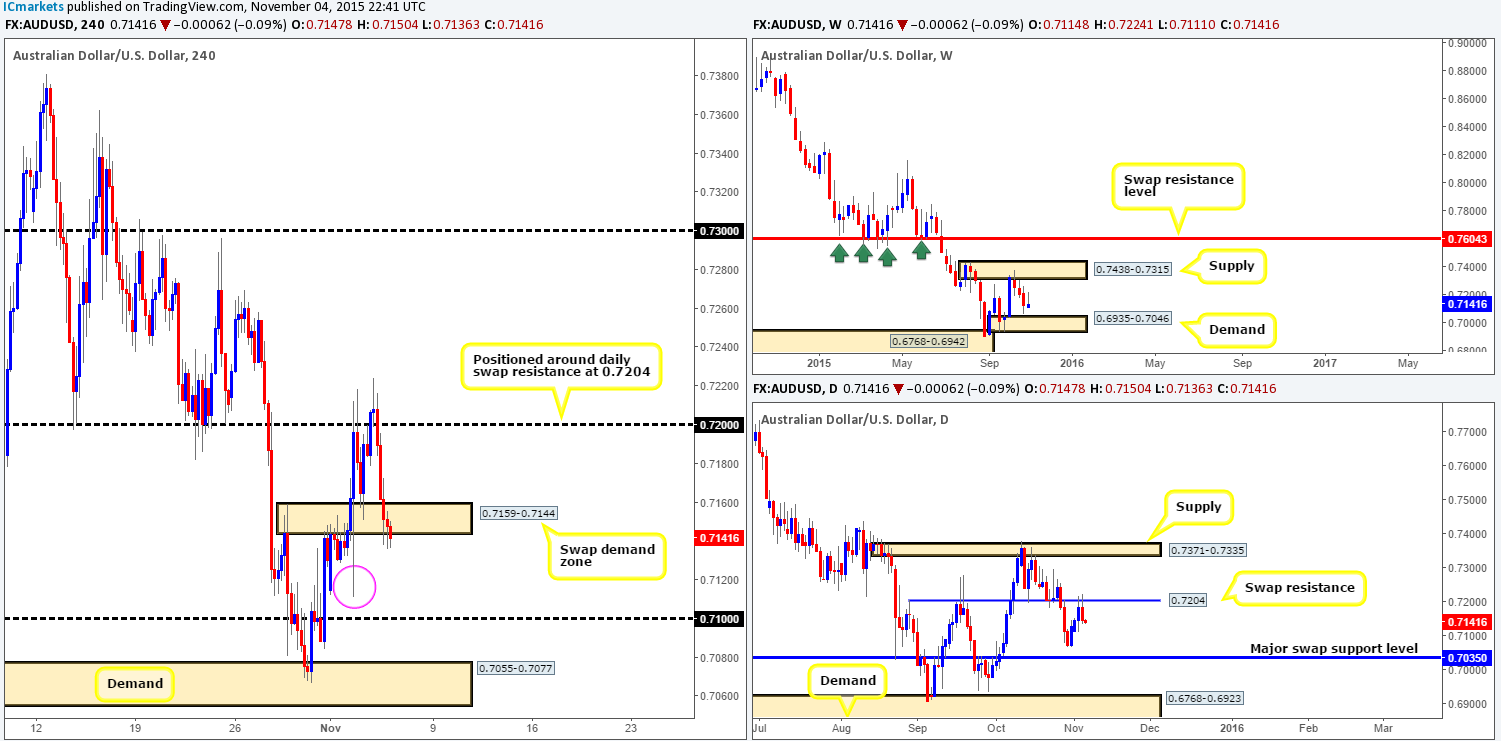
A strong ceiling of offers was hit around the 0.7224 mark going into the early hours of yesterday’s sessions. This sent the Aussie screaming lower for the remainder of the trading day, eventually jabbing below the swap demand base seen at 0.7159-0.7144 and reaching lows of 0.7136 on the day.
This – coupled with a bearish engulfing candle painted from the underside of the daily swap (resistance) level at 0.7204 yesterday, suggests selling may be the best path to take today.
In the event that we see a convincing close below the above said swap demand base, we’d then be watching for price to retest this beauty as supply and, dependent on how the lower timeframes respond, potentially look to sellthis market. We feel confident in saying this not only because price has recently reacted to the underside of a daily swap level, it is also due to below this area, we see a clear path down to psychological support 0.7100. The low printed during the RBA shenanigans on Tuesday likely cleared a truckload of demand/bids from the market (pink circle) thus creating free space to run south.
Levels to watch/ live orders:
- Buys:Flat (Stop loss: N/A).
- Sells:Watch for bids to be consumed around 0.7159-0.7144 and then look to trade any retest seen at this area (confirmation required).
USD/JPY:
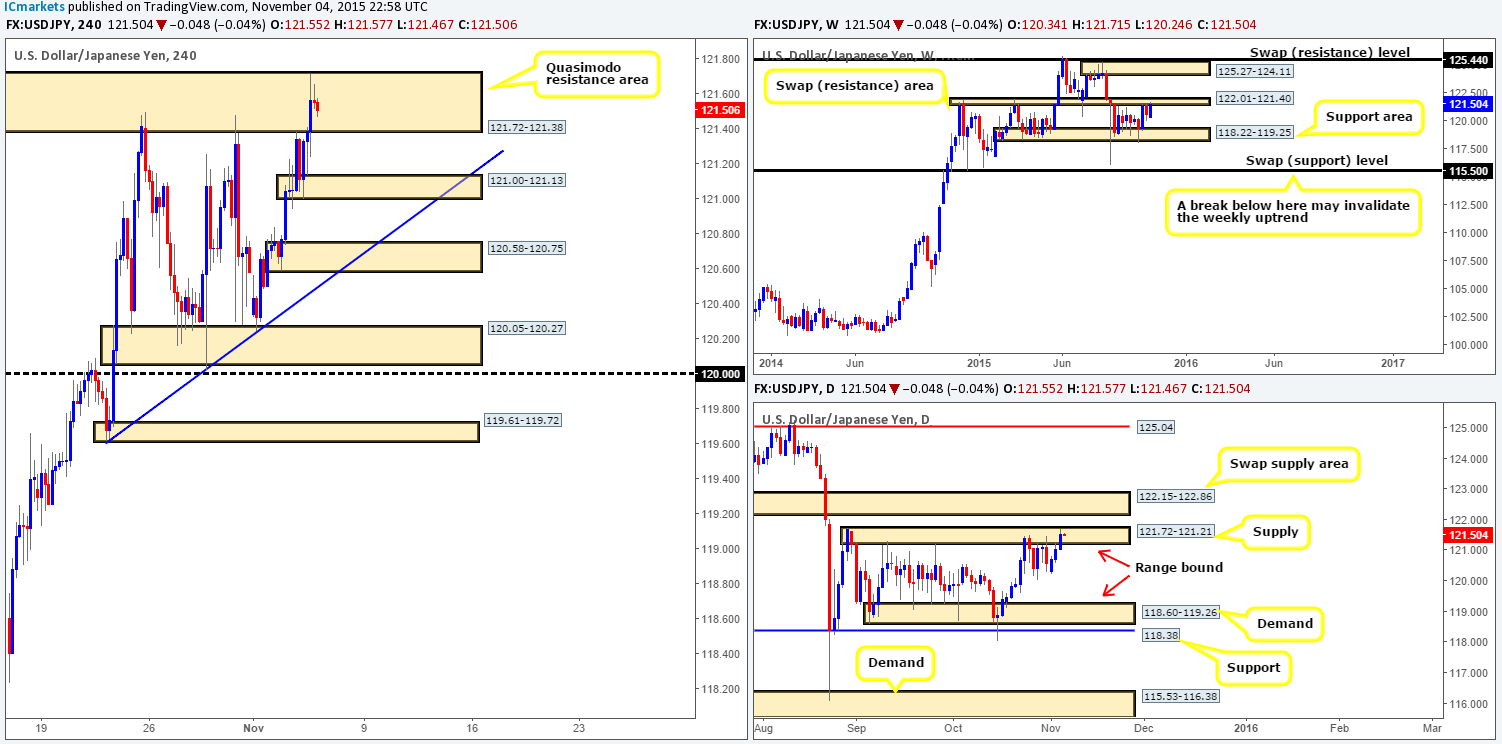
Overall, the USD/JPY increased in value during yesterday’s trade, which saw price surge towards the upper extremes of the 4hr Quasimodo area at 121.72-121.38. Now, given that this zone is located within both a weekly range resistance area at 122.01-121.40, and a daily range supply coming in at 121.72-121.21, there is still a chance, technically anyway, that this pair may head south.
Therefore, keeping it simple and straightforward today, our objective is clear. Watch how the lower timeframe action, (preferably the 30/60 minute timeframes), behaves within the 4hr area. Should one manage to spot a demand being consumed or a trendline break etc… then we believe this pair is headed lower down to at least demand at 121.00-121.13.
Levels to watch/ live orders:
- Buys: Flat (Stop loss: N/A).
- Sells:121.72-121.38 [Tentative – confirmation required] (Stop loss: dependent on where confirms this area).
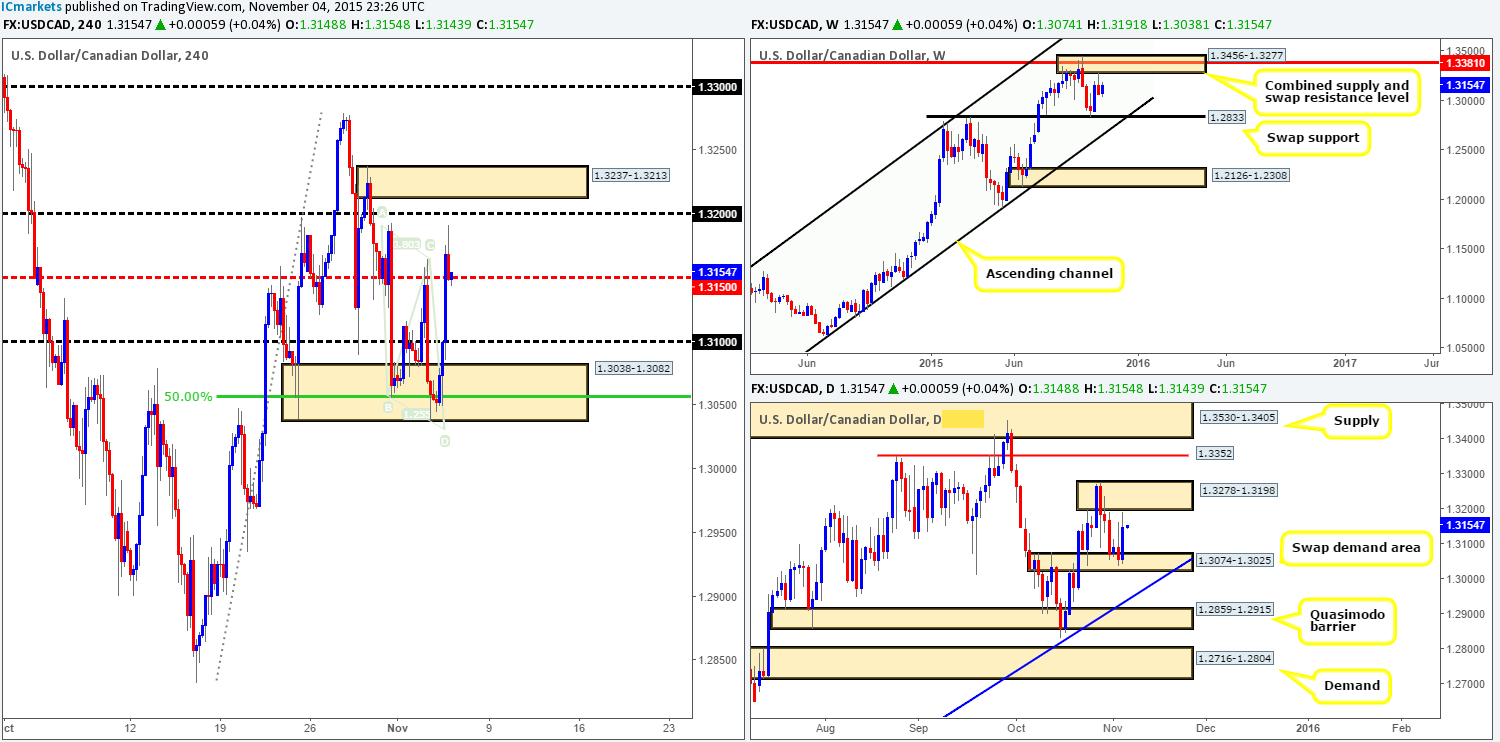
USD/CAD:
Following on from our previous report (http://www.icmarkets.com/blog/wednesday-4th-november-heavy-market-action-expected-between-the-times-of-1-00pm-3-00pm-remain-vigilant/), we mentioned to keep an eye on lower timeframe action around the base of demand coming in at 1.3038-1.3082 for potential longs. This area boasted converging structure from the swap demand area on the daily timeframe at 1.3074-1.3025, but also tied in beautifully with an AB=CD bottom at 1.3029 and a 50.0% Fibonacci support at 1.3055. PLEASE tell us that some of our readers took advantage of this move!!! It was picture-perfect as price rallied over 100 pips north!
Going forward, where do we see this pair heading today? Well to be honest, we’re not seeing much right now. Weekly action is currently hovering between supply at 1.3456-1.3277 and the swap support level 1.2833, whilst on the daily timeframe, price is now tackling the underside of minor structure seen at 1.3278-1.3198. Given this, one could look for confirmed shorts around the supply area at 1.3237-1.3213. The psychological resistance below it at 1.3200 will likely be faked due to how close the supply sits above it.
Levels to watch/ live orders:
- Buys:Flat (stop loss: N/A).
- Sells:1.3237-1.3213 [Tentative – confirmation required] (Stop loss: dependent on where one confirms this area but would likely be above the zone at 1.3241).
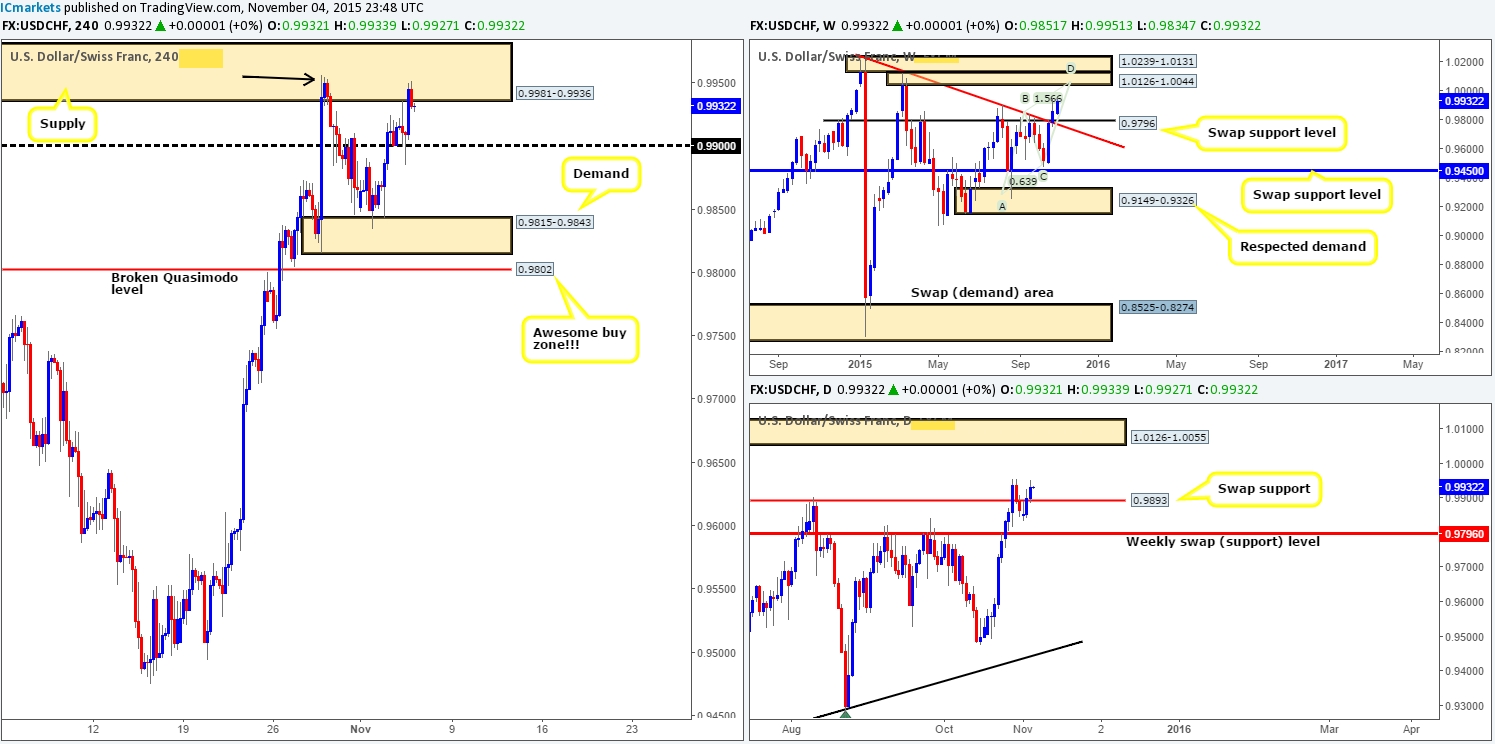
USD/CHF:
In our previous report (http://www.icmarkets.com/blog/wednesday-4th-november-heavy-market-action-expected-between-the-times-of-1-00pm-3-00pm-remain-vigilant/), we noted to watch for a possible buy from psychological support 0.9900. As you can see, transitioning into yesterday’s U.S. session, price action printed a beautiful-looking pin tail from this number (nice buy signal), which clearly encouraged further buying in this market. The pair drove north from here into supply at 0.9981-0.9936, and touched base with last Wednesday’s highs at 0.9957 (black arrow).
For those still long from 0.9900, great work. Unfortunately we missed this trade altogether! Our team, however, still believes there is further upside in this market to be seen yet. Here’s why:
- Last Wednesday’s high 0.9957 likely took out a significant amount of offers when it drove into the above said supply zone, thus potentially opening up the path further north up to the almighty psychological resistance 1.0000 i.e. PARITY!
- Weekly bulls continue to press forward following the close above the swap resistance level at 0.9796. From this angle, we can see a clear run north up to a stacked area of supply coming in at 1.0239-1.0131/1.0126-1.0044. In addition to this formation, we also see a nice-looking AB=CD Harmonic pattern completing around 1.0046, thus forming one heck of a sell zone to keep an eye on!
- In addition to the above, daily action recently retested the broken swap resistance level at 0.9893 as support. Assuming that this retest is legit and the buyers hold ground here, we may, given enough time, see an advance north up to supply visible at 1.0126-1.0055 (located deep within weekly supply mentioned above at 1.0126-1.0044).
Once or indeed if we see a close above last Wednesday’s high today and a retest of this barrier as support, we may, dependent on how the lower timeframe action behaves, look to enter long for an intraday bounce up to 1.0000. It will be interesting to see how this plays out!
Levels to watch/ live orders:
- Buys:Watch for offers to be consumed around 0.9957 and then look to trade any retest seen at this level (confirmation required).
- Sells:Flat (Stop loss: N/A).
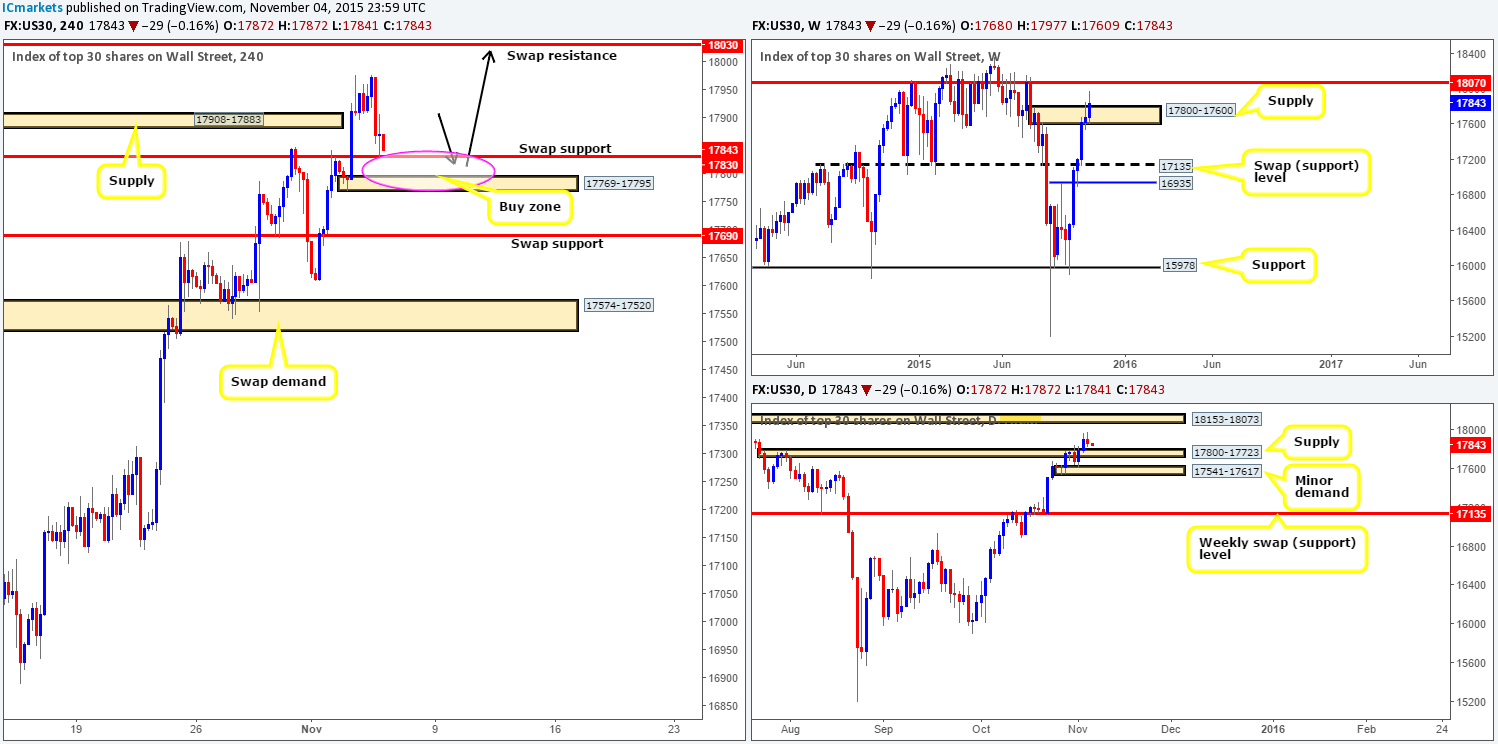
DOW 30:
As can be seen from the chart, the DOW, as we reported may happen in our previous analysis (http://www.icmarkets.com/blog/wednesday-4th-november-heavy-market-action-expected-between-the-times-of-1-00pm-3-00pm-remain-vigilant/), drove lower to retest the swap support level at 17830. Given that price has only recently connected with this barrier, much of the following analysis will be similar to the previous…
The retest of this support, coupled with both the weekly supply at 17800-17600 and its partner supply on the daily timeframe at 17800-17723 now consumed, we feel a buy from either the current support or the demand positioned below it at 17769-17795 is possible today (as per the black arrows)..The risk/reward from either area is extremely good, since our take-profit target would be the swap resistance barrier at 18030 (sits just below the weekly resistance level 18070 and daily supply at 18153-18073).
Levels to watch/ live orders:
- Buys: 17830 [Tentative – confirmation required] (Stop loss: dependent on where one confirms this level) 17769-17795 [Tentative – confirmation required] (Stop loss: dependent on where one confirms this area).
- Sells:Flat (Stop loss: N/A).
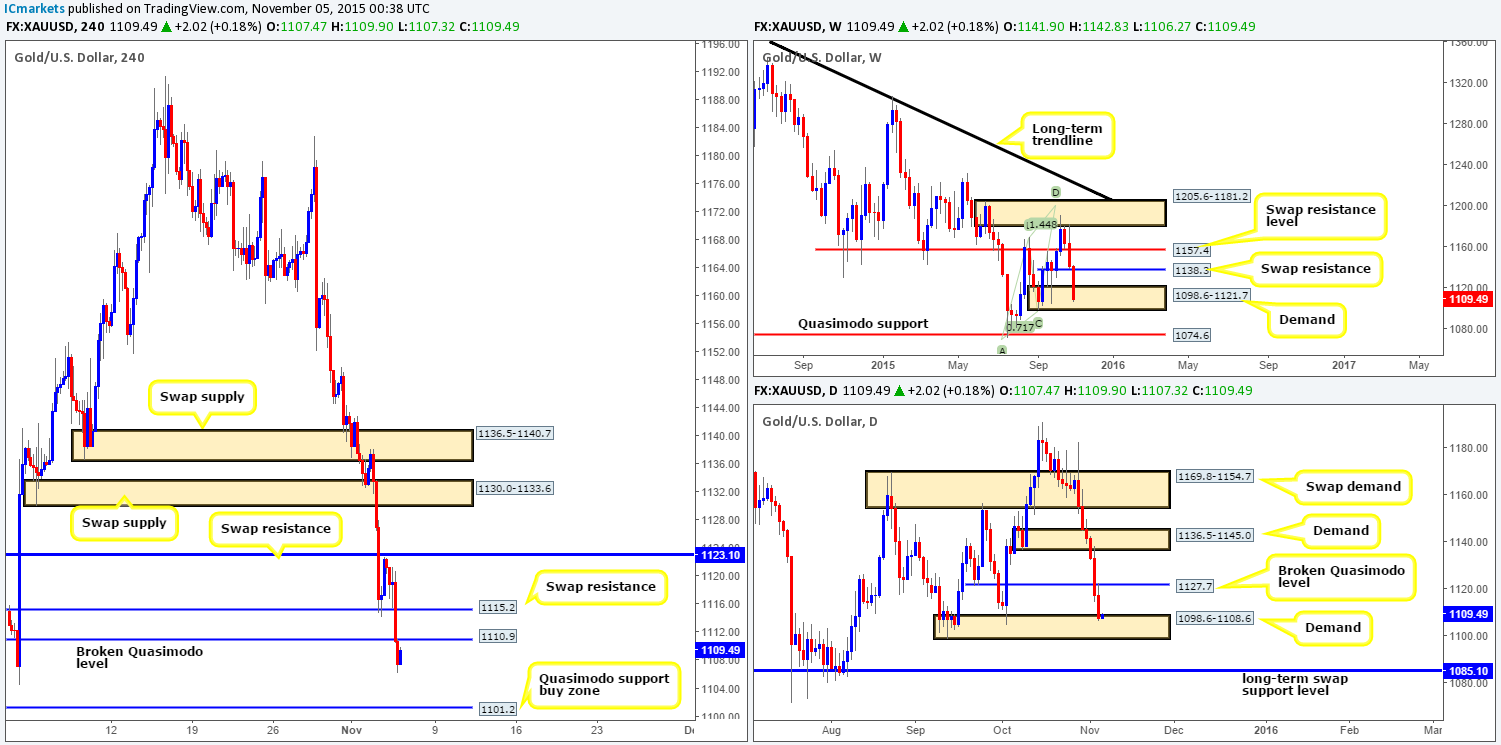
XAU/USD: (Gold)
Kicking off this morning’s analysis with a look at the weekly timeframe shows that Gold continues to depreciate in value. Price is now trading deep within a demand zone drawn from 1098.6-1121.7. Turning our attention to the daily timeframe, however, we can see that price retested the underside of the broken Quasimodo level at 1127.7 beautifully yesterday, forcing the precious metal into the jaws of demand coming in at 1098.6-1108.6 (located deep within the aforementioned weekly demand zone).
Looking down into the pits of the 4hr timeframe reveals that yesterday’s descent from just below the swap resistance level at 1123.1 took out Quasimodo support (now swap resistance) at 1115.2, and also another Quasimodo support (now acting resistance) at 1110.9, reaching lows of 1106.2 on the day.
Technically, this market, at least as far as we are aware, is seriously oversold right now. That being the case, our team is currently eyeing the Quasimodo support level at 1101.2 for longs (located deep within both the above said higher timeframe demands). Should price reach this level, we plan on buying at market here, and placing our stop below the weekly demand mentioned above at 1097.1
Levels to watch/live orders:
- Buys:1101.2 [Looking to enter at market here] (Stop loss: 1097.1).
- Sells: Flat (Stop loss: N/A).


