A note on lower timeframe confirming price action…
Waiting for lower timeframe confirmation is our main tool to confirm strength within higher timeframe zones, and has really been the key to our trading success. It takes a little time to understand the subtle nuances, however, as each trade is never the same, but once you master the rhythm so to speak, you will be saved from countless unnecessary losing trades. The following is a list of what we look for:
- A break/retest of supply or demand dependent on which way you’re trading.
- A trendline break/retest.
- Buying/selling tails – essentially we look for a cluster of very obvious spikes off of lower timeframe support and resistance levels within the higher timeframe zone.
- Candlestick patterns. We tend to only stick with pin bars and engulfing bars as these have proven to be the most effective.
For us, lower timeframe confirmation starts on the M15 and finishes up on the H1, since most of our higher timeframe areas begin with the H4.
EUR/USD:
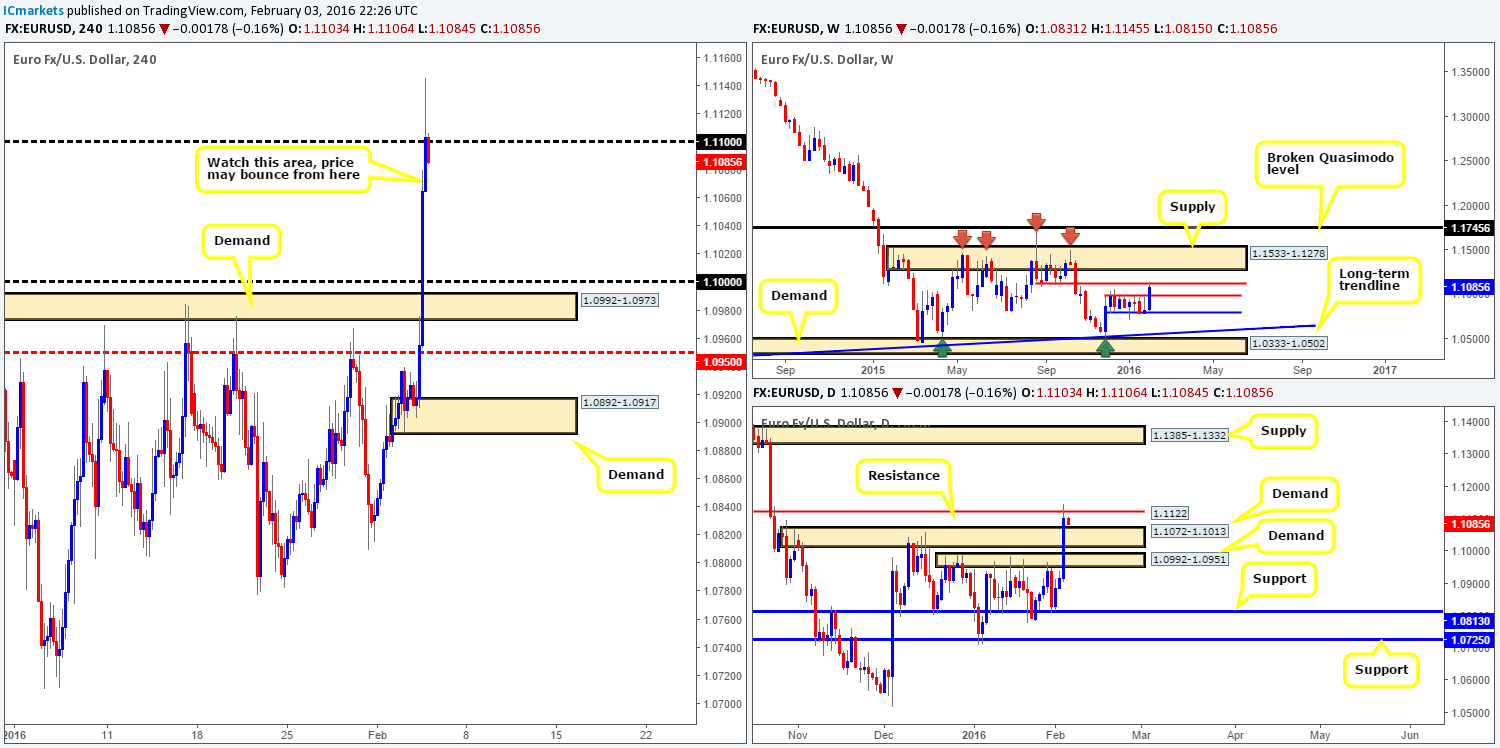
An unrelenting squeeze to the upside took place yesterday as the U.S. dollar slumped across the board. Disappointing U.S. data rallied the single currency around 185 pips (open/close), taking out several technical resistances along the way. As we write, price is currently being offered at psychological resistance 1.1100, which, if you scroll across to the daily timeframe, you’ll see converges with resistance at 1.1122 (can also be seen on the weekly chart too).
In addition to the above, 1.1100 has provided a strong deck of support and resistance in the past, thus making it a probable reversal zone today. However, traders who are considering shorts might want to take into account that a sell-off from here could be short-lived. Reason for why is daily demand (prior supply) at 1.1072-1.1013 is sitting just below current prices.
As far as we can see, technical elements are mixed at the moment (see above in bold) leaving us with little choice but to remain flat for now.
Levels to watch/live orders:
- Buys: Flat (Stop loss: N/A).
- Sells: Flat (Stop loss: N/A).
GBP/USD:
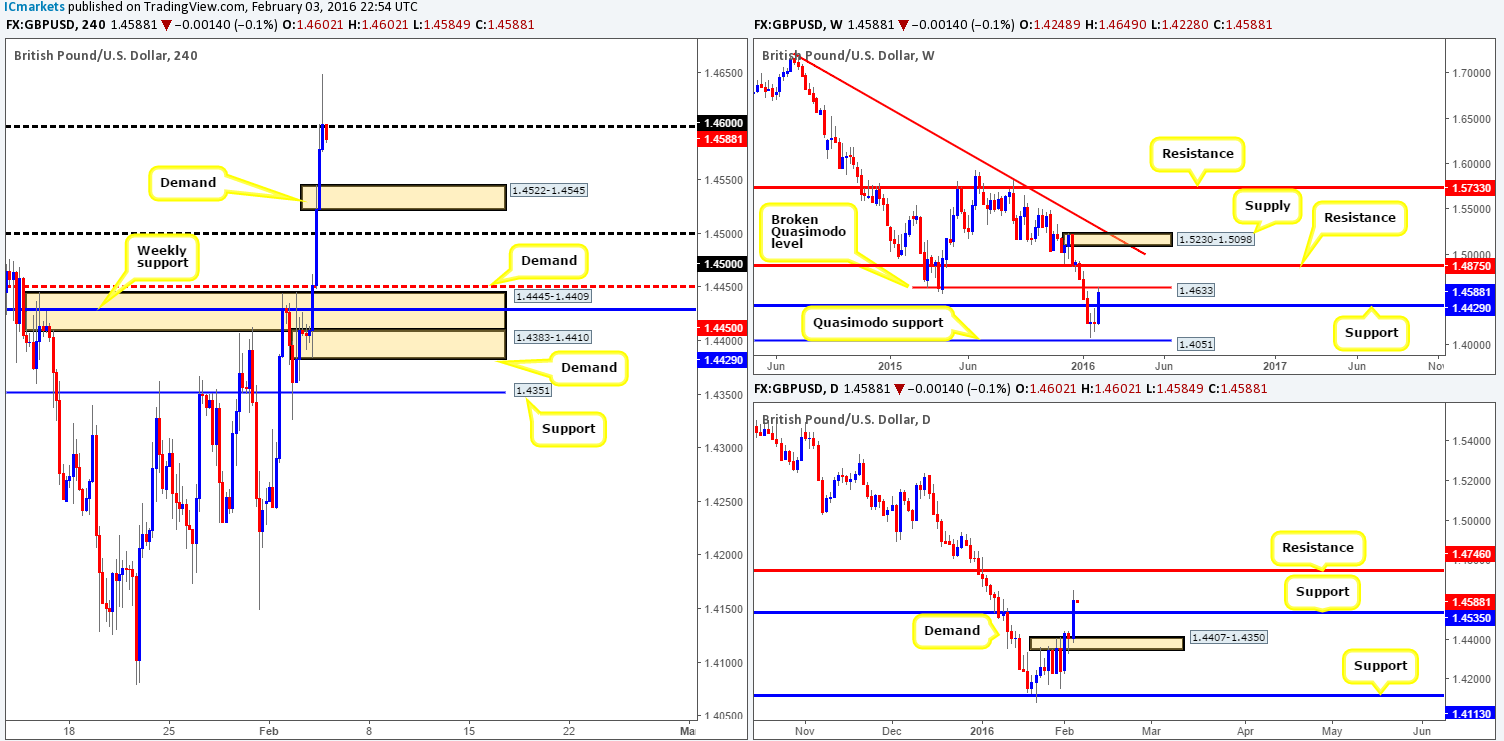
Similar to its bigger brother the EUR/USD, the GBP/USD catapulted itself around 200 pips yesterday on the back of dollar weakness, taking out a truckload of technical resistances in the process. Psychological resistance 1.4600 is, at the time of writing, currently being offered following a deep whipsaw through the base to connect with a broken weekly Quasimodo resistance at 1.4633. Nevertheless, before we smash our fist on the sell button in hope of a 500-pip decline, let’s not dismiss daily action! Yesterday’s rally closed prices above resistance at 1.4535, which could potentially act as support now.
Given the distance from 1.4600 to the H4 demand at 1.4522-1.4545 which surrounds the above said daily support, we believe that shorts are worth a shot today. There is over 50 pips clear profit on offer here with the above said H4 demand as a first take-profit target. Despite this, we still require lower timeframe confirmation before risking capital here since, as we’ve already seen, fakeouts are extremely common around fixed psychological boundaries.
Levels to watch/live orders:
- Buys: Flat (Stop loss: N/A).
- Sells: 1.4600 [Tentative – confirmation required] (Stop loss: dependent on where one confirms this level).
AUD/USD:
In our previous report (http://www.icmarkets.com/blog/wednesday-3rd-february-daily-technical-outlook-and-review/), we spoke about entering long from the base of a H4 AB=CD pattern that completed between the 127.2%/161.8% Fibonacci extensions (yellow area at 0.6978/0.7013). Our second take-profit target at psychological resistance 0.7100 was easily reached and we took final profits at H4 supply drawn from 0.7171-0.7146. We do hope some of our readers took part in this move as this was an extremely high-probability reversal zone.
As can be seen from the chart, the commodity currency recently faked above the aforementioned H4 supply and is now in the process of selling off. It really is a tough call on the Aussie’s next move! On the one hand, price has just recently retested weekly support at 0.7035 and on the other hand daily resistance at 0.7178 is now in play (also visible as resistance on the weekly chart).
However, our team is swaying more to the sell-side of this market today down to at least daily support (a recently broken resistance hurdle) at 0.7112 – effectively the psychological support 0.7100, since traders will likely be cashing in on their longs today. For traders interested in this shorting opportunity, we would advise waiting for the lower timeframes to confirm selling interest exists before taking the plunge. A break of demand, a break of a trendline support or even a collection of selling wicks at a lower timeframe resistance would suffice in our opinion.

Levels to watch/live orders:
- Buys: Flat (Stop loss: N/A).
- Sells: 0.7171-0.7146 [Tentative – confirmation required] (Stop loss: dependent on where one confirms this area).
USD/JPY:
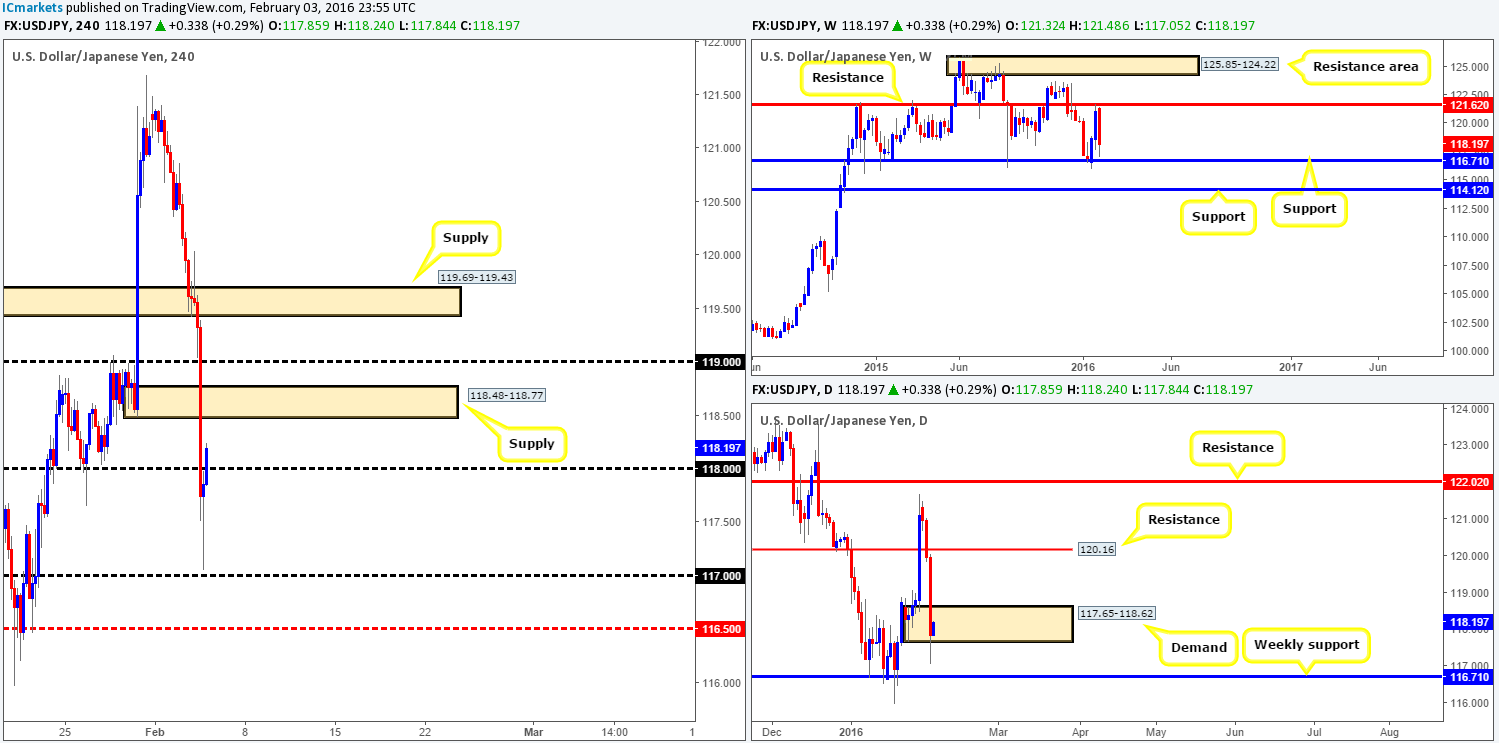
The USD/JPY suffered going into yesterday’s sessions as the sellers pummeled this pair from the word go. Multiple technical H4 supports were wiped out during this bearish onslaught which ended with price bottoming out just above psychological support at 117.00 going into the American afternoon session. In addition to the above, this recent surge in selling has brought weekly action close to support drawn from 116.71, and saw price aggressively fake below daily demand at 117.65-118.62.
Taken the above points on board, where does one go from here? Well, to our way of seeing things, buying this pair is not something our team would stamp high probability. The reasons for why are as follows:
- Stops below daily demand are very likely consumed thus clearing the path lower.
- The path below daily demand leads to weekly support, which as we have seen on the weekly chart could likely come into play very soon.
Given these two points, today’s spotlight will firmly be focused on the recently broken H4 demand at 118.48-118.77 as a possible base in which to sell from. However, we’re not going to be placing any pending orders here due to the possibility of a fake higher to connect with offers around psychological resistance 119.00. In regard to profit targets, we’ll be eyeing the 118.00 figure, followed by 119.00 and then weekly support at 116.71.
 Levels to watch/live orders:
- Buys: Flat (Stop loss: N/A).
- Sells: 118.48-118.77 [Tentative – confirmation required] (Stop loss: dependent on where one confirms this area).
USD/CAD:
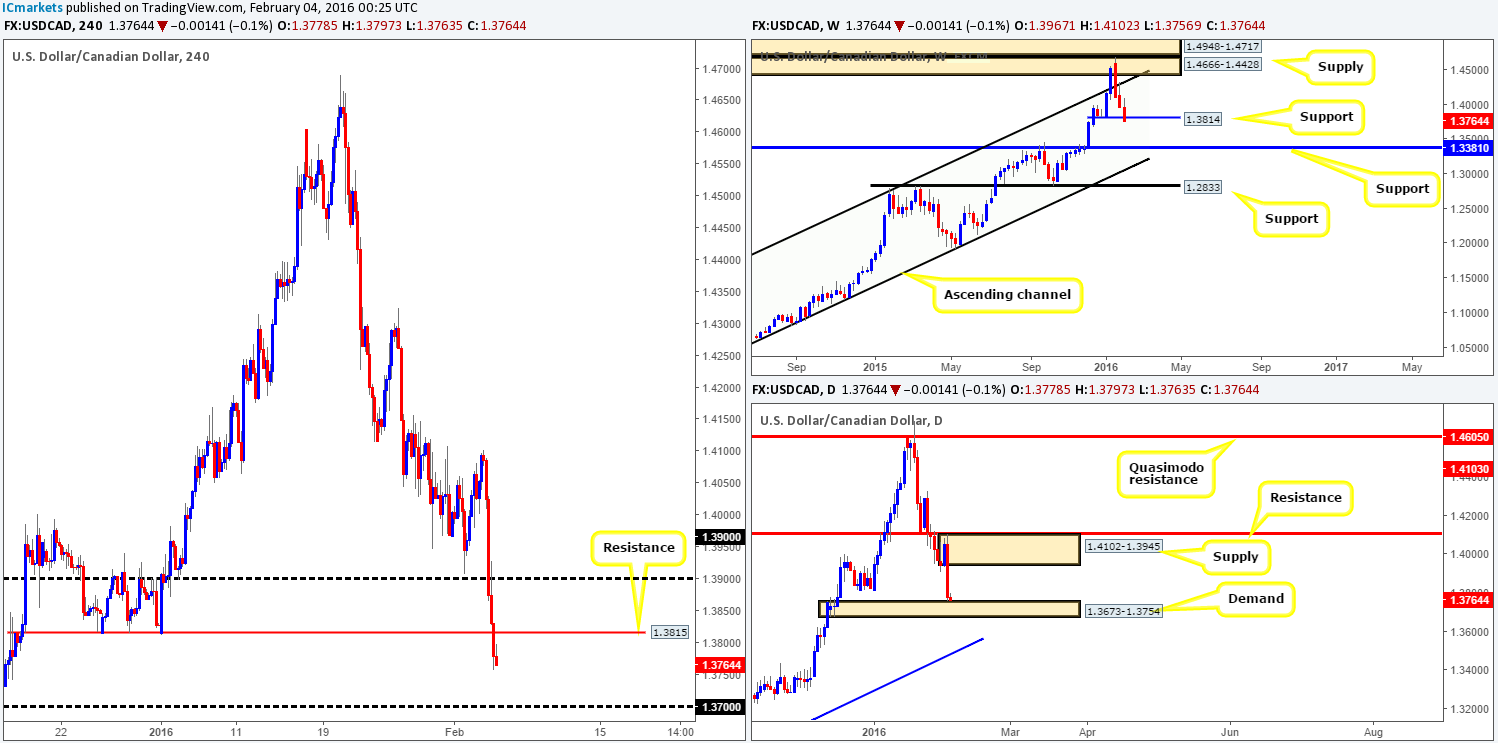
This morning’s analysis will kick-off with a look at the weekly chart, which shows price now trading below support at 1.3814. Until the current weekly candle closes up shop, nevertheless, it would be very difficult to know whether this is a continuation break, or simply a fakeout to bounce higher. Moving down to the daily timeframe, price is now seen teasing the top-side of demand penciled in at 1.3673-1.3754. Should this zone hold ground, supply at 1.4102-1.3945 will likely be the Loonie’s next port of call.
The aggressive sell-off seen during yesterday’s sessions saw H4 action take out several supports as the dollar plummeted across the board. Price ended the day closing below support (now acting resistance) at 1.3815, potentially opening the gates for prices to challenge psychological support 1.3700 today.
Since we know that both the weekly and daily charts show price at support structures (see above) right now, our team is favoring the buy-side of this market. However, the only place we’d feel comfortable entering long would be 1.3700, as it sits deep within the above said daily demand.
On a side note, although H4 direction is clearly pointing south at the moment, selling on any retest seen from 1.3815 would not be a trade we’d label high probability due to the aforementioned higher timeframe supports.
 Levels to watch/live orders:
- Buys: 1.3700 [Tentative – confirmation required] (Stop loss: dependent on where one confirms this level).
- Sells: Flat (Stop loss: N/A).
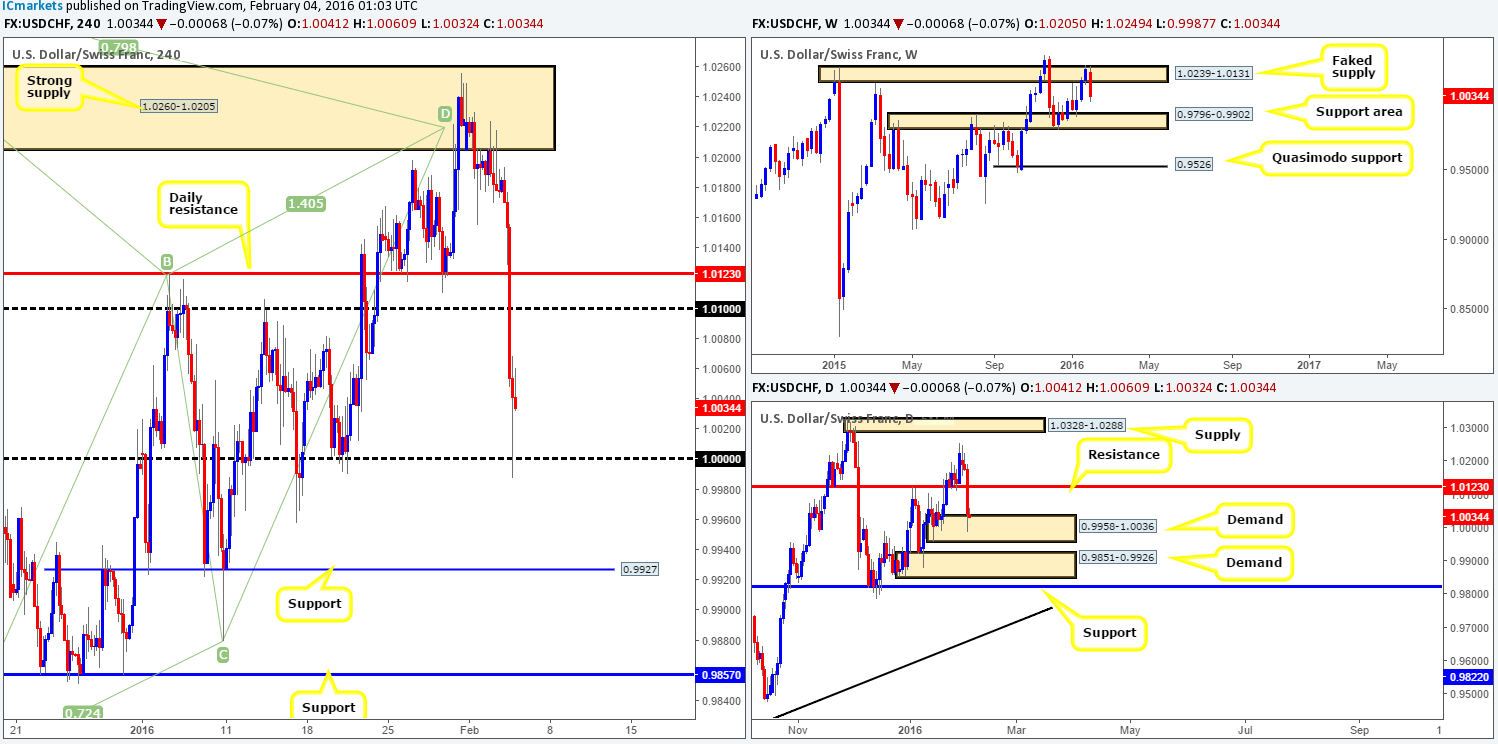
USD/CHF:
Starting from the top this morning, we can see that the USD/CHF is selling off from the underside of a faked supply area on the weekly timeframe at 1.0239-1.0131. Assuming the sellers remain dominant for the remainder of the week, its likely price will touch gloves with a weekly support area drawn from 0.9796-0.9902. Zooming in and looking at the daily timeframe, support (now resistance) at 1.0123 was taken out yesterday, forcing this instrument into demand painted at 0.9958-1.0036.
Stepping down to the H4 timeframe, some of our readers may remember us mentioning that we were still interested in shorting from supply at 1.0260-1.0205 on Monday (http://www.icmarkets.com/blog/monday-1st-february-weekly-technical-outlook-and-review/), since it converged nicely with a H4 Harmonic Gartley pattern at 1.0207/1.0218. Unfortunately, we did not take a short from here, well done to anyone who did though!
Judging by the rebound from parity (1.0000) yesterday, a strong floor of bids is clearly present around this region. Therefore, this number will be key for us today and could effectively go either way here. In the event that we manage to secure a long position at this number, we’d be looking towards mid-level resistance 1.0050 as an immediate take-profit target, followed closely by psychological resistance 1.0100.
Remember, however, that weekly flow is currently pointing south and this could override bids at 1.0000. That being the case, we’d need to see price retest this barrier following a close lower together with a lower timeframe sell signal to short, targeting H4 support at 0.9927 (sits just above the weekly support area mentioned above at 0.9796-0.9902).
Levels to watch/live orders:
- Buys: 1.0000 [Tentative – confirmation required] (Stop loss: dependent on where one confirms this level).
- Sells: Watch for bids to be consumed around 1.0000 and then look to trade any retest seen thereafter (lower timeframe confirmation required).
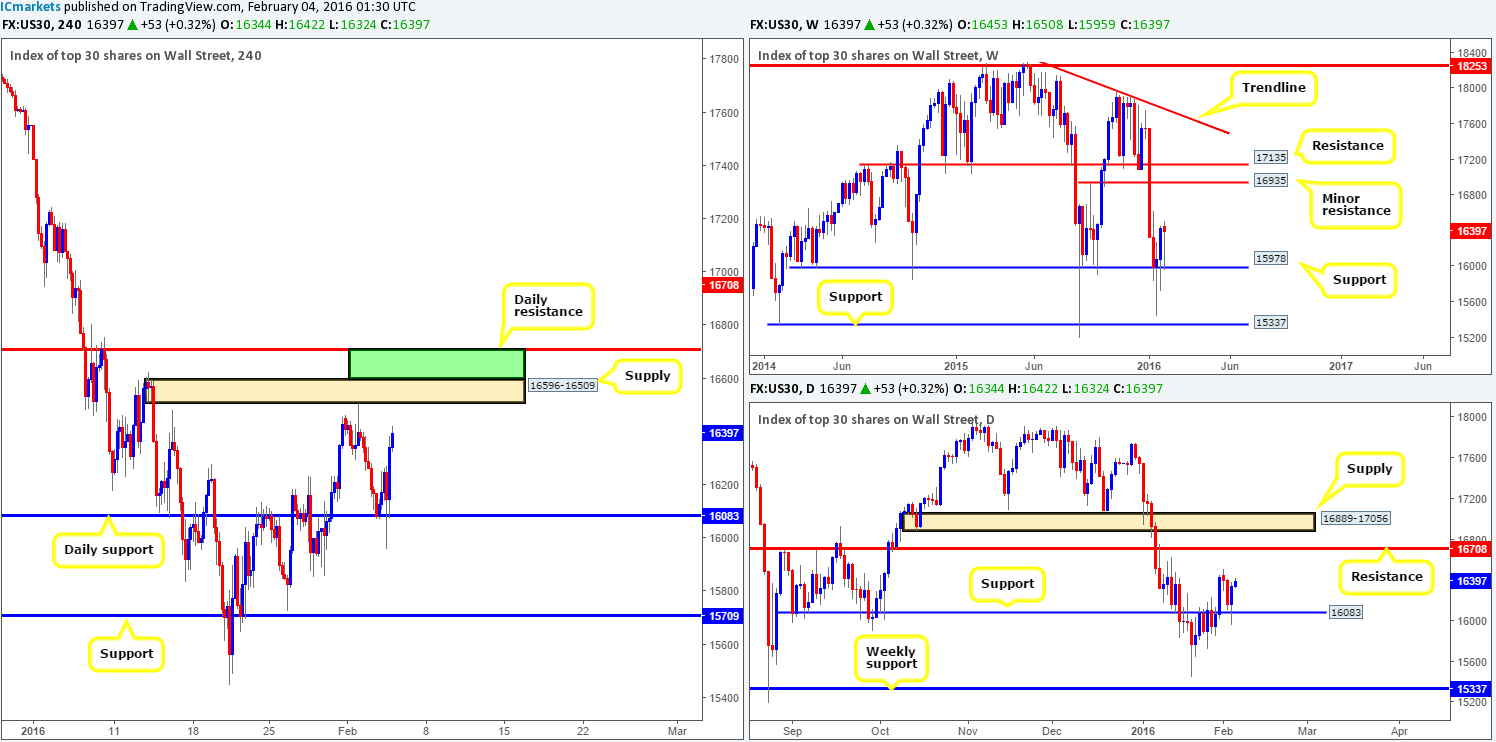
DOW 30:
From the weekly chart, support at 15978 continues to remain well-bid despite the vicious-looking spikes seen below it. Providing that the buyers remain dominant, the next upside target to have on your watch list can be seen around resistance coming in at 16935. On the other side of the coin, one can see that following last Friday’s daily close above daily resistance 16083, this number provided the buyers a floor in which to slingshot itself north yesterday, closing the day positive at 16344. The next upside target as per this timeframe falls in at 16708 – a clear barrier of resistance. Moving down one more level to the H4, it is clear the upside to this index is currently capped by H4 supply drawn from 16596-16509, and as we write, price is not too far from connecting with this said zone.
On account of the above, here is what we have logged so far:
- Although higher timeframe direction is currently pointing north, entering long right now is difficult for two reasons. (1) There is not any clear support in which to base a trade from on the H4, and (2) the distance to the above said H4 supply is very small, thus risk/reward is would be unfavorable.
- This leaves us with looking for shorts and the only place we see this possible right now is between the current H4 supply and daily resistance (green area on H4 chart). Be that as it may, let’s not forget that the weekly chart is showing room to move higher than this barrier of resistance so we may only see a bounce at best from this zone.
Personally, we feel there is not much in the way of a tradable setup which we are confident in at present. As such, we’ll patiently await further developments on the sidelines today.
Levels to watch/live orders:
- Buys: Flat (Stop loss: N/A).
- Sells: Flat (Stop loss: N/A).
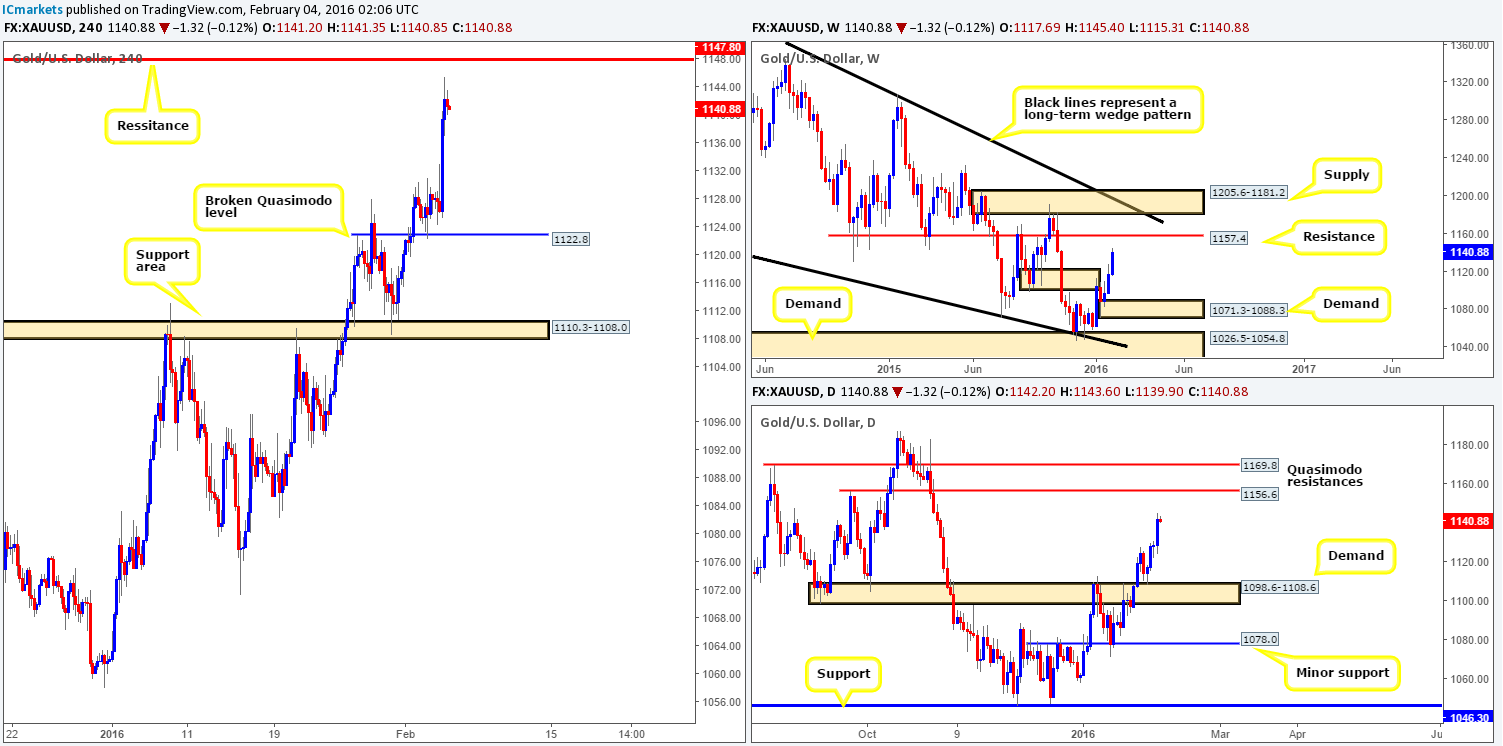
XAU/USD: (Gold)
Coming at you directly from the weekly timeframe this morning, supply at 1098.6-1121.7 has been well and truly consumed, and the path opened up for further buying towards resistance at 1157.4, which looks as though it will be hit soon.
Rolling a page lower to the daily timeframe, we can see that ever since price rebounded from the demand at 1098.6-1108.6 on Friday last week, Gold has remained well-bid. The next upside target from here can be seen around the Quasimodo resistance barrier penciled in at 1156.6, followed closely by another Quasimodo resistance at 1169.8 (can also be seen on the weekly chart).
Looking at the H4 chart, Yesterday’s rally was underpinned by dollar weakness, pushing prices to highs of 1145.4 on the day. Directly above here hangs a resistance level drawn from 1147.8. This, as far as we can see, is all that is standing in the way of a continuation move up to the daily Quasimodo resistance level mentioned above at 1156.6. Given the clear direction seen on the higher-timeframe picture at the moment (see above), shorting from this H4 resistance is not something we’d be comfortable taking part in.
Ultimately, the only opportunities that jump out to us right now would either be a long on a break above and confirmed retest of 1147.8, or a buy from the broken Quasimodo level at 1122.8 should price pullback this far. Other than this, the safest and, in our opinion, most logical position would be to remain flat.
Levels to watch/live orders:
- Buys: 1122.8 [Tentative – confirmation required] (Stop loss: dependent on where one confirms this level). Watch for offers to be consumed around 1147.8 and look to trade any retest seen thereafter (lower timeframe confirmation preferred).
- Sells: Flat (Stop loss: N/A).


