Waiting for lower timeframe confirmation is our main tool to confirm strength within higher timeframe zones, and has really been the key to our trading success. It takes a little time to understand the subtle nuances, however, as each trade is never the same, but once you master the rhythm so to speak, you will be saved from countless unnecessary losing trades. The following is a list of what we look for:
- A break/retest of supply or demand dependent on which way you’re trading.
- A trendline break/retest.
- Buying/selling tails/wicks – essentially we look for a cluster of very obvious spikes off of lower timeframe support and resistance levels within the higher timeframe zone.
- Candlestick patterns. We tend to stick with pin bars and engulfing bars as these have proven to be the most effective.
We typically search for lower-timeframe confirmation between the M15 and H1 timeframes, since most of our higher-timeframe areas begin with the H4. Stops are usually placed 1-3 pips beyond confirming structures.
EUR/USD:
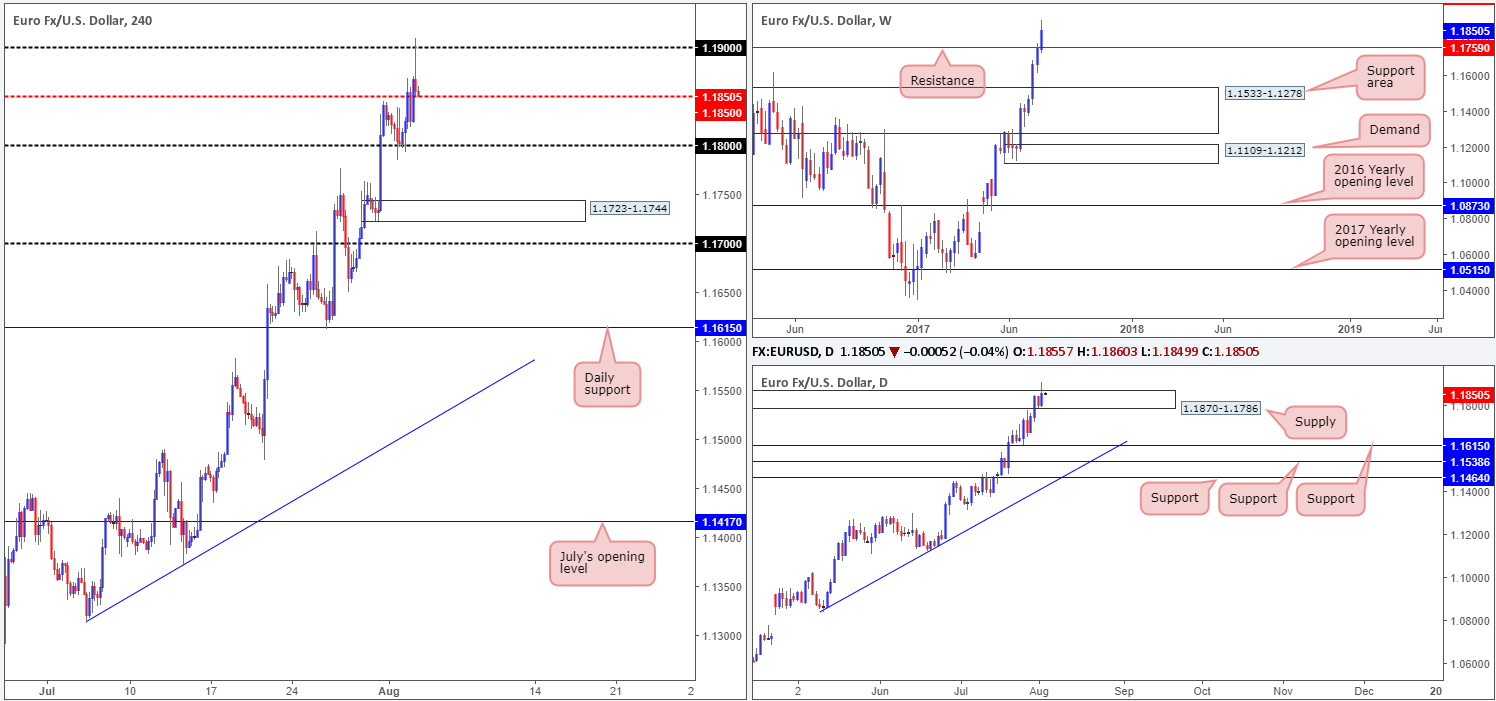
Using a top-down approach this morning, we can see that weekly bulls continue to reassert their dominance above weekly resistance at 1.1759. Should the major conclude the week closing beyond this line, further buying could take shape up to a weekly resistance planted at 1.2044. Down on the daily picture, the supply pegged at 1.1870-1.1786 suffered a breach during yesterday’s segment. Whether this move is enough to clear shorts from the zone is difficult to judge at this time, as ideally we like to see a decisive close form to confirm consumption.
Across on the H4 timeframe, the 1.18 handle remained a strong support, forcing the single currency to break and eventually close beyond the mid-level resistance at 1.1850. It was only in the later hours, however, did we witness the unit edge higher and challenge the 1.19 band, which, as you can see, held firm and formed a bearish selling wick going into the closing bell.
Our suggestions: While it is clear that this market is in a robust position right now, we are reluctant to consider buying until the noted daily supply has been consumed. In addition to this, our desk is still short the GBP/USD!
Data points to consider: US Weekly unemployment claims at 1.30pm, US Non-manufacturing PMI at 3pm GMT+1.
Levels to watch/live orders:
- Buys: Flat (stop loss: N/A).
- Sells: Flat (stop loss: N/A).
GBP/USD:
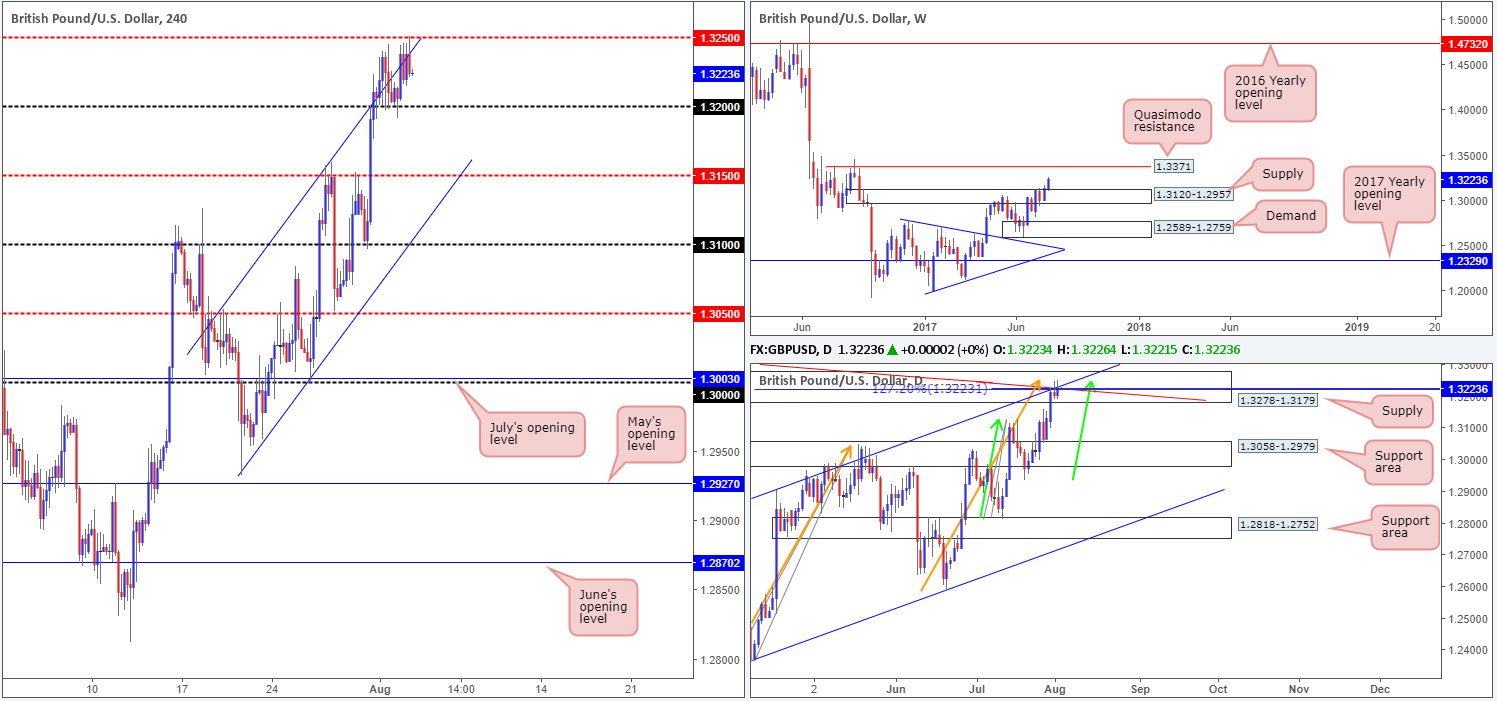
For those who follow our reports on a regular basis, you may recall that our desk recently took a short position from 1.3209, with conservative stops planted at 1.3280. While our trade has yet to move in to a profit, our reasoning behind executing a short position here is strong: the daily structure surrounding daily supply at 1.3278-1.3179 (our stops are positioned two pips above this zone). Currently in play, we have a daily trendline resistance taken from the high 1.3477, a daily channel resistance drawn from the high 1.2903 and two converging daily AB=CD (green/orange arrows) 127.2 Fib extensions at 1.3222/1.3223 (taken from the lows 1.2811/1.2365). Also, for you RSI fans, there is daily divergence in motion, as well.
On the H4 timeframe, the 1.32 handle is proving to be a durable support, despite the H4 channel resistance (extended from the high 1.3053) capping upside moves. Although the confluence seen on the daily chart is attractive, we still have concerns above weekly price trading above weekly supply at 1.3120-1.2957, which may end up pulling price higher and eventually filing our stop-loss order.
Our suggestions: Ultimately, we are looking for H4 price to cross below the 1.32 boundary today as this will not only confirm bearish strength from the noted daily supply, but also open up the path south down to the mid-level base 1.3150. This is where we’ll look to reduce risk to breakeven and take partial profits.
Data points to consider: UK Services PMI at 9.30am, UK BoE Inflation report and monetary policy decisions at midday, followed closely by BoE Gov. Carney taking the stage at 12.30pm. US Weekly unemployment claims at 1.30pm, US Non-manufacturing PMI at 3pm GMT+1.
Levels to watch/live orders:
- Buys: Flat (stop loss: N/A).
- Sells: 1.3209 ([live] stop loss: 1.3280).
AUD/USD:
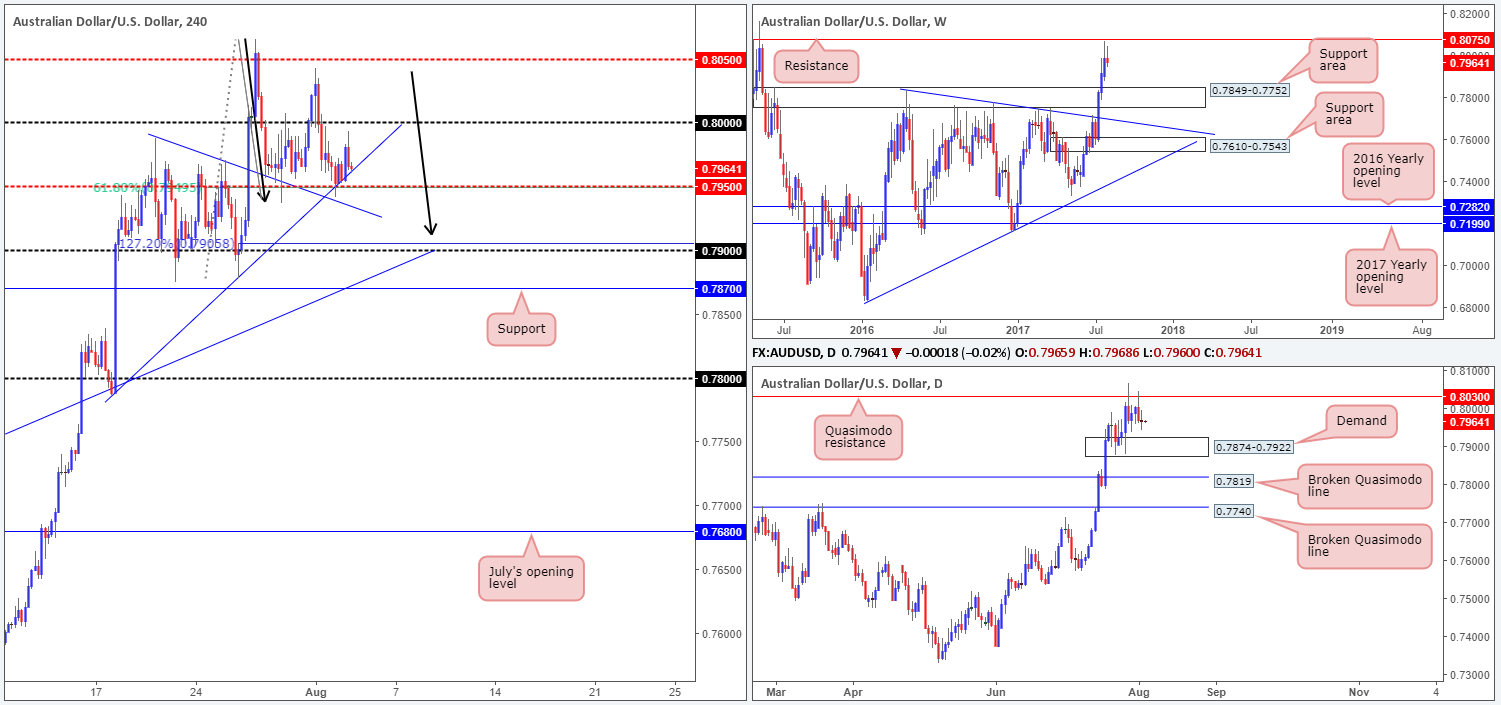
As can be seen from the H4 timeframe this morning, the mid-level support at 0.7950 elbowed its way back into the spotlight yesterday. With this level seen fusing closely with a H4 trendline support taken from the high 0.7987, a H4 trendline support drawn from the low 0.7786 and also a H4 61.8% Fib support at 0.7950 etched the low 0.7877, we are not surprised to see this level holding firm. Why did we not take a long position from here then? Well, this was due to the surrounding landscape, as both the weekly and daily timeframes show room to extend lower, with the closest support seen at daily demand drawn from 0.7874-0.7922. Further adding to this, it’s clear to see that the H4 candles are in the process of chalking up a potential D-leg to an AB=CD bullish formation (black arrows) that completes just ahead of the 0.79 handle (the 127.2% ext. at 0.7905).
Our suggestions: In the long run, we still believe that the Aussie is heading lower. However, selling this market is awkward. Not only do we have the nearby H4 supports in play, but beyond here we’re unfortunately left with little space for a reasonable sell given that the top edge of the daily demand area is located nearby at 0.7922!
Therefore, we feel placing this pair on the sidelines may be the way to go since neither a long nor short seems attractive right now.
Data points to consider: Australian Trade balance at 2.30am GMT+1. US Weekly unemployment claims at 1.30pm, US Non-manufacturing PMI at 3pm GMT+1.
Levels to watch/live orders:
- Buys: Flat (stop loss: N/A).
- Sells: Flat (stop loss: N/A).
USD/JPY:
In Wednesday’s report, you may recall our team highlighting the 111.07/110.83 neighborhood as a potential sell zone (marked in green on the H4 chart). Comprised of a H4 Fibonacci resistance cluster (50.0%/61.8%/78.6% taken from the highs 112.19/111.71/111.28), June’s opening level at 110.83 and a psychological band at 111, the pair managed to find a pocket of offers here during yesterday’s segment. Well done to any of our readers who managed to take advantage of this move.
Although H4 price aggressively sold off from the noted sell zone and even dug itself below the mid-level support at 110.50, we’ve seen the couple make a complete U-turn in recent candles. The question is will this green zone be able to hold the market lower for a second time?
Our suggestions: From the weekly timeframe, the market looks as though it could continue to press lower until we reach the small demand base seen at 108.13-108.95. Zooming in and looking at the daily picture, we can see that price is in contact with resistance at 110.76. With the higher-timeframe picture suggesting that further selling could be on the cards, we do believe H4 sell zone may hold for a second round.
However, as we mentioned in Wednesday’s analysis, there’s a risk of price faking beyond the sell zone to test May’s opening level seen nearby at 111.31. As such, we would strongly advise waiting for lower-timeframe confirming action (see the top of this report for details), before pulling the trigger.
Data points to consider: US Weekly unemployment claims at 1.30pm, US Non-manufacturing PMI at 3pm GMT+1.

Levels to watch/live orders:
- Buys: Flat (stop loss: N/A).
- Sells: 111.07/110.83 ([Waiting for a lower-timeframe confirming signal to form is advised before pushing the sell button here] stop loss: dependent on where one confirms the area).


