GBP/USD:
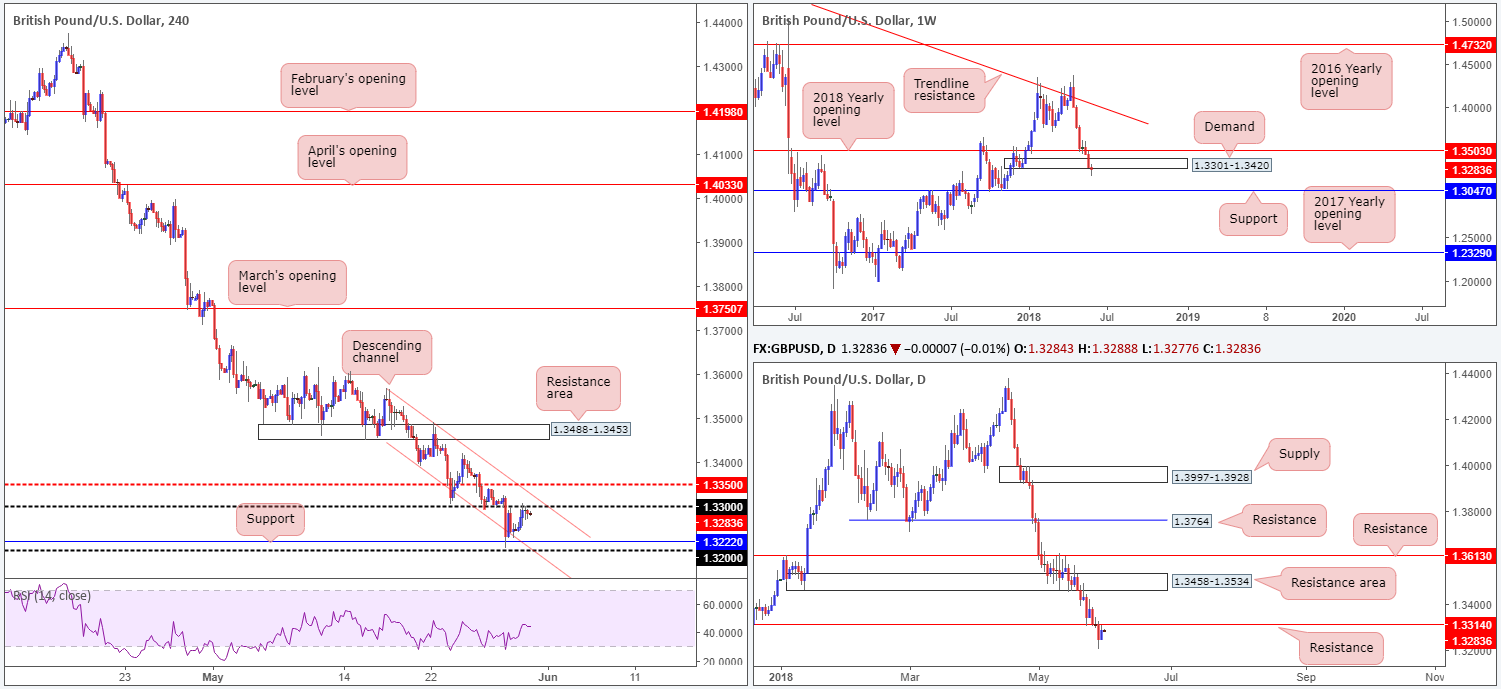
The British pound is marginally stronger against its US counterpart this morning, benefiting from easing risk aversion. As you can see, H4 price found support just north of 1.32 at support drawn from 1.3222, and has since chalked up a series of recovery candles towards the 1.33 point. Also worthy of note on the H4 scale is the descending channel formation drawn from 1.3569/1.3390.
Despite the recent bout of buying, support appears to be limited in this market. Weekly flow breached demand coming in at 1.3301-1.3420, likely triggering a round of stop-loss orders in the process. The next support target on this scale can be found at 1.3047. In conjunction with weekly action, daily price is seen trading firmly below support at 1.3314 (now acting resistance), and shows little in terms of supportive structure until reaching 1.3063: a daily support that’s sited just north of the aforementioned weekly support (not seen on the screen).
Areas of consideration:
We feel it is going to be a challenge for the bulls to overcome 1.33 today, given daily resistance being positioned at 1.3314. With that being said, the team has noted to consider shorts in and around the 1.33 zone today. Stop-loss orders should ideally be positioned above the current H4 descending channel, with the initial downside target set at 1.3222.
Bear in mind that a short from 1.33 has awesome potential to the downside according to higher-timeframe structure!
Today’s data points: UK net lending to individuals m/m; US core PCE price index m/m; US unemployment claims; Chicago PMI; FOMC members Bostic and Brainard speak.
AUD/USD:
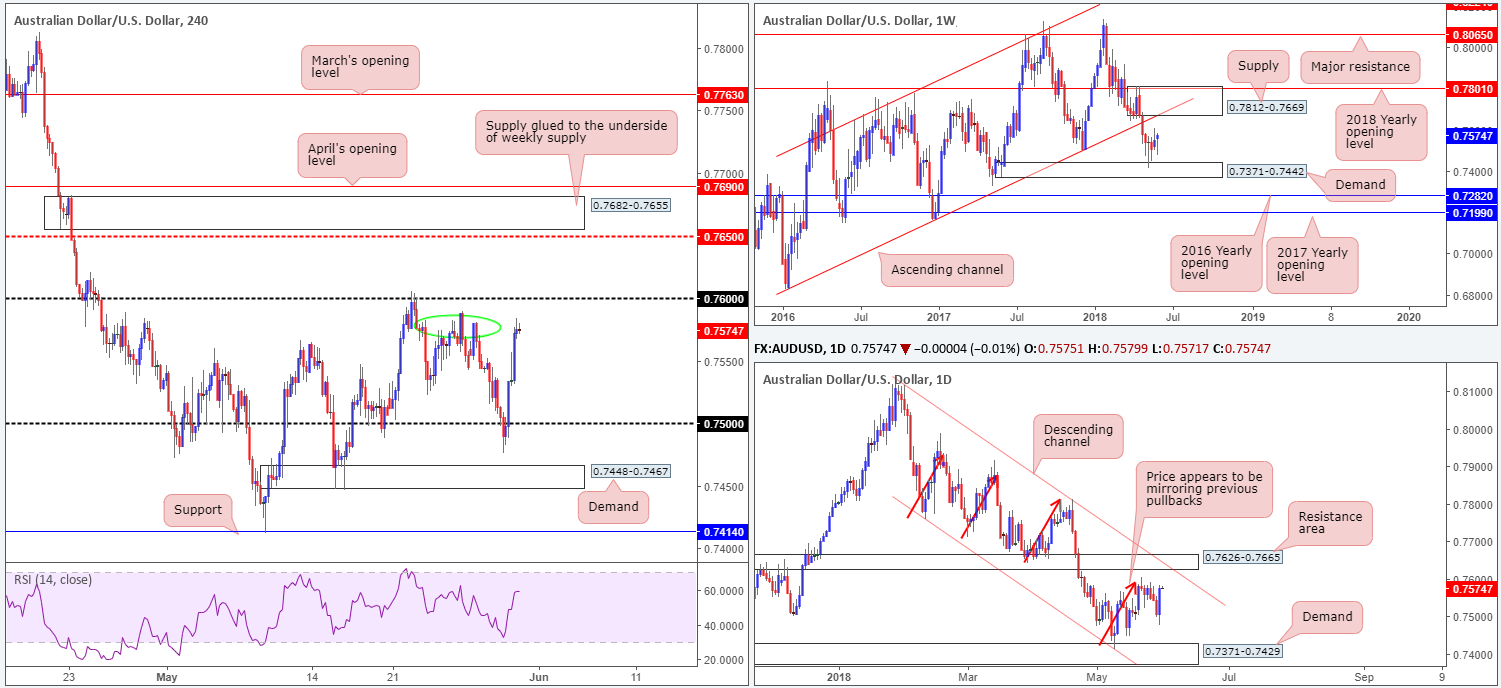
A broad upturn in risk appetite after the extreme aversion prompted by latest Italian political developments helped the commodity currency rebound from the 0.75 region on Wednesday. As of current price, the unit is seen testing H4 tops around the 0.7580 neighborhood (green circle), positioned just ahead of the 0.76 handle.
Over on the weekly timeframe, upside appears free until we reach supply noted at 0.7812-0.7669, which happens to intersect beautifully with channel support-turned resistance taken from the low 0.6827. Daily structure, on the other hand, is currently compressing within a descending channel formation (0.8135/0.7758). Interestingly, traders may want to note that the top edge of this channel converges beautifully with a resistance area plotted at 0.7626-0.7665.
Areas of consideration:
Further buying is likely in this market, with a breach of 0.76 potentially in store according to higher-timeframe structure. Traders should, however, expect sellers to begin making an appearance around the 0.7626 region since this marks the underside of the current daily resistance area, which itself is located just beneath the aforementioned weekly supply.
At current price, we do not see much to hang our hat on in terms of trade setups. Once, or indeed if, price crosses above 0.76 and enters into the jaws of the noted daily resistance area, though, shorts will be favored.
Today’s data points: AUD private capital expenditures q/q; Chinese manufacturing PMI; US core PCE price index m/m; US unemployment claims; Chicago PMI; FOMC members Bostic and Brainard speak.
USD/JPY:
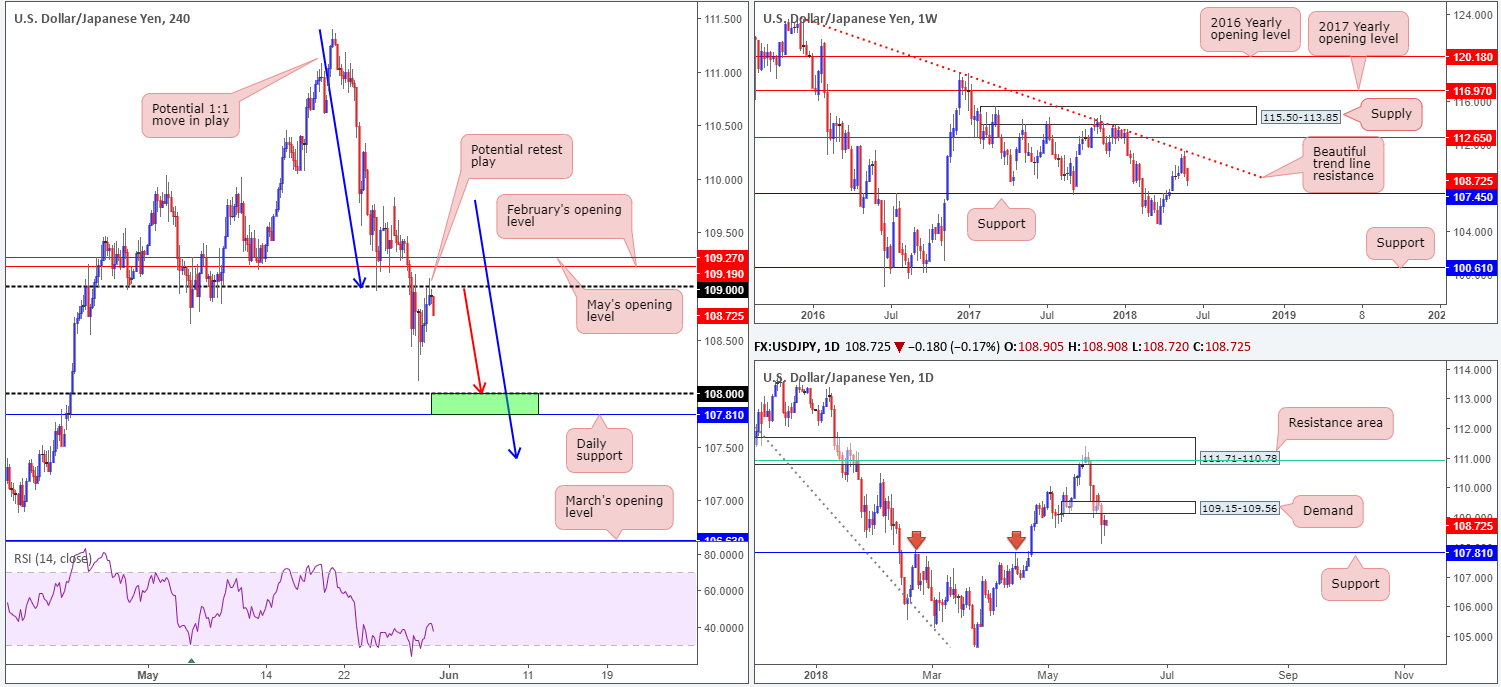
Following a modest recovery to the upside on Wednesday, the USD/JPY peaked around 109.07 amid US trade and concluded the day closing just below 109 on the H4 timeframe. A broad upturn in risk sentiment weakened demand for safe-haven assets such as the Japanese yen.
For those who read Wednesday’s report you may recall the team underscoring the 109 handle as a possible level for a retest play. Technically speaking, this market has plenty of room to probe lower. The H4 scale shows limited support until we reach the 108 handle, while weekly price is currently targeting support at 107.45 along with daily flow seen eyeing support at 107.81. Also notable from a technical perspective is the potential (steep) 1:1 move lower (see blue arrows) on the H4 scale that terminates around the 107.40 neighborhood.
Areas of consideration:
For folks that entered short at the underside of 109, well done! The green area marked on the H4 timeframe between daily support at 107.81 and the 108 round number is a zone we expect the buyers to attempt to make an appearance, so this is an area you may want to consider taking profit. Do bear in mind, though, that weekly price could still pull prices beyond this range to weekly support mentioned above at 107.45.
Today’s data points: US core PCE price index m/m; US unemployment claims; Chicago PMI; FOMC members Bostic and Brainard speak.
USD/CAD:
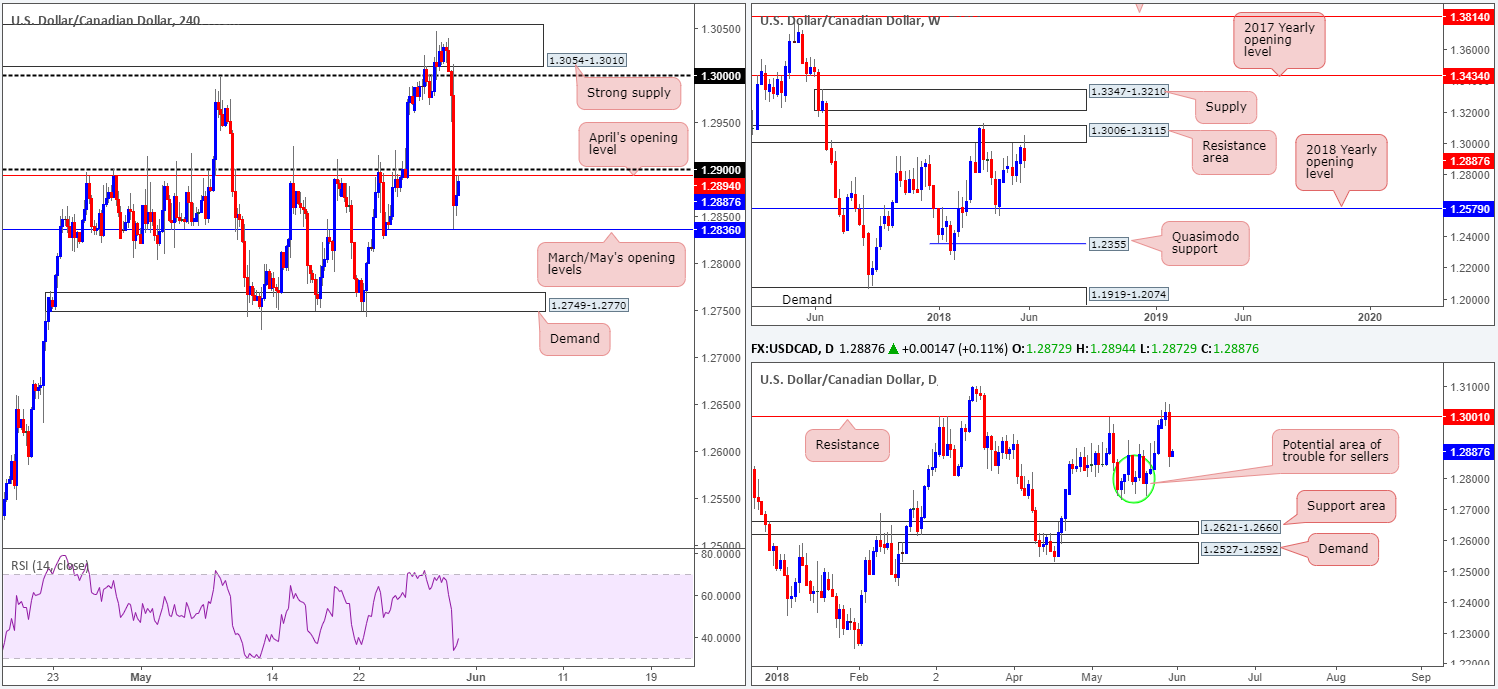
The Canadian dollar, as you can see, strongly outperformed against its US neighbor on Wednesday. The pair accelerated to the downside after the BoC kept its key interest rate at 1.25%, as expected.
In Wednesday’s report, the team noted that the sellers have the upper hand in terms of market structure, and that a pullback was likely. The H4 supply zone seen at 1.3054-1.3010 is labelled as a strong base as it is seen glued to the underside of a weekly resistance area at 1.3006-1.3115. Therefore, it is of little surprise to have seen the zone hold ground. Well done to any of our readers who managed to jump aboard this train as it was a noted move to keep eyes on!
Areas of consideration:
Following H4 price finding support off of March/May’s opening levels at 1.2836 amid US hours, the unit mildly pared recent losses and brought the action back up to April’s opening level seen just ahead of the 1.29 handle at 1.2894. Is this a platform worthy of shorting? Well, according to weekly structure, we have ample room to press as far south as the 2018 yearly opening level noted at 1.2579. On the daily timeframe, however, between 1.2752 and 1.2885 there’s a fair portion of wood to chop through!
On account of the above, the 1.29 region is a viable platform for selling, in our opinion. Nevertheless, to be on the safe side, we would strongly recommend waiting and seeing if H4 price can chalk up a full or near-full-bodied bearish candle from this region before pulling the trigger. This will help avoid any fakeout above 1.29, which, as most are already aware of, is common viewing around psychological numbers. Further to this, it will help protect one against losses in the event of a rebound from 1.2752/1.2885 on the daily scale.
Today’s data points: US core PCE price index m/m; US unemployment claims; Chicago PMI; FOMC members Bostic and Brainard speak; CAD GDP m/m; Crude oil inventories.
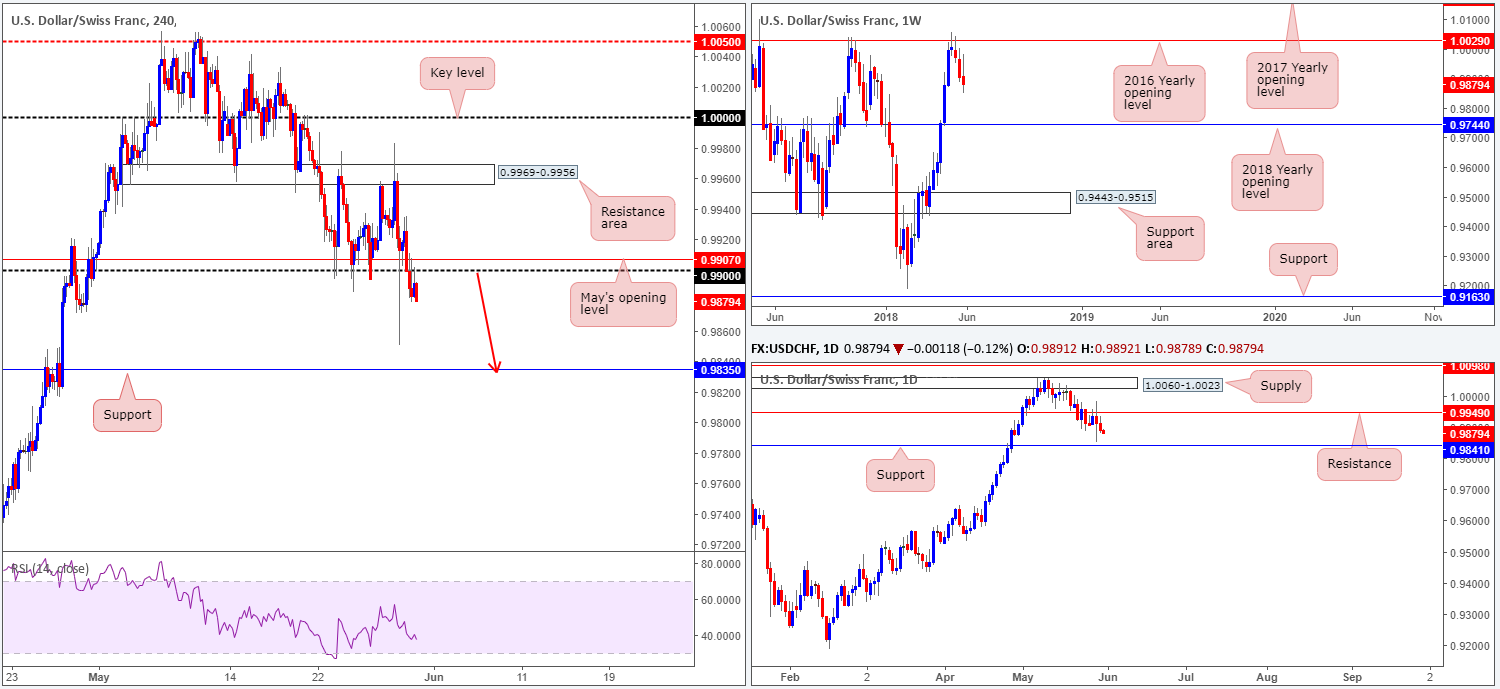
USD/CHF:
Disappointing economic data out of the US, coupled with risk appetite seen crawling back into the markets, prompted a bout of selling on Wednesday. This, as you can see on the H4 scale, eventually saw price conquer the 0.99 handle and later retest it as resistance going into the closing bell. With 0.99 out of the picture, further downside is likely on the cards.
Weekly price continues to emphasize a bearish climate. After a strong push lower from the 2016 yearly opening level at 1.0029, there’s really not very much support seen in view until the unit reaches the 2018 yearly opening level marked at 0.9744. Alongside this, daily action also shows room to press down to support coming in at 0.9841.
Areas of consideration:
Given the recent retest of 0.99 as resistance, we feel shorts are high probability today, targeting daily support mentioned above at 0.9841, followed closely by H4 support at 0.9835.
Today’s data points: US core PCE price index m/m; US unemployment claims; Chicago PMI; FOMC members Bostic and Brainard speak.
Dow Jones Industrial Average:
Major US indexes printed strong gains on Wednesday amid firmer risk appetite seen across the markets. The politic turmoil seen in Italy prompted selling during Tuesday’s segment as traders feared a snap election. However, reports of a renewed attempt to form a coalition government raised hopes the country may avoid a fresh election.
From a technical perspective, recent bidding has pulled the H4 candles up to a resistance area noted at 24610-24750, which happens to hold the 2018 yearly opening level seen printed on the weekly timeframe at 24660 within its walls.
Areas of consideration:
While traders are likely preparing to short the current H4 resistance area, we need to remain cognizant of daily structure: 25229/24866: an area marked in green comprised of a 61.8% daily Fib resistance value and a 127.2% 1:1 correction (see red arrows) daily Fib ext. point. Price could potentially fake above the said H4 resistance zone to connect with the daily base. Therefore, waiting for H4 price to print a full or near-full-bodied bearish candle from 24610-24750 is advised before pulling the trigger.
Today’s data points: US core PCE price index m/m; US unemployment claims; Chicago PMI; FOMC members Bostic and Brainard speak.

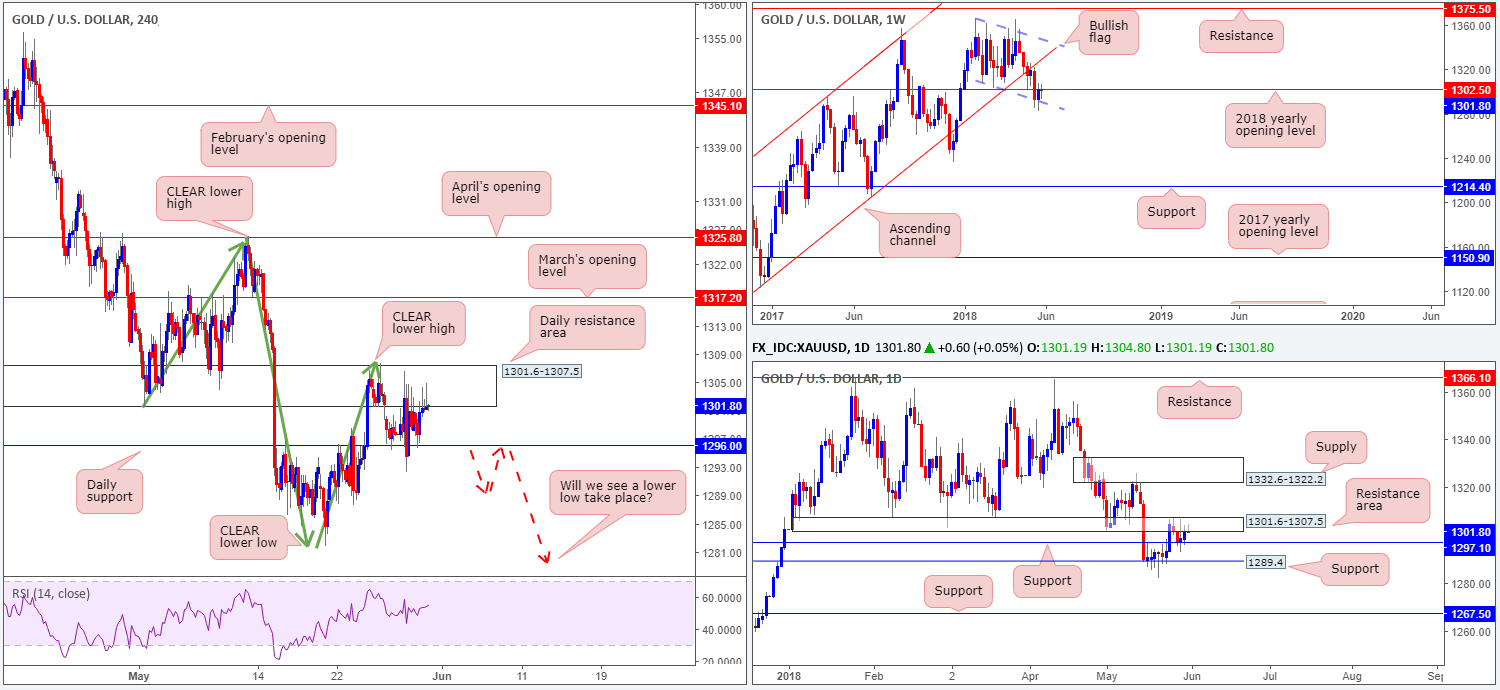
XAU/USD (Gold)
Bullion continued to emphasize a directionless state between a daily resistance area at 1301.6-1307.5 and a daily support drawn from 1296.0 on Wednesday. With that being the case, much of the following will echo thoughts put forward in yesterday’s report.
Despite the market’s ranging behavior right now, further downside is still possible in this market we believe. Our confidence comes from knowing that the 2018 yearly opening level sited on the weekly timeframe at 1302.5 resides within the daily resistance area.
Areas of consideration:
Overall, we’re eventually expecting a lower low to form on the H4 scale (a break of the swing low 1285.8). So, waiting and seeing if H4 price can close below the noted daily support and chalk up a retest as resistance (see red arrows) is recommended, as this would be considered a high-probability shorting opportunity.
The use of the site is agreement that the site is for informational and educational purposes only and does not constitute advice in any form in the furtherance of any trade or trading decisions.
The accuracy, completeness and timeliness of the information contained on this site cannot be guaranteed. IC Markets does not warranty, guarantee or make any representations, or assume any liability with regard to financial results based on the use of the information in the site.
News, views, opinions, recommendations and other information obtained from sources outside of www.icmarkets.com.au, used in this site are believed to be reliable, but we cannot guarantee their accuracy or completeness. All such information is subject to change at any time without notice. IC Markets assumes no responsibility for the content of any linked site. The fact that such links may exist does not indicate approval or endorsement of any material contained on any linked site.
IC Markets is not liable for any harm caused by the transmission, through accessing the services or information on this site, of a computer virus, or other computer code or programming device that might be used to access, delete, damage, disable, disrupt or otherwise impede in any manner, the operation of the site or of any user’s software, hardware, data or property.


