Waiting for lower timeframe confirmation is our main tool to confirm strength within higher timeframe zones, and has really been the key to our trading success. It takes a little time to understand the subtle nuances, however, as each trade is never the same, but once you master the rhythm so to speak, you will be saved from countless unnecessary losing trades. The following is a list of what we look for:
- A break/retest of supply or demand dependent on which way you’re trading.
- A trendline break/retest.
- Buying/selling tails/wicks – essentially we look for a cluster of very obvious spikes off of lower timeframe support and resistance levels within the higher timeframe zone.
We typically search for lower-timeframe confirmation between the M15 and H1 timeframes, since most of our higher-timeframe areas begin with the H4. Stops are usually placed 1-3 pips beyond confirming structures.
EUR/USD:
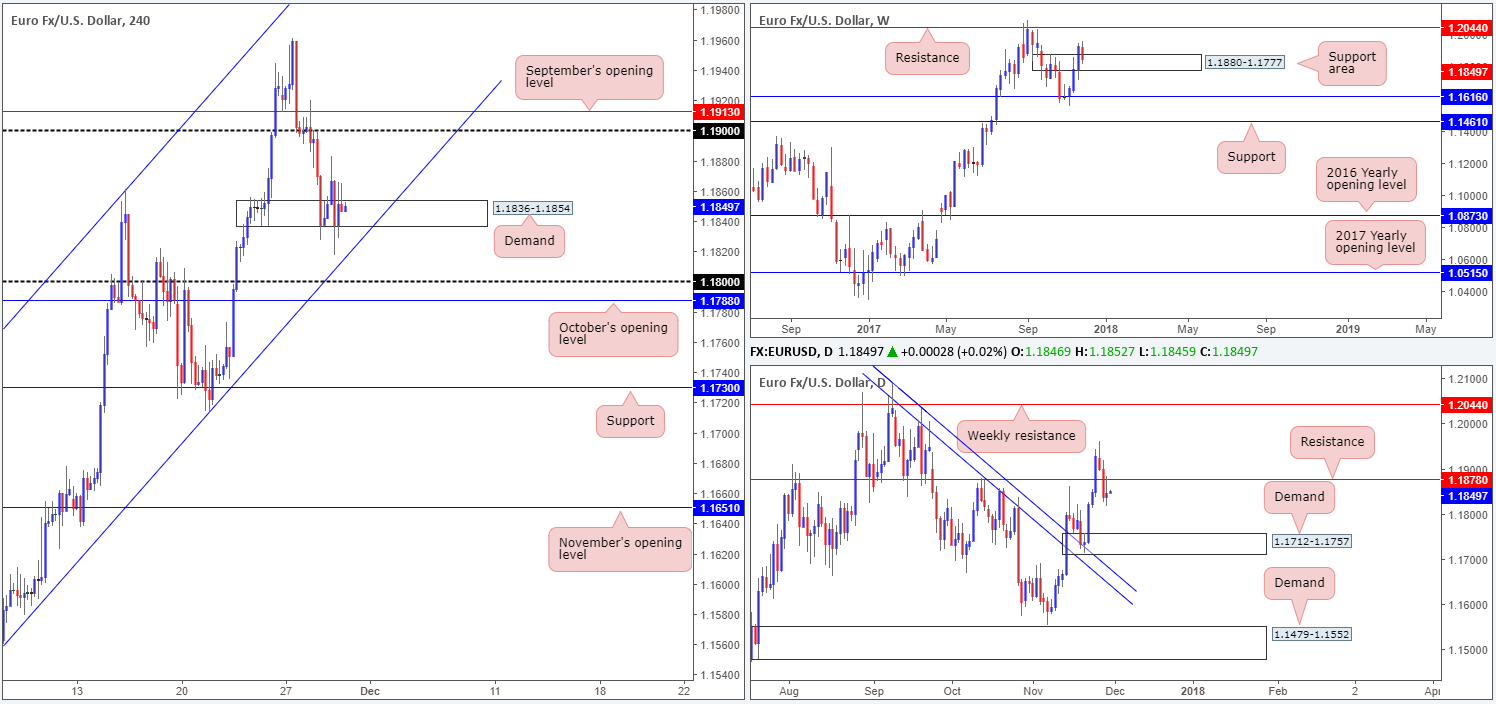
Following Tuesday’s whipsaw below H4 demand at 1.1836-1.1854, follow-though buying brought the unit to a session high of 1.1882 going into Wednesday’s London segment. The H4 candles then felt the need to rip through the lower edge of the H4 demand once again, this time missing the H4 channel support taken from the low 1.1553 by a hair, before stabilizing into the close. This downside pressure looks to be the work of the daily support-turned resistance at 1.1878, which, as you can see, was retested during Wednesday’s session. As a result of this, we believe the aforementioned H4 channel support will eventually be brought into the picture today. There’s a good chance that this H4 line will bounce price, considering that weekly price remains lurking within a weekly support area coming in at 1.1880-1.1777. However, there are still some concerns here.
Suggestions: While the H4 channel support is likely on the radar for a lot of traders, the 1.18 handle likely is too! For that reason, for those looking to buy the H4 channel support today, be prepared for a possible fakeout!
Aside from the fakeout to 1.18, one also has to bear in mind that the retest of daily resistance mentioned above at 1.1878 could force this market down as far as the daily demand base coming in at 1.1712-1.1757 (positioned directly below the current weekly support area).
From our perspective, neither a long nor short seems attractive right now.
Data points to consider: German retail sales m/m at 7am; EUR CPI flash estimate y/y at 10am; US unemployment claims at 1.30pm; US core PCE index m/m; US Chicago PMI at 2.45pm; FOMC member Quarles speaks at 5.30pm; FOMC member Kaplan speaks at 6pm GMT.
Levels to watch/live orders:
- Buys: Flat (stop loss: N/A).
- Sells: Flat (stop loss: N/A).
GBP/USD:
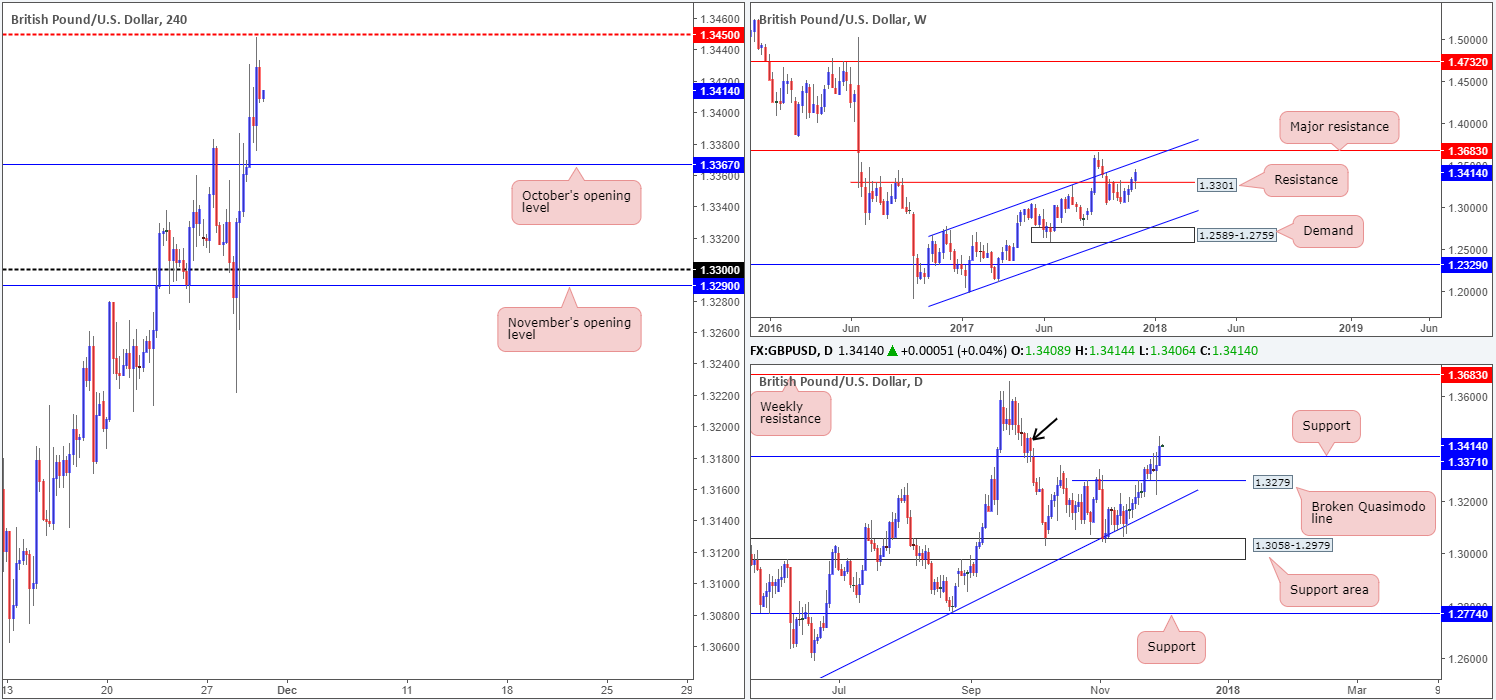
There has been a substantial amount of ‘Brexit’ noise this week, consequently providing support to the GBP/USD. Amid Wednesday’s sessions, October’s opening level seen on the H4 timeframe at 1.3367 was consumed, allowing the H4 candles to advance and top just ahead of the H4 mid-level resistance pegged at 1.3450. Alongside this, daily price recently crossed above daily resistance at 1.3371. Although this is considered a bullish signal, it might be worth noting that to the left of current price there is also a reasonably nice-looking daily supply marked with a black arrow at 1.3456-1.3384. Weekly price on the other hand, looks poised to attack the weekly channel resistance line extended from the high 1.2673, after recently cracking through weekly resistance coming in at 1.3301.
Suggestions:
Long: Difficult, despite weekly price suggesting an advance. Besides the H4 mid-level resistance at 1.3450, there’s also the daily supply mentioned above at 1.3456-1.3384 to contend with.
Short: Also tricky. Weekly price shows room to advance, plus we now have a nearby daily resistance-turned support in view at 1.3371.
Data points to consider: US unemployment claims at 1.30pm; US core PCE index m/m; US Chicago PMI at 2.45pm; FOMC member Quarles speaks at 5.30pm; FOMC member Kaplan speaks at 6pm GMT.
Levels to watch/live orders:
- Buys: Flat (stop loss: N/A).
- Sells: Flat (stop loss: N/A).
AUD/USD:
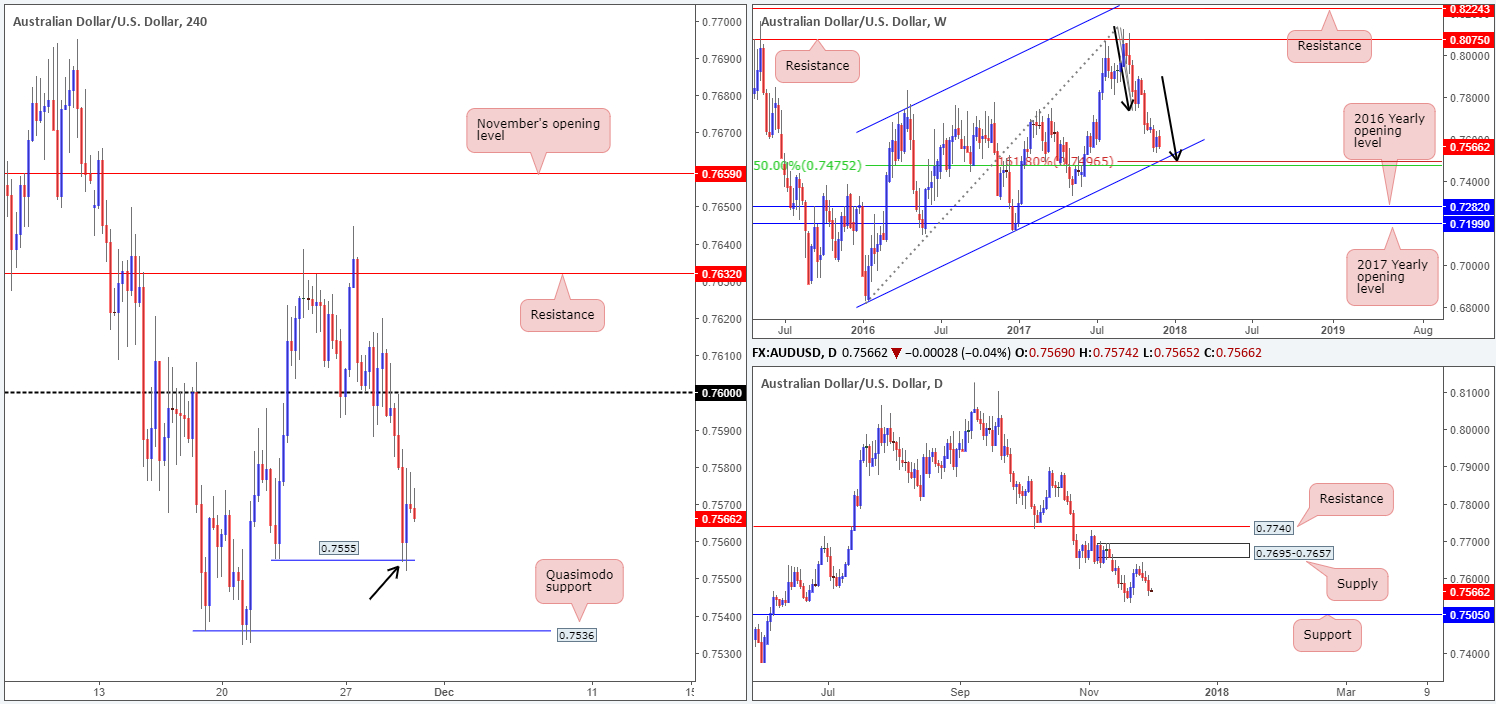
Kicking this morning’s report off with a quick look at the weekly timeframe, we can see that weekly price looks poised to attack a nice-looking weekly AB=CD (see black arrows) 161.8% Fib ext. point at 0.7496. Not only does this line merge with a weekly 50.0% value at 0.7475 taken from the high 0.8125, it’s also bolstered by a weekly channel support extended from the low 0.6827.
Down on the daily picture, the market has been busy painting red candles since the week’s opening. The next downside target on the daily scale can be seen at 0.7532: 21/11/17 low, followed closely by daily support fixed at 0.7505.
Looking across to the H4 timeframe, H4 price came within a few pips of retesting the underside of the 0.76 handle on Wednesday, before aggressively pressing lower. The move, as you can see, managed to marginally whipsaw through local H4 support at 0.7555 (see black arrow). As far as we’re concerned, this was sufficient enough to wipe out buyers and trap breakout sellers to clear the path south down to the H4 Quasimodo support planted at 0.7536.
Suggestions: Although the H4 Quasimodo support at 0.7536 may bounce price, it is not a level we’d trade. This is largely due to the 0.75 handle (not seen on the chart) boasting so much confluence and, therefore, likely to be the better buy zone. Just to recap, 0.75 boasts not only the aforementioned weekly structures; it also merges with a daily support mentioned above at 0.7505.
On account of the above, we will, dependent on the time of day (news), be looking to buy 0.75, with stops positioned 50-70 pips below. This should provide the trade enough breathing room, as this could potentially be a long-term trade with great risk/reward.
Data points to consider: AUD private capital expenditure q/q and building approvals m/m at 12.30am; Chinese manufacturing PMI at 1am; US unemployment claims at 1.30pm; US core PCE index m/m; US Chicago PMI at 2.45pm; FOMC member Quarles speaks at 5.30pm; FOMC member Kaplan speaks at 6pm GMT.
Levels to watch/live orders:
- Buys: 0.75 region (50-70 pip stop loss).
- Sells: Flat (stop loss: N/A).
USD/JPY:
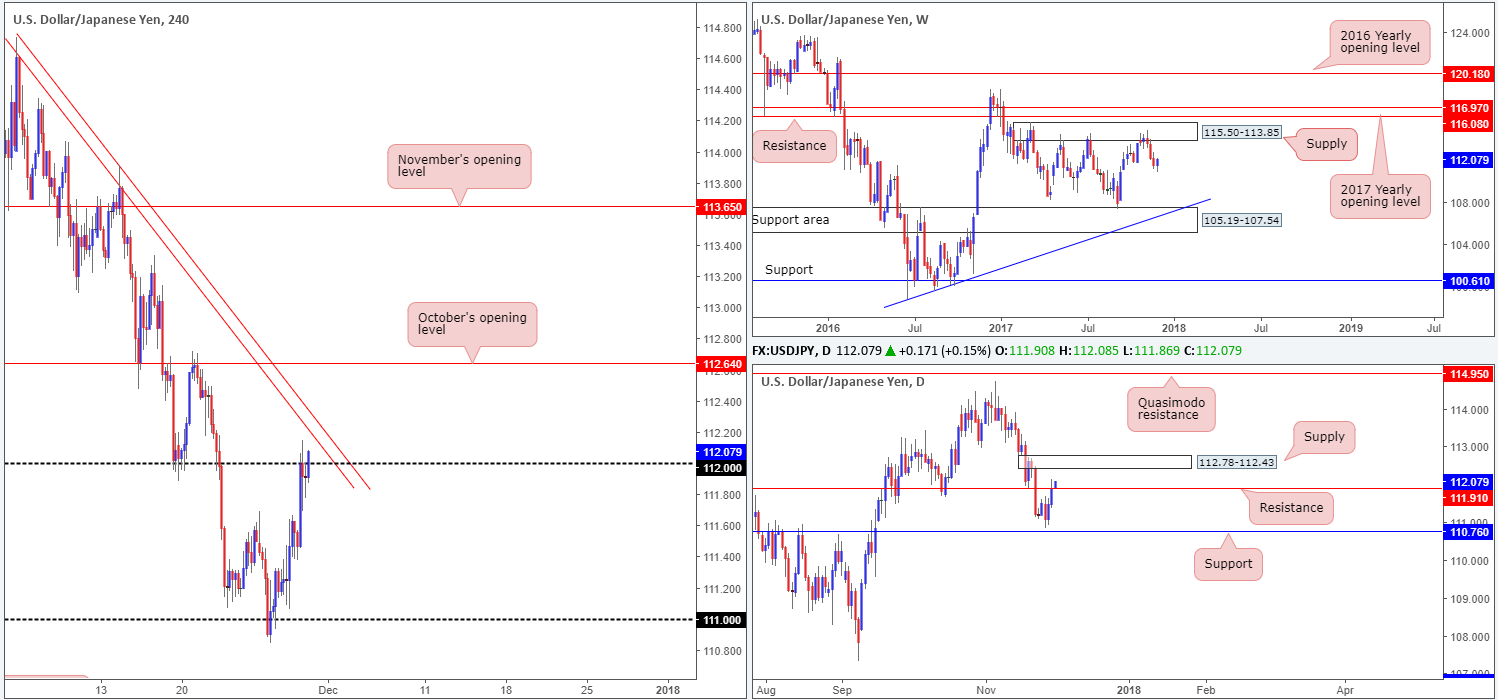
The USD/JPY remains capped beneath the 112 handle, after the pair extended Tuesday’s gains during yesterday’s sessions. As you can see, directly above this number is a cloned H4 trendline resistance taken from the high 114.73. The daily resistance level at 111.91 is, as we write, also under pressure. In the event that the level gives way, it’s likely that daily price will shake hands with daily supply at 112.78-112.43.
Suggestions: We would be very cautious selling 112. This is due to the nearby H4 trendline above it, and the daily supply area likely acting as a magnet to price. As a result of this, we will be laying low today and reassessing structure going into Friday’s open.
Data points to consider: US unemployment claims at 1.30pm; US core PCE index m/m; US Chicago PMI at 2.45pm; FOMC member Quarles speaks at 5.30pm; FOMC member Kaplan speaks at 6pm GMT.
Levels to watch/live orders:
- Buys: Flat (stop loss: N/A).
- Sells: Flat (stop loss: N/A).
USD/CAD:
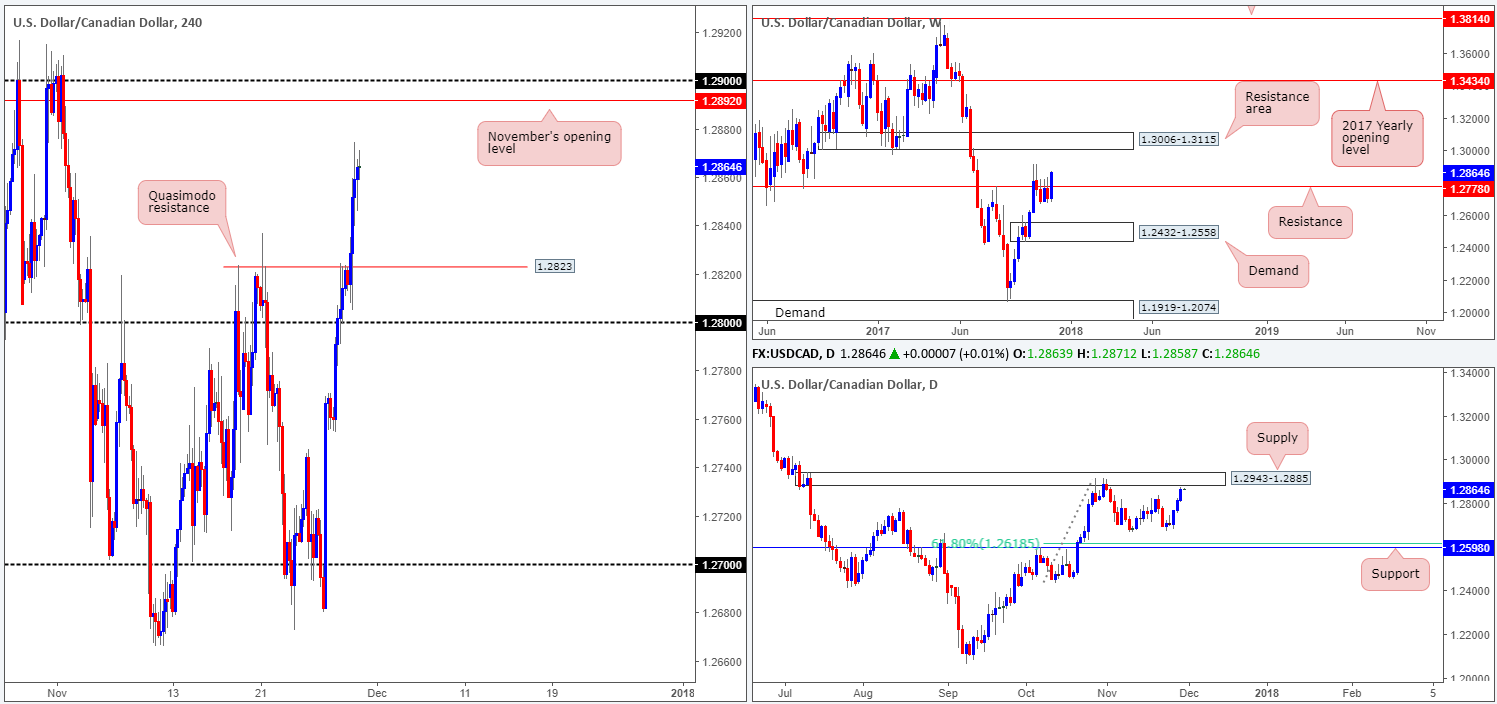
With oil prices softening on Wednesday, the USD/CAD pair managed to pop higher for a third consecutive day. The move, as can be seen on the H4 timeframe, cracked through offers around the H4 Quasimodo resistance at 1.2823, reaching a high of 1.2874 on the day. While on the H4 timeframe, upside shows a clear path to November’s opening level at 1.2892, followed closely by the 1.29 handle, traders may want to note that on the daily timeframe a supply zone at 1.2943-1.2885 is seen within striking distance. Looking up to the weekly timeframe, however, weekly resistance at 1.2778 is suffering at the moment. A sustained move above this hurdle will likely place the weekly resistance area at 1.3006-1.3115 in the firing range.
Buying this market at current prices is not advised. Firstly, we have absolutely no clear support on the H4 timeframe. Secondly, a long would have you buying into a daily supply!
Selling from 1.29/1.2892 could be an option given that these H4 levels are located within the walls of the noted daily supply area, thus providing conservative traders a nice location for a stop-loss order (above supply).
Suggestions: Selling 1.29/1.2892 has the backing of a daily supply, but is a trade we feel is against the overall weekly flow at the moment. Nevertheless, we feel it is still worthy of a trade as the bounce from the area will likely provide enough to at least cover your risk.
Data points to consider: US unemployment claims at 1.30pm; US core PCE index m/m; US Chicago PMI at 2.45pm; FOMC member Quarles speaks at 5.30pm; FOMC member Kaplan speaks at 6pm; CAD current account at 1.30pm GMT.
Levels to watch/live orders:
- Buys: Flat (stop loss: N/A).
- Sells: 1.29/1.2892 (stop loss: 1.2945 [above daily supply]).
USD/CHF:
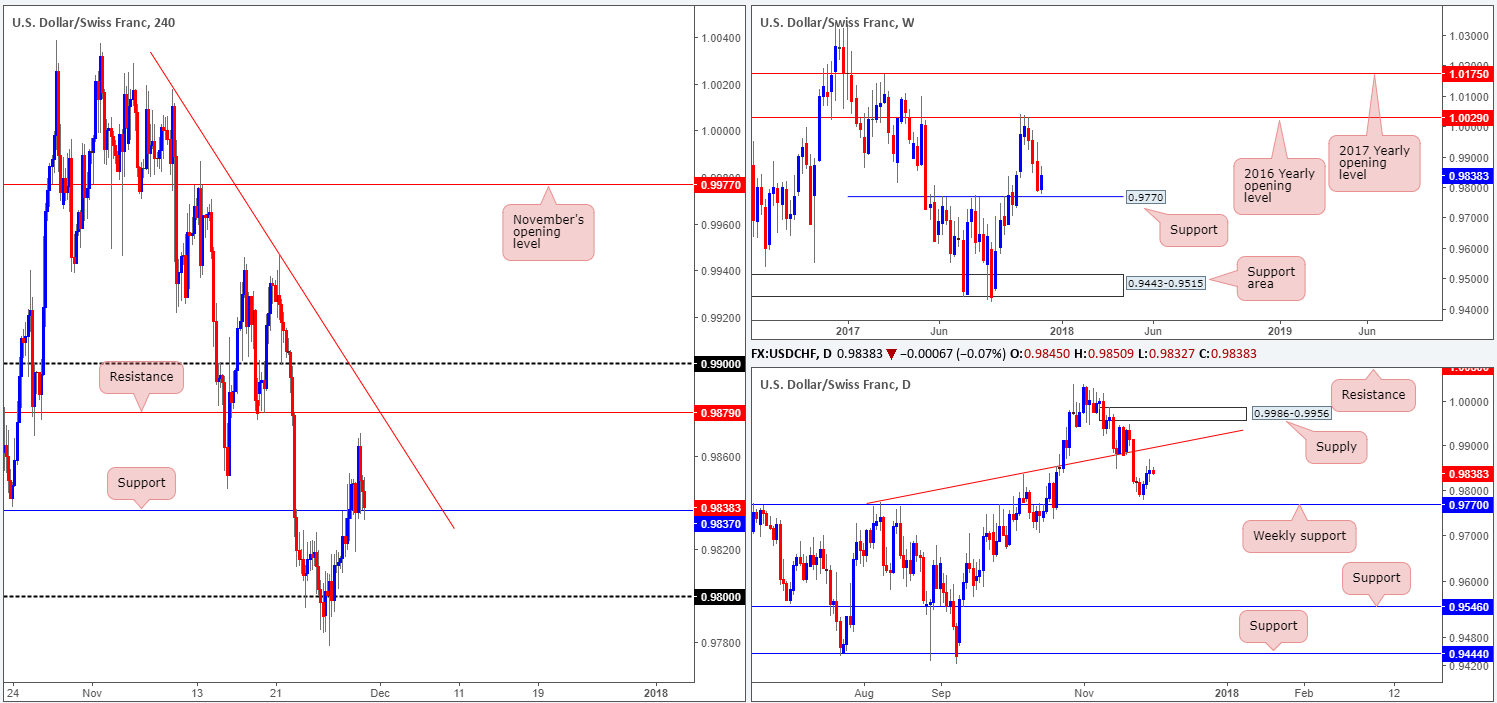
H4 support at 0.9837 managed to hold ground on Wednesday, despite suffering a rather brutal whipsaw to lows of 0.9818 amid the London open. On the assumption that the bulls maintain this defense, the H4 candles may challenge a H4 resistance level seen at 0.9879 (unites with a H4 trendline resistance taken from the high 1.0017).
On the daily timeframe, the next upside target does not come onto the radar until we reach the trendline resistance extended from the high 0.9773. Looking up to the weekly timeframe, however, it’s worth noting that weekly price came within a few pips of connecting with a distinct weekly support at 0.9770 earlier this week, before punching higher.
Suggestions: Seeing as how the market is essentially unchanged this morning, the team remain watching for a lower-timeframe buy signal to form off the current H4 support (for ideas on how to locate such a signal please see the top of this report). Assuming that a trade comes to fruition here, the first take-profit target can be seen around the H4 resistance mentioned above at 0.9879.
Data points to consider: US unemployment claims at 1.30pm; US core PCE index m/m; US Chicago PMI at 2.45pm; FOMC member Quarles speaks at 5.30pm; FOMC member Kaplan speaks at 6pm; CHF KOF economic barometer at 8am GMT.
Levels to watch/live orders:
- Buys: 0.9837 region (waiting for a lower-timeframe buy signal to form is advised] stop loss: dependent on where one confirms this level).
- Sells: Flat (stop loss: N/A).
DOW 30:
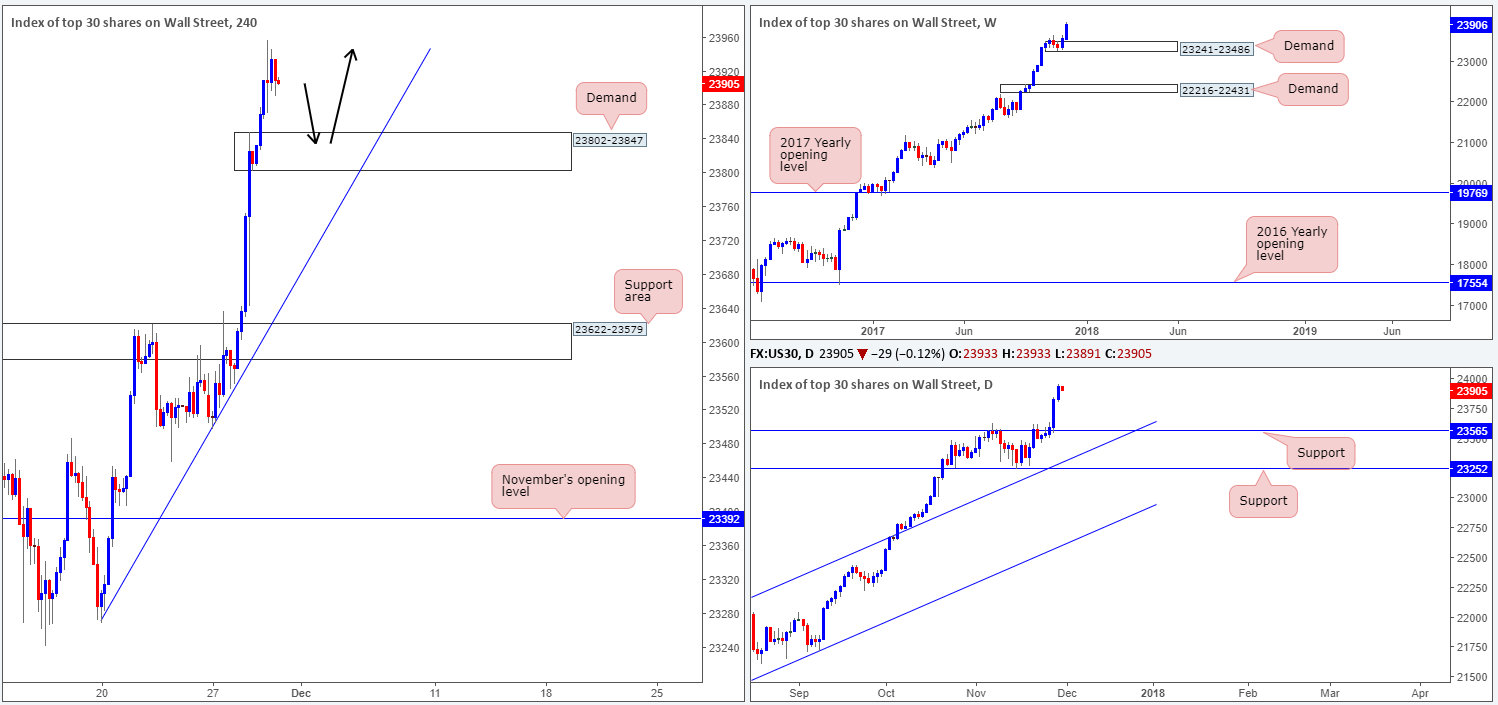
The US equity index managed to extend recent gains on Wednesday, reaching highs of 23956. Financial shares supported the DOW’s recent advance, as did real US GDP growth. What this upside move also accomplished, other than recording fresh record highs, was forming a nice-looking H4 demand base to work with at 23802-23847. This area not only formed within a strong underlying trend, it also boasts strong momentum from the base and is fresh (has not been tested yet and did not form from a break of anything to the left).
Suggestions: As the current H4 demand base has little surrounding H4 confluence, this area will only be considered valid upon seeing a reasonably sized H4 bull candle form from the zone, preferably a full or near-full-bodied candle. This will show buyer intent and help prevent an unnecessary loss.
Data points to consider: US unemployment claims at 1.30pm; US core PCE index m/m; US Chicago PMI at 2.45pm; FOMC member Quarles speaks at 5.30pm; FOMC member Kaplan speaks at 6pm GMT.
Levels to watch/live orders:
- Buys: 23802-23847 ([waiting for a reasonably sized H4 bullish candle to form – preferably a full or near-full-bodied candle – is advised] stop loss: ideally beyond the candle’s tail).
- Sells: Flat (stop loss: N/A).
GOLD:
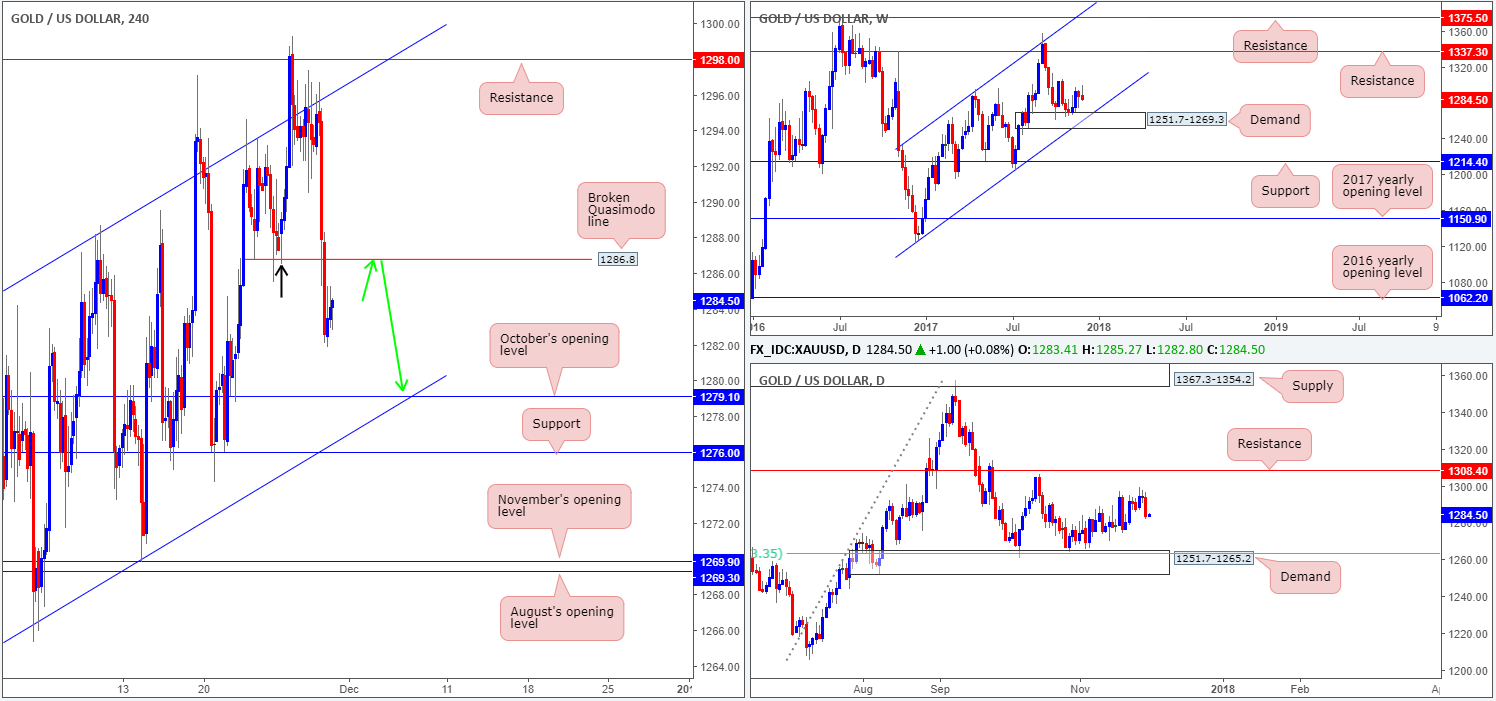
The yellow metal came under pressure in early US hours on Wednesday, outmuscling bulls around the H4 Quasimodo support at 1286.8 and tapping a session low of 1281.8. In Yesterday’s report we highlighted that the aforesaid H4 Quasimodo may be fragile, due to the H4 candle tail marked with a black arrow at 1286.5. We noted that it’s possible that this candle’s tail consumed the majority of unfilled buy orders here before taking off north. In this case, our analysis proved to be correct.
As the H4 Quasimodo line suffered a clean break, however, there may very well be unfilled sell orders remaining. Be that as it may, the only grumble we have from selling this line on any retest seen is that the level has little confluence, both on the H4 timeframe and on the higher timeframes.
Suggestions: A short from 1286.8 would only be considered tradable should a reasonably sized full or near-full-bodied bearish H4 candle form. Of course, this will not guarantee a winning trade, but what it will do is show that there are indeed unfilled sellers in this vicinity, and therefore, increase the odds of a winning trade. The first take-profit target, assuming that a trade comes to fruition, would be set around October’s opening level seen on the H4 timeframe at 1279.1.
Levels to watch/live orders:
- Buys: Flat (stop loss: N/A).
- Sells: 1286.8 region ([waiting for a reasonably sized H4 bearish candle to form – preferably a full or near-full-bodied candle – is advised] stop loss: ideally beyond the candle’s wick).


