Waiting for lower timeframe confirmation is our main tool to confirm strength within higher timeframe zones, and has really been the key to our trading success. It takes a little time to understand the subtle nuances, however, as each trade is never the same, but once you master the rhythm so to speak, you will be saved from countless unnecessary losing trades. The following is a list of what we look for:
- A break/retest of supply or demand dependent on which way you’re trading.
- A trendline break/retest.
- Buying/selling tails/wicks – essentially we look for a cluster of very obvious spikes off of lower timeframe support and resistance levels within the higher timeframe zone.
We typically search for lower-timeframe confirmation between the M15 and H1 timeframes, since most of our higher-timeframe areas begin with the H4. Stops are usually placed 1-3 pips beyond confirming structures.
EUR/USD:
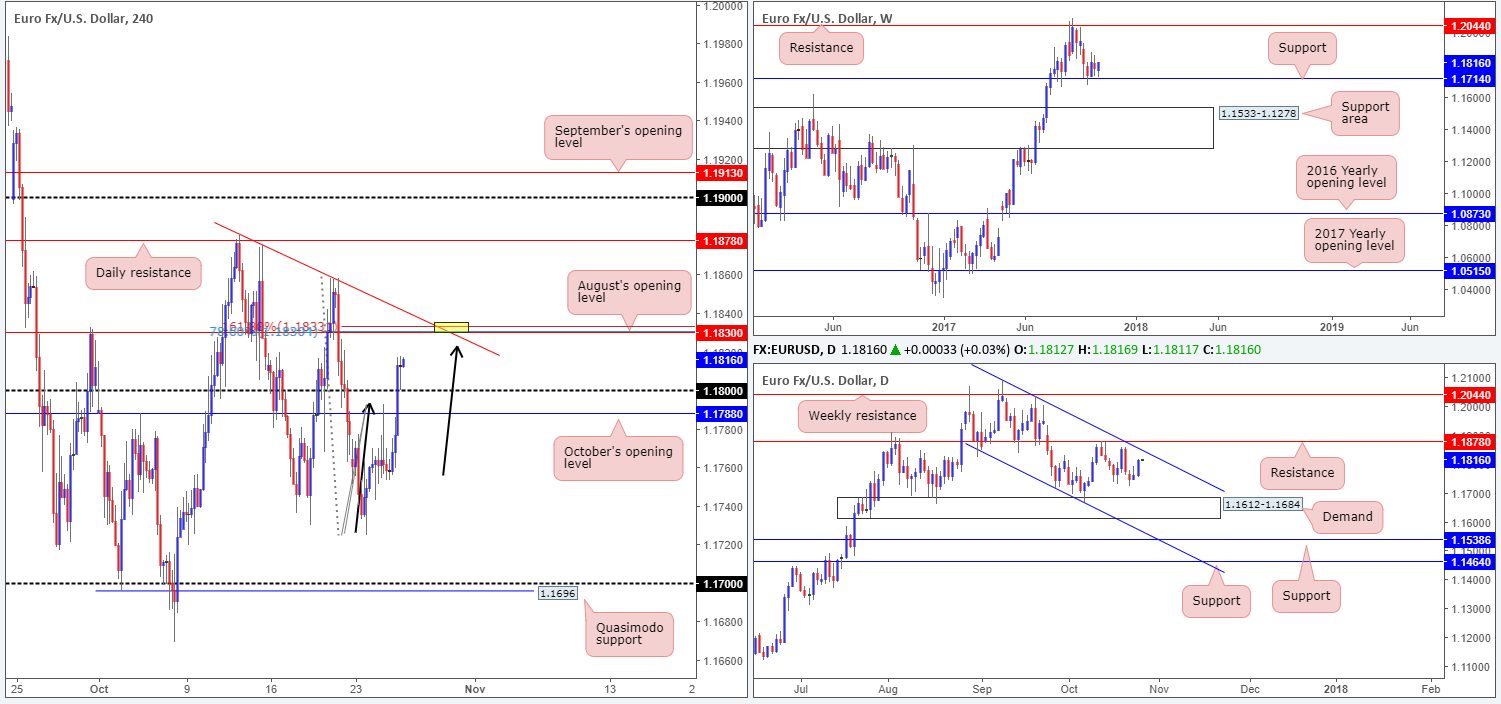
The euro made considerable ground against its US counterpart on Wednesday, despite US durable goods and new home sales figures reporting better-than-expected numbers. H4 price broke through both October’s opening level at 1.1788 and the 1.18 handle, with the pair now looking poised to challenge August’s opening level coming in at 1.1830.
1.1830, as you can probably see on the H4 chart, is an appealing line. Besides merging nicely with a trendline resistance extended from the high 1.1880, it boasts a 78.6% Fib resistance and an AB=CD (black arrows) 161.8% Fib ext. at 1.1833. In addition to this, there’s also a nearby channel resistance seen on the daily timeframe etched from the high 1.2092. The only grumble we have here is the weekly timeframe seen hovering above support at 1.1714.
Suggestions: Should H4 price connect with the yellow marker sometime today, our team would look to short at 1.1830 (stops planted 20 pips higher), targeting 1.18 as an initial take-profit target. Yes, this may be a risky move considering where price is positioned on the weekly timeframe, but we feel the confluence surrounding August’s opening line will at least bounce price back down to the 1.18 neighborhood.
Data points to consider: Spanish unemployment rate at 8am; EUR M3 money supply y/y at 9am; EUR minimum bid rate at 12.45pm; ECB press conference at 1.30pm; US unemployment claims at 1.30pm; US pending home sales m/m at 3pm GMT+1.
Levels to watch/live orders:
- Buys: Flat (stop loss: N/A).
- Sells: 1.1830 (stop loss: 1.1850).
GBP/USD:
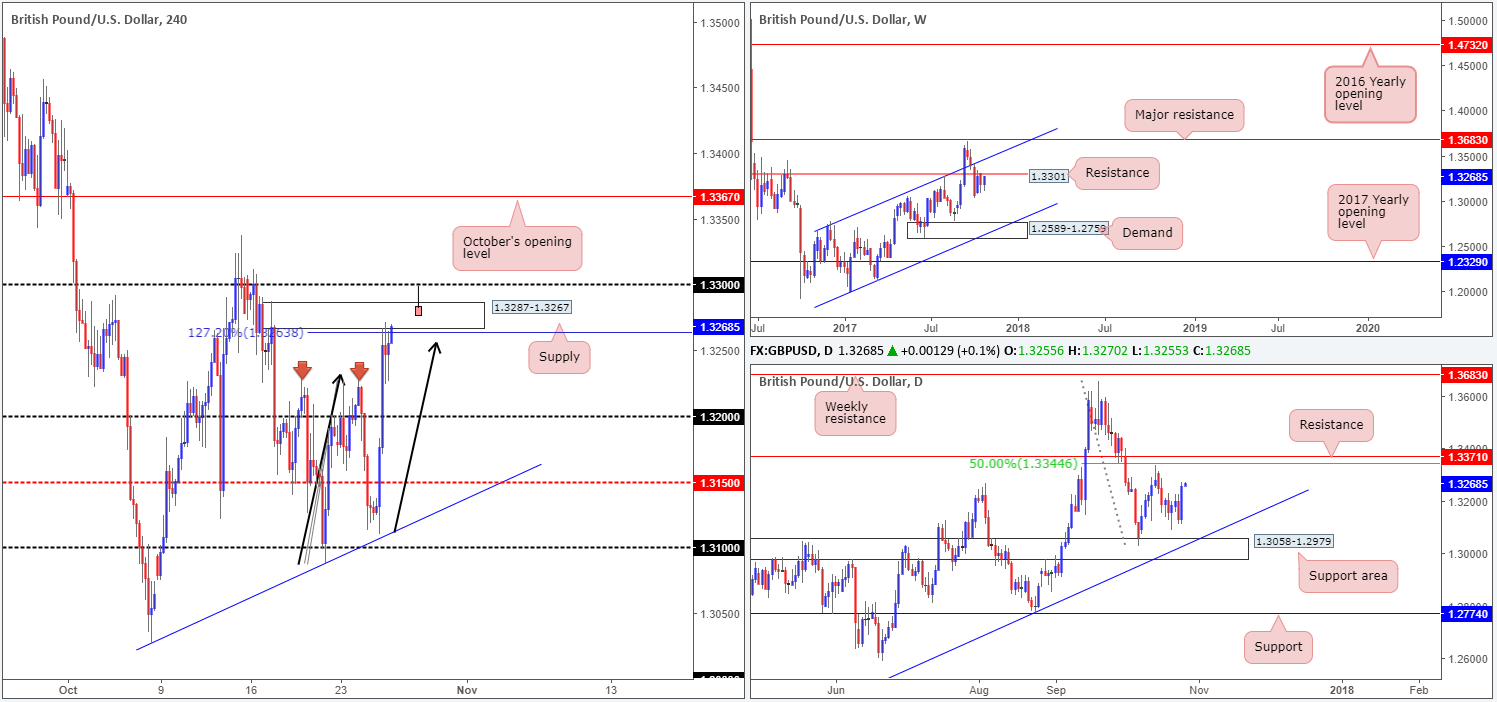
The impact of Wednesday’s better-than-expected UK Q3 GDP figures, as you can see, drove prices skyward. The H4 mid-level resistance 1.3150 and 1.32 handle were both submerged, clearing the path north for H4 price to shake hands with supply at 1.3287-1.3267 into the close. As you can probably see, this supply also boasts an AB=CD 127.2% extension at 1.3253, and has, so far, done a good job of holding back the buyers.
For those considering a short at the noted H4 supply base, it might be worth noting that a fakeout above this area into 1.33 is highly likely. Why? Well, not only are the stops above the current supply attractive for traders with deep pockets as this provides liquidity to short, but 1.33 also represents weekly resistance plotted at 1.3301! Traders who do not adopt a multi-timeframe approach will not see this.
Suggestions: An ideal scenario today would be a H4 selling wick piercing through the top edge of the current H4 supply into active sellers around 1.33 (see H4 chart for a visual example). This, in our technical opinion, would be enough to warrant a sell on the close of this candle, targeting 1.3225/1.32.
Data points to consider: US unemployment claims at 1.30pm; US pending home sales m/m at 3pm GMT+1.
Levels to watch/live orders:
- Buys: Flat (stop loss: N/A).
- Sells: 1.33 region ([waiting for a H4 selling wick to form is advised] stop loss: ideally beyond the candle’s wick).
AUD/USD:
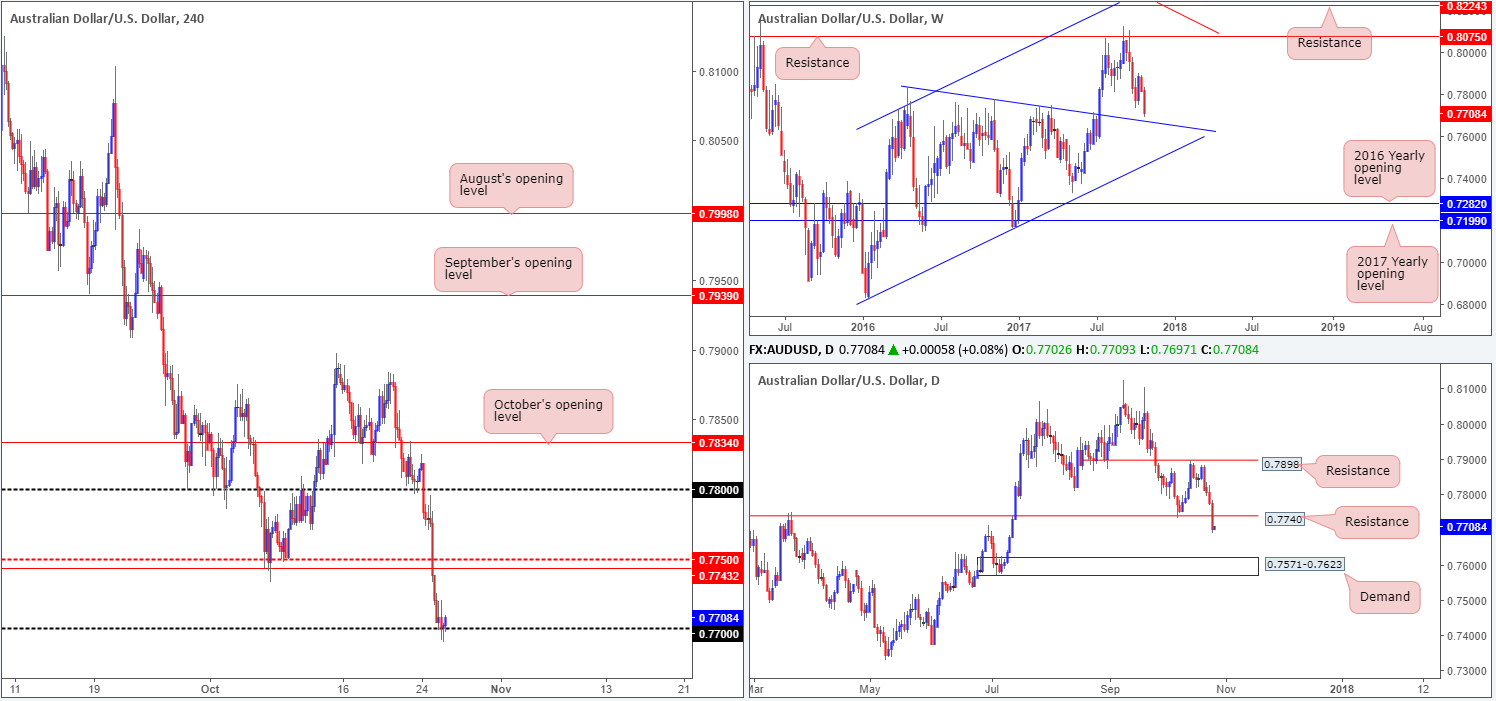
Less-than-stellar Aussie inflation figures sparked an aggressive run to the downside in the early hours of Wednesday’s segment. Further losses were seen going into London, consequently transporting the H4 candles down to the 0.77 handle, which, as you can see, held firm throughout the remainder of the day.
Whether or not 0.77 can bounce prices back up to 0.7743 (a broken Quasimodo line that’s positioned nearby mid-level resistance 0.7750 and daily resistance at 0.7740) is difficult to judge at this point. We say this simply because weekly price shows room to extend losses down to a trendline support etched from the high 0.7835, along with daily price also showing space to punch down to demand pegged at 0.7571-0.7623.
Suggestions: Should H4 price retest 0.7743, this would be a line we would consider shorting if a full or near-full-bodied bearish candle took shape. In the event that 0.77 fails to hold, nevertheless, the next downside target beyond this number can be seen at 0.7632: a H4 support level that’s positioned just ahead of the noted daily demand. Therefore, shorts on any retest of 0.77 could also be an option today.
Data points to consider: RBA Assist Gov. Debelle speaks at 8.45am; US unemployment claims at 1.30pm; US pending home sales m/m at 3pm GMT+1.
Levels to watch/live orders:
- Buys: Flat (stop loss: N/A).
- Sells: 0.7743 region ([waiting for a reasonably sized H4 bearish candle to form – preferably a full or near-full-bodied candle – is advised] stop loss: ideally beyond the candle’s wick). Watch for H4 price to engulf 0.77 and then look to trade any retest of this level seen thereafter ([waiting for a reasonably sized H4 bearish candle to form following the retest – preferably a full or near-full-bodied candle – is advised] stop loss: ideally beyond the candle’s wick).
USD/JPY:
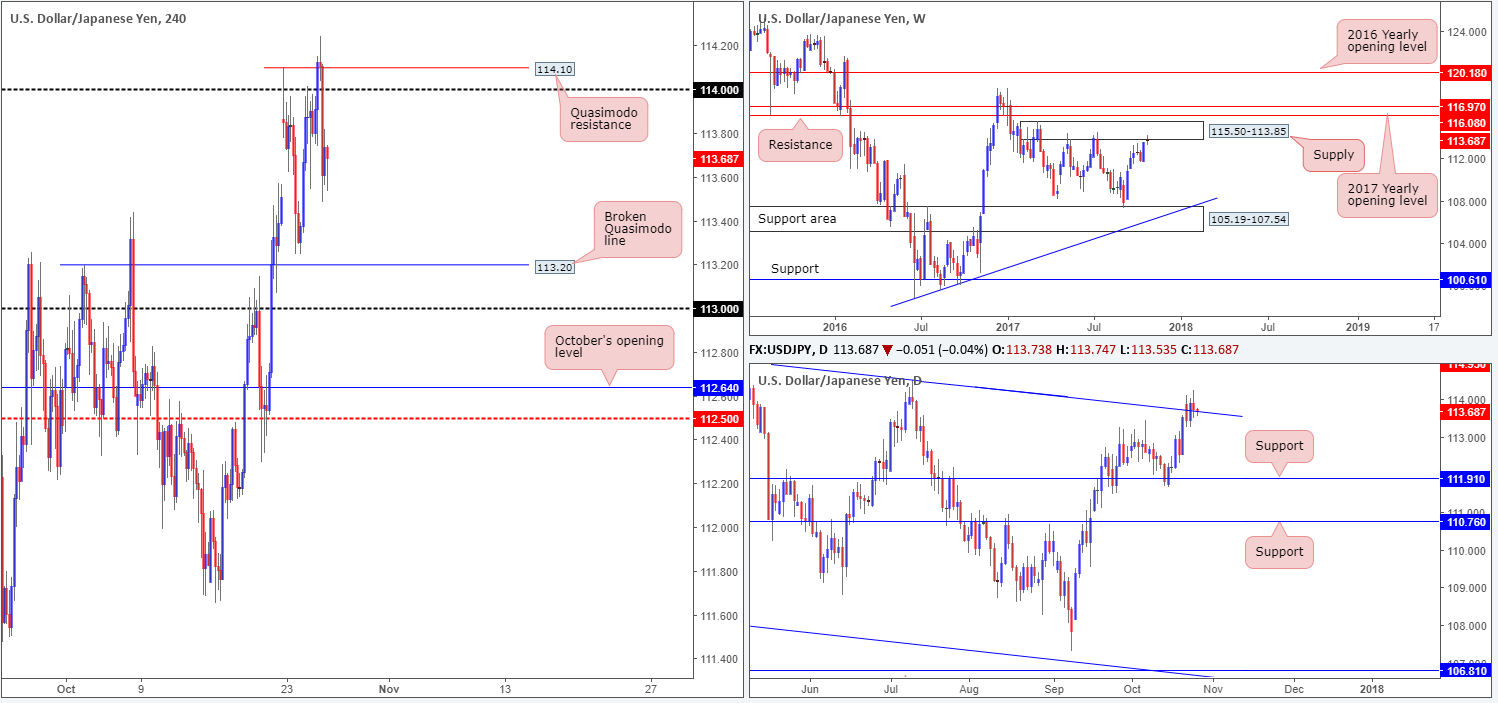
The USD/JPY, as you can see, failed to sustain gains beyond the 114 handle on Wednesday despite upbeat US economic data. The day ended with the unit touching a low of 113.48. According to the H4 scale, further downside is a possibility, at least until we reach the broken Quasimodo line at 113.20.
Looking over to the bigger picture, however, the weekly timeframe is seen kissing the underside of a supply zone at 115.50-113.85, which has held price lower on two separate occasions so far this year. As such, there’s a chance that history may repeat itself here. Daily flow on the other hand, recently closed above a channel resistance taken from the high 115.50, and is now seen retesting the line as support. Should the barrier hold, this potentially opens up the path north to a Quasimodo resistance seen at 114.95.
Suggestions: Right now, the only level that jumps out at us is the 114 handle/H4 Quasimodo resistance at 114.10. However, given the threat of further buying being seen on the daily timeframe, we will only consider this a valid short if a full or near-full-bodied bearish candle took shape.
Data points to consider: US unemployment claims at 1.30pm; US pending home sales m/m at 3pm GMT+1.
Levels to watch/live orders:
- Buys: Flat (stop loss: N/A).
- Sells: 114.10/114 ([waiting for a reasonably sized H4 bearish candle to form – preferably a full or near-full-bodied candle – is advised] stop loss: ideally beyond the candle’s wick).
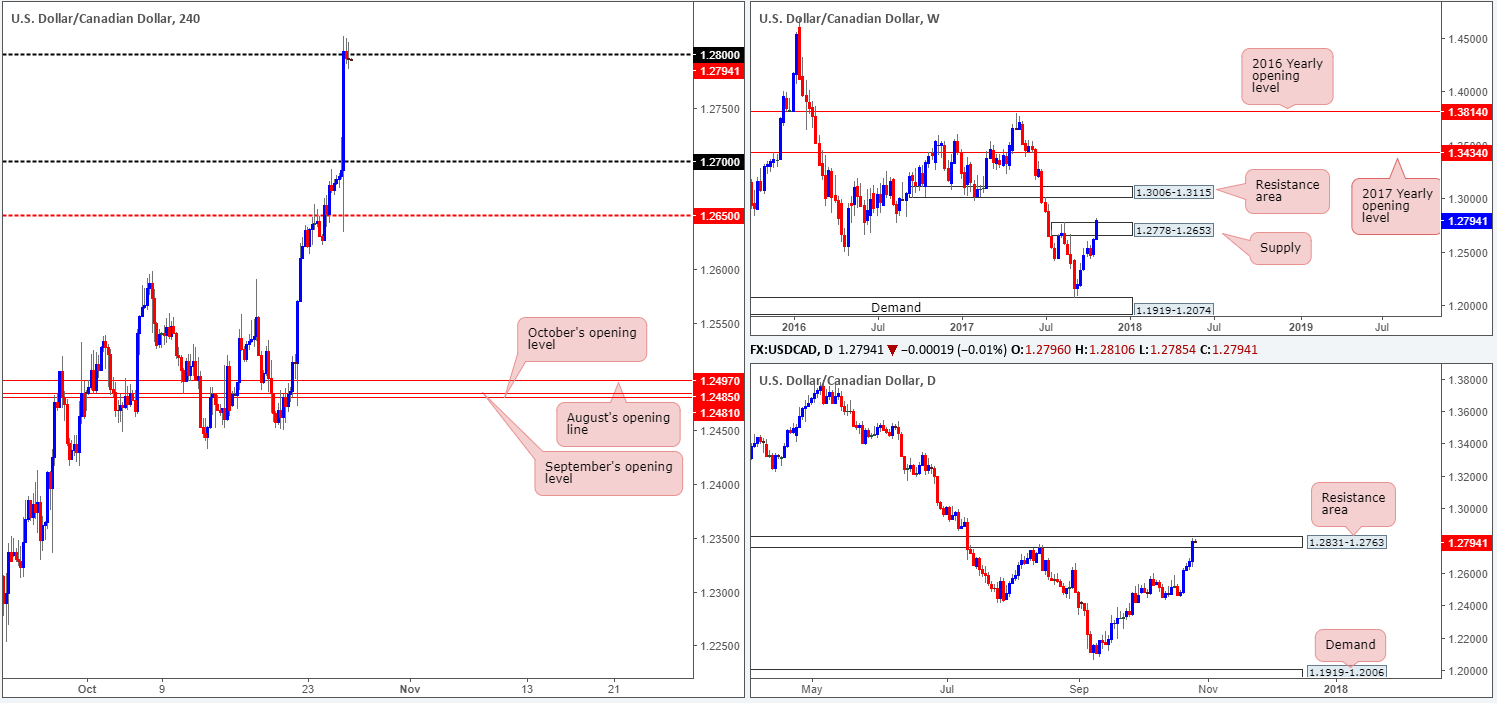
USD/CAD:
USD/CAD spot steadied itself around the 1.28 handle on Wednesday, following a surge of buying pressure after the BoC left interest rates unchanged at 1%. In the event that 1.28 fails to hold ground, the next upside target on the H4 scale can be seen at 1.2860: a resistance level.
What this recent advance also accomplished was bringing in the daily resistance area at 1.2831-1.2763, which happens to boast a reasonably strong history dating back to August 2016. As well as this, we can also see that weekly price is now trading above supply at 1.2778-1.2653, potentially opening the doors for a move up to a resistance area pegged at 1.3006-1.3115.
Suggestions: 1.28 looks vulnerable despite being positioned within a daily resistance area. We think this comes from seeing weekly price testing the waters beyond the current supply! In view of this, we would not feel comfortable taking a position in this market right now.
Data points to consider: US unemployment claims at 1.30pm; US pending home sales m/m at 3pm GMT+1.
Levels to watch/live orders:
- Buys: Flat (stop loss: N/A).
- Sells: Flat (stop loss: N/A).
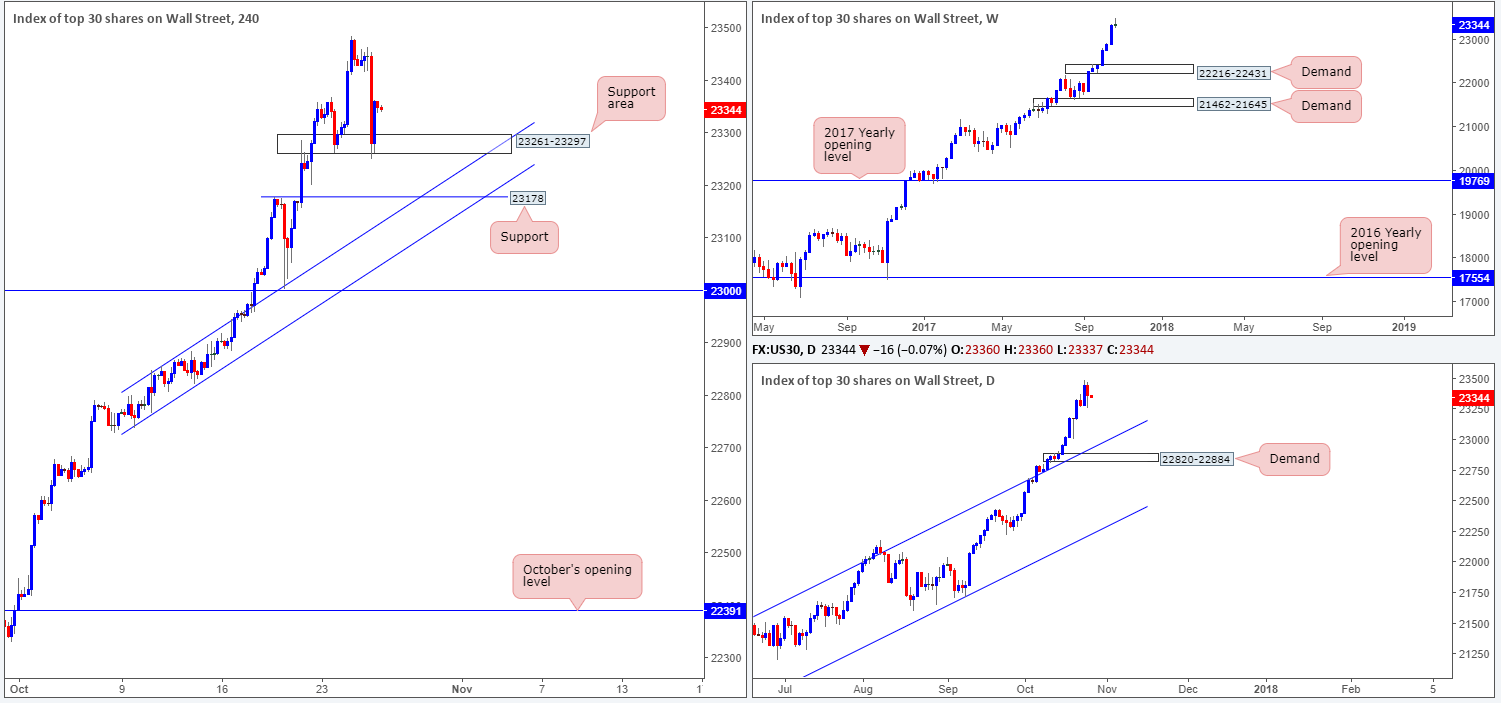
DOW 30:
US stocks ended Wednesday down -0.48% after a batch of soft earnings fueled lower prices. Despite this, the index found a pocket of strong bids at a H4 support area drawn from 23261-23297 going into the closing bell. The reaction seen from here, as you can see from the H4 timeframe, sported a nice-looking near-full-bodied bullish candle. This, given the underlying trend, is, in our opinion, enough to warrant a buy in this market, with stops positioned below the noted support area at 23240.
Suggestions: We entered long at 23356 and have set a stop-loss order at 23240. What we’re looking for here is a push up to fresh highs. This will be our cue to reduce risk to breakeven and begin thinking about taking some profits off the table.
Data points to consider: US unemployment claims at 1.30pm; US pending home sales m/m at 3pm GMT+1.
Levels to watch/live orders:
- Buys: 23356 ([live] stop loss: 23240).
- Sells: Flat (stop loss: N/A).
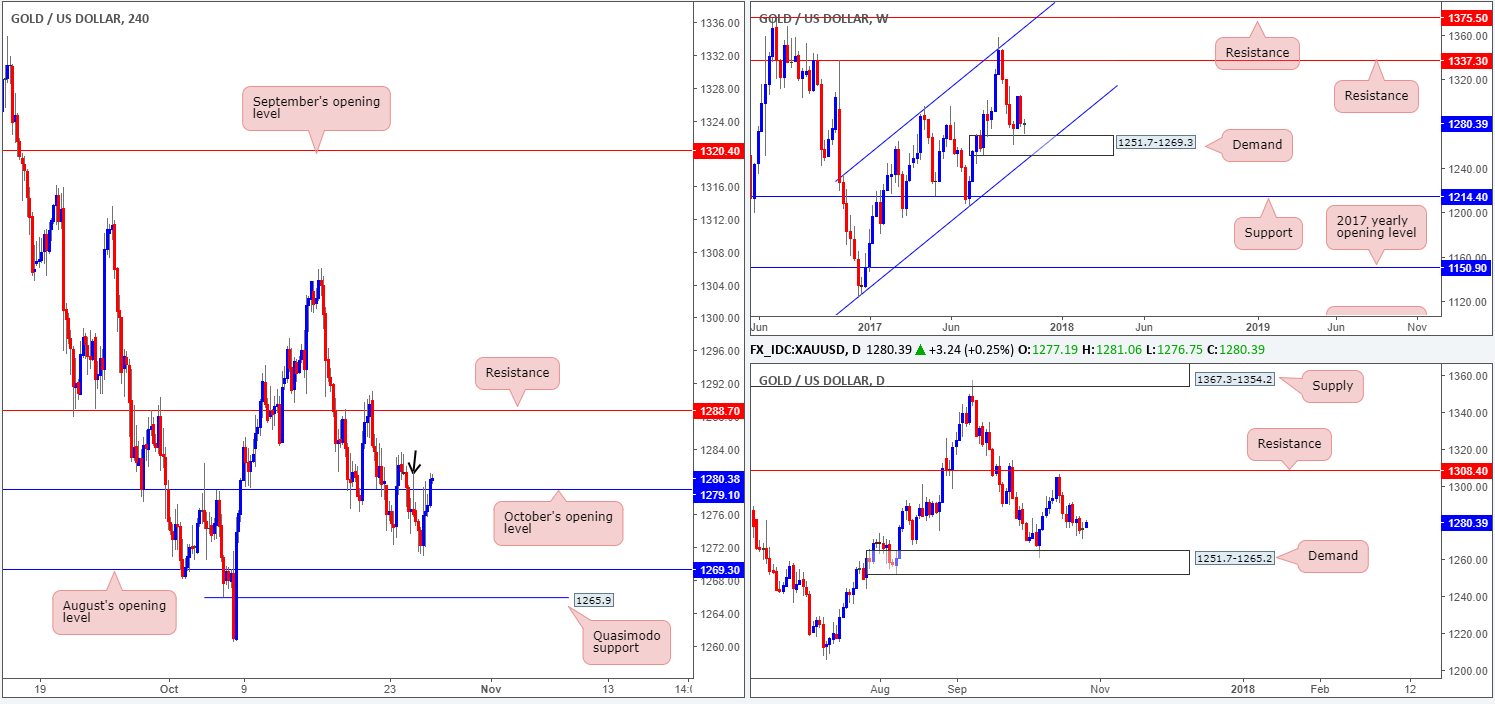
GOLD:
Leaving August’s opening level at 1269.3 unchallenged, the yellow metal advanced higher on Wednesday on the back of dollar weakness. As you can see, H4 price crossed above October’s opening level at 1279.1, possibly clearing the runway north for price to challenge resistance at 1288.7. The reason we believe price could rally up to this point simply comes down to the H4 wick marked with a black arrow at 1281.3 likely already clearing residual offers nearby.
Weekly price, as you can see, recently came within striking distance of connecting with a demand base at 1251.7-1269.3. Daily action on the other hand, shows room to continue extending south, at least until we reach the demand area seen at 1251.7-1265.2 (sited within the lower limits of the said weekly demand).
Suggestions: Provided that the bulls remain in control above 1279.1, a long in this market is an option. A retest of 1279.1, followed up with a reasonably sized H4 bull candle (preferably a full or near-full-bodied bull candle) would, in our view, be enough to trigger a buy order, targeting 1288.7.
Levels to watch/live orders:
- Buys: 1279.1 region ([waiting for a reasonably sized H4 bullish candle to form – preferably a full or near-full-bodied candle – is advised] stop loss: ideally beyond the candle’s tail).
- Sells: Flat (stop loss: N/A).


