A note on lower timeframe confirming price action…
Waiting for lower timeframe confirmation is our main tool to confirm strength within higher timeframe zones, and has really been the key to our trading success. It takes a little time to understand the subtle nuances, however, as each trade is never the same, but once you master the rhythm so to speak, you will be saved from countless unnecessary losing trades. The following is a list of what we look for:
· A break/retest of supply or demand dependent on which way you’re trading.
· A trendline break/retest.
· Buying/selling tails/wicks – essentially we look for a cluster of very obvious spikes off of lower timeframe support and resistance levels within the higher timeframe zone.
· Candlestick patterns. We tend to stick with pin bars and engulfing bars as these have proven to be the most effective.
We search for lower-timeframe confirmation between the M15 and H1 timeframes, since most of our higher-timeframe areas begin with the H4. Stops are usually placed 3-5 pips beyond confirming structures.
EUR/USD:
Since Monday the single currency has been consolidating within a relatively tight range on the H4 chart fixed between 1.0726/1.0762 (yellow area). The latest coming in from the daily chart, however, shows that price came within a pip of retesting the 1.0710 region as support, and for the time being is holding ground against its US counterpart. Meanwhile, up on the weekly chart, the unit recently struck a long-term weekly trendline resistance stretched from the low 0.8231, which, as you can probably see, is shadowed closely by a weekly resistance level drawn in at 1.0819.
Directly above the current H4 range sits a nice-looking H4 sell zone, which comprises of the following: a H4 Quasimodo resistance level at 1.0796, the 1.08 psychological handle, a deep H4 88.6% Fib resistance at 1.0809 and the aforementioned weekly resistance level along with the long-term weekly trendline resistance (green rectangle – H4 chart).
Our suggestions: Owing to the near-retest of daily support at 1.0710 yesterday, our desk feels that the pair may conquer the top edge of the current H4 range today and connect with our above noted H4 sell zone. Dependent on the time of day we would look to enter short at market from here, targeting the nearest H4 demand formed on approach as a first take-profit zone (which for now, looks like it’ll likely be formed around the top edge of the H4 range at 1.0762).
Data points to consider: Eurogroup meetings (all day). US Jobless claims at 1.30pm GMT.

Levels to watch/live orders:
· Buys: Flat (stop loss: N/A).
· Sells: 1.08 region ([dependent on the time of day, this is an area we would consider trading without confirmation] stop loss: 1.0825 [aggressive stop] 1.0875 [conservative stop]).
GBP/USD:
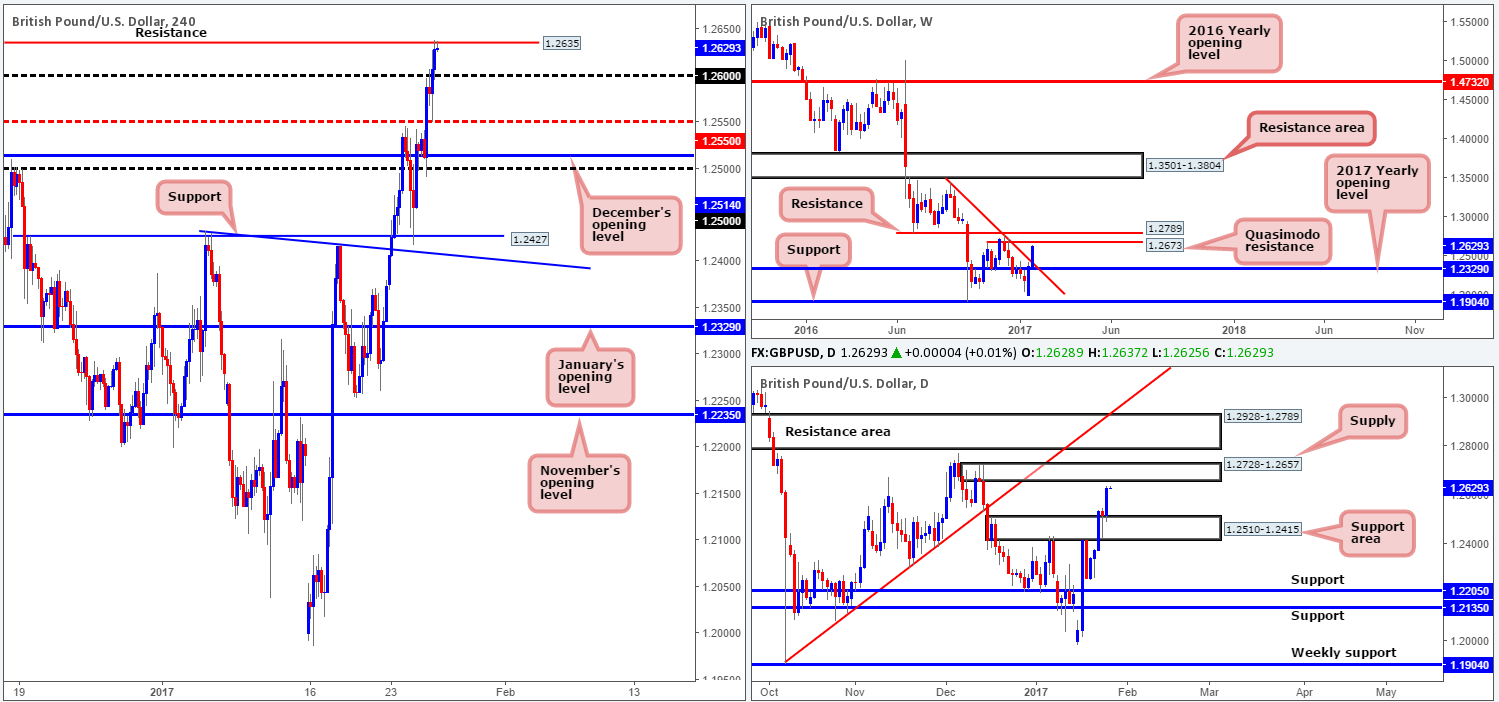
Sterling closed marginally higher against its US rival on Wednesday, consequently printing a near-full-bodied daily bull candle and clocking a high of 1.2638 on the day. With the psychological resistance 1.26 out of the picture, the H4 candles, as you can see, marched north to test a minor H4 resistance coming in at 1.2635. While this level is currently capping upside, the more favorable area is seen a little higher up on the curve around the 1.27 neighborhood. There are a number of technical aspects that support this view. Firstly, 1.27 boasts a H4 Quasimodo resistance level at 1.2699. Secondly, it’s also positioned within daily supply registered at 1.2728-1.2657, and finally traders may also want to note that the H4 base is located only 27 pips from a weekly Quasimodo resistance level planted at 1.2673.
Our suggestions: Based on our analysis above, we’re ultimately suggesting to wait for a H4 candle close above the current H4 resistance line today. Should this come to fruition, the 1.27 level will likely be the next base on the hit list, which, given the confluence stated above, is a beautiful zone to short from. If, like us, you’re planning to sell from here, we’d advise placing stop-loss orders above the apex high of the H4 Quasimodo formation (1.2728), as this will also clear the upper edge of the daily supply zone.
Data points to consider: UK Preliminary GDP (4th quarter) release at 9.30am. US Jobless claims at 1.30pm GMT.
Levels to watch/live orders:
- Buys: Flat (stop loss: N/A).
- Sells: 1.27 region ([dependent on the time of day, this is an area we would consider trading without confirmation] stop loss: 1.2730).
AUD/USD:
Weighed on heavily by disappointing Aussie inflation data yesterday the pair tumbled to lows of 0.7515, tapping a H4 channel support line extended from the low 0.7449. Bolstered by the daily support area at 0.7524-0.7494, the commodity-linked currency switched tracks here and gravitated north going into the London open. Granted, this was an attractive long setup. However, buying from the H4 channel support would place one in close proximity to daily supply coming in at 0.7581-0.7551. And, as already highlighted in previous reports, before our team looks to become buyers, we’d prefer to see a decisive H4 close above both the round number 0.76 and November’s opening level at 0.7606.
Our suggestions: With the above notes in mind, buying is out of the question for our desk at the moment. Regarding shorts, we would also strongly advise against selling for the time being as well. The recent weekly close above weekly supply at 0.7524-0.7450, as well as the daily buyers recently breaching the top edge of the current daily supply is enough evidence, in our opinion, to suggest that the bears are possibly weakening.
In view of the conflicting signals seen from the higher timeframes right now, our team will remain on the sidelines (unless of course we see a H4 close above 0.7606) and reassess going into tomorrow’s open.
Data points to consider: US Jobless claims at 1.30pm GMT.

Levels to watch/live orders:
· Buys: Watch for a H4 close to be seen above 0.7606 and then look to trade any retest seen thereafter ([waiting for a lower-timeframe confirming setup [see the top of this report] to form following the retest is advised prior to pulling the trigger] stop loss: dependent on where one confirms this area).
· Sells: Flat (stop loss: N/A).
USD/JPY:
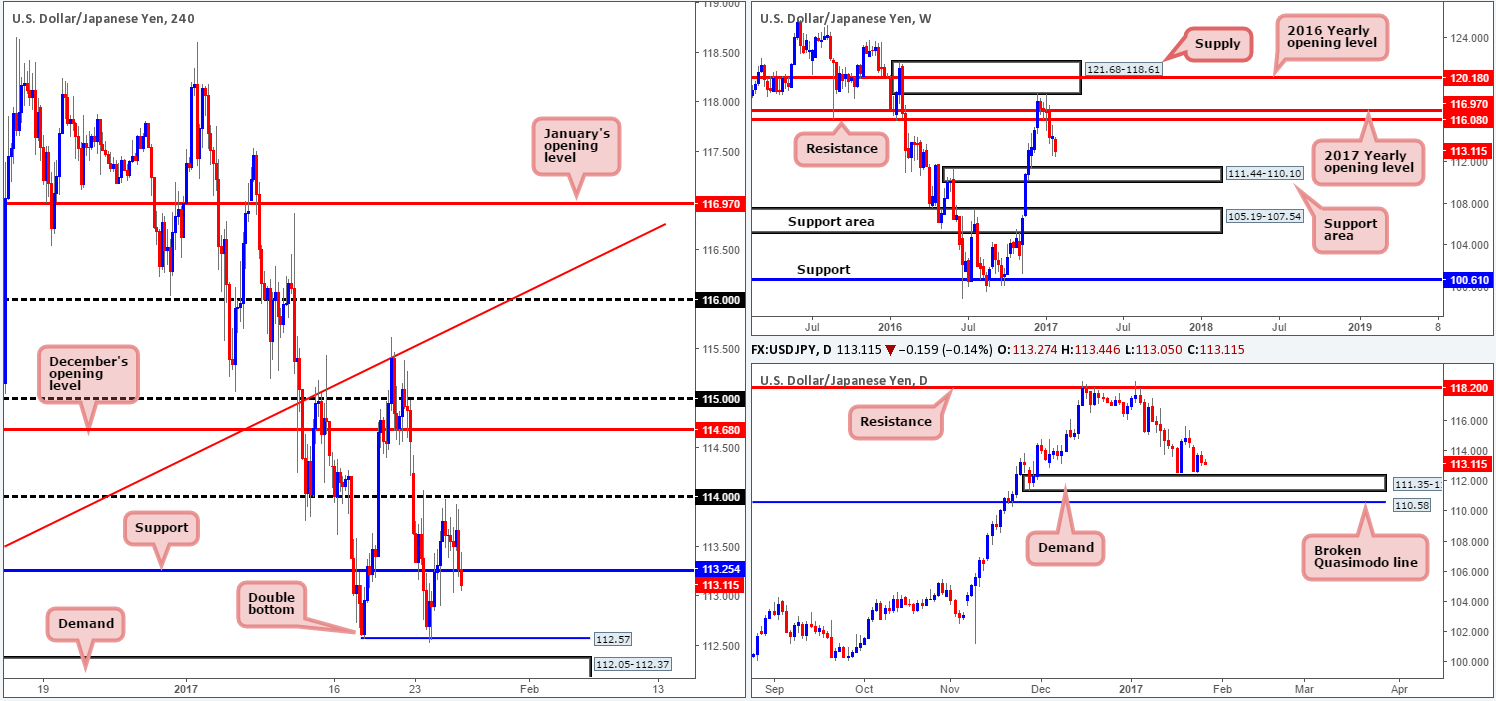
The USD/JPY settled for the day just ahead of a H4 support at 113.25 yesterday, following a modest selloff from just below the 114 level. As we write, H4 price action just breached the above noted H4 support, and looks to be on course to test the H4 double-bottom formation positioned at 112.57, shadowed closely by a H4 demand base coming in at 112.05-112.37. This H4 demand, at least from a technical perspective, is considered an area of value. It’s located around the top edge of a daily demand zone at 111.35-112.37, which itself is bolstered by a weekly support area drawn from 111.44-110.10.
Our suggestions: While there’s a fair chance that price will respond from the H4 demand, traders still need to be prepared for the possibility of a fakeout through this zone, as price may want to drive deeper into the above noted higher-timeframe areas before rallying higher. With that being the case, waiting for at least a H4 bull candle to form may be the better path to take before pressing the buy button.
Data points to consider: US Jobless claims at 1.30pm GMT.
Levels to watch/live orders:
· Buys: 112.05-112.37 ([a reasonably sized H4 bull candle will need to be seen from here before a trade can be executed] stop loss: ideally beyond the trigger candle).
- Sells: Flat (stop loss: N/A).
USD/CAD:
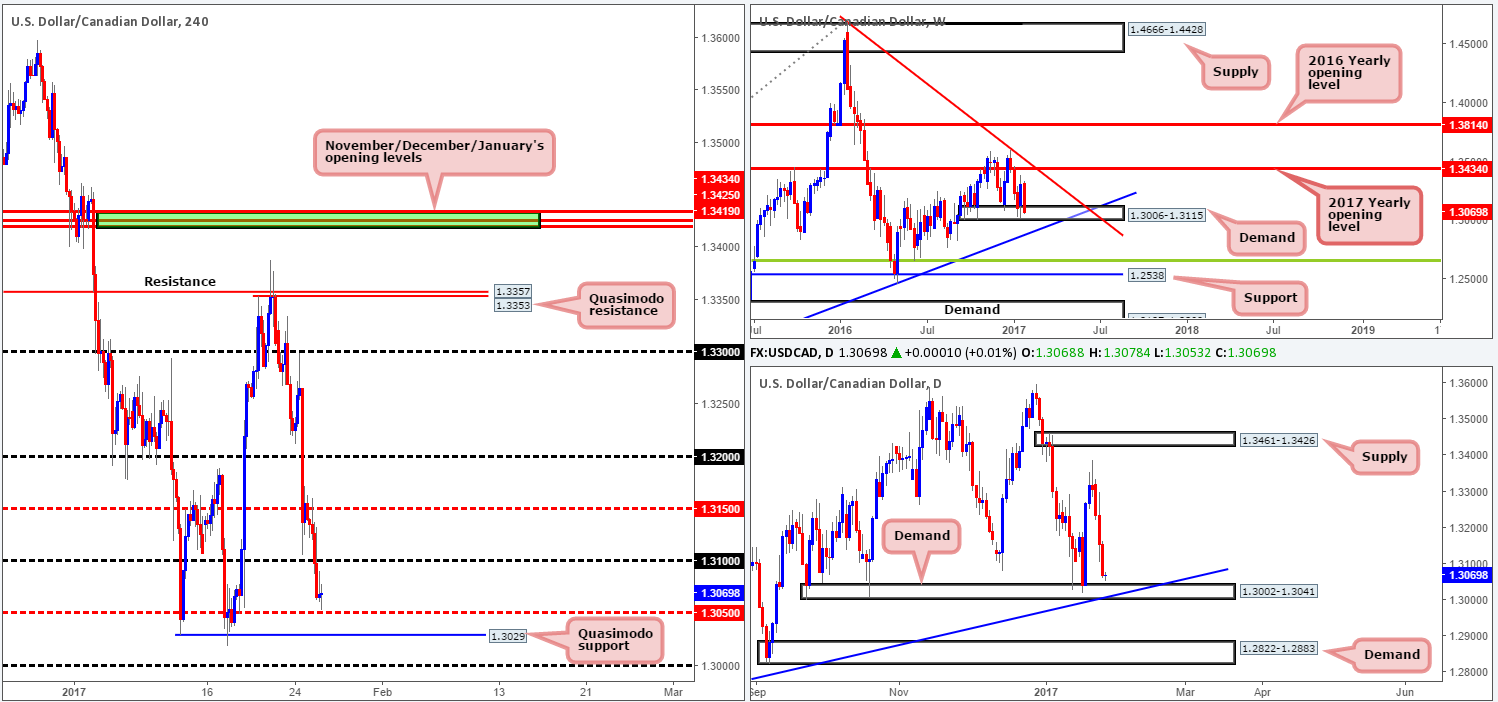
Freshly painted candle action shows that the USD/CAD took another hit to the mid-section yesterday, breaking below the 1.31 psychological handle and closing the day just ahead of the H4 mid-way support at 1.3050. While this recent decline in value marks the fourth consecutive daily close, according to the bigger picture the tables could very well be about to turn. Looking over to the weekly chart, one will be able to see that the pair is currently trading within a weekly demand base visible at 1.3006-1.3115. In conjunction with the weekly timeframe, the daily candles are also seen trading within reaching distance of a daily demand area penciled in at 1.3002-1.3041, which happens to merge beautifully with a daily trendline support taken from the low 1.2654.
Our suggestions: Seen within the two aforementioned higher-timeframe demands is a H4 Quasimodo support at 1.3029. Although this level boasts attractive confluence, we must also take into account that price is nearing the 1.30 mark – a level which is likely watched by the majority of the market. Does this mean we should ignore longs from the H4 Quasimodo formation? No! What it does mean though is that in order to buy from this H4 base, one might (to be on the safe side) want to consider setting stops beyond the 1.30 level since it is located just below both the weekly and daily demands (anyone smelling a possible fakeout here!?!?).
Since we can find no logical area for stop-loss placement beyond 1.30 we’ll wait for H4 candle confirmation, before deciding whether or not to buy from here.
Data points to consider: US Jobless claims at 1.30pm GMT.
Levels to watch/live orders:
- Buys: 1.3029 region ([a reasonably sized H4 bull candle will need to be seen from here before a trade can be executed] stop loss: ideally beyond the trigger candle).
· Sells: Flat (stop loss: N/A).
USD/CHF:
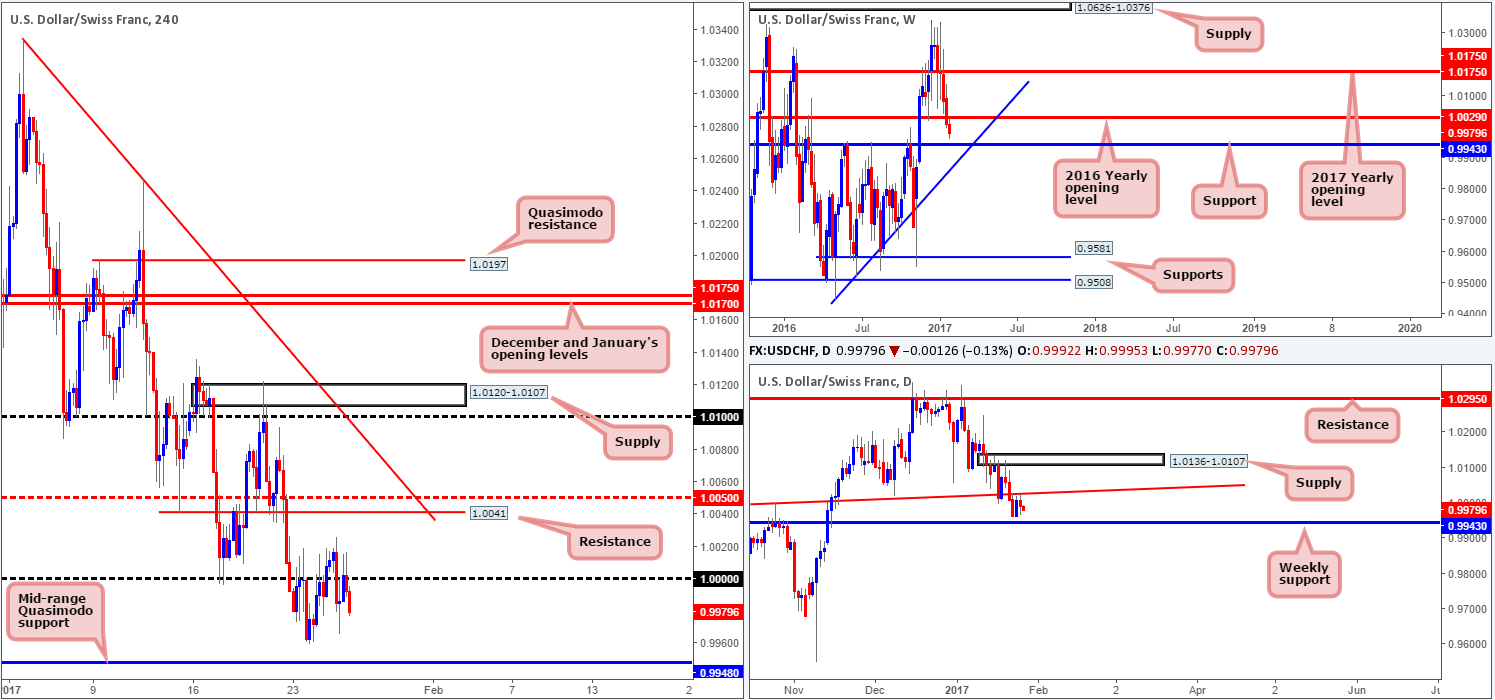
Beginning with the weekly chart this morning, we can see that the bears are currently on course to shake hands with weekly support drawn from 0.9943. The pair is likely to find support from here with it having been a strong barrier of resistance on a number of occasions over the last year. Sliding down into the daily chart, yesterday’s action retested the daily trendline resistance taken from the high 0.9956 for a second time this week. This, similar to the weekly chart, has placed price within reaching distance of the above noted weekly support level.
Looking over to the H4 chart, the bulls attempted to push beyond parity (1.0000) yesterday, but failed after striking highs of 1.0016. As of current price, we see little standing in the way of the unit testing the H4 mid-range Quasimodo support at 0.9948 today. And, owing to this base also being positioned only five pips from the aforementioned weekly support level, a bullish rotation may be on the cards from this region.
Our suggestions: One could look to enter long at this H4 Quasimodo level at market since stops can comfortably be placed beyond the apex low (0.9929) at 0.9927. Right now, the first take-profit target would be set around parity. However, this could change should a H4 supply form on approach.
Data points to consider: US Jobless claims at 1.30pm GMT.
Levels to watch/live orders:
- Buys: 0.9949 ([possible level to look at buying from without the need for additional confirmation] stop loss: 0.9927).
· Sells: Flat (stop loss: N/A).
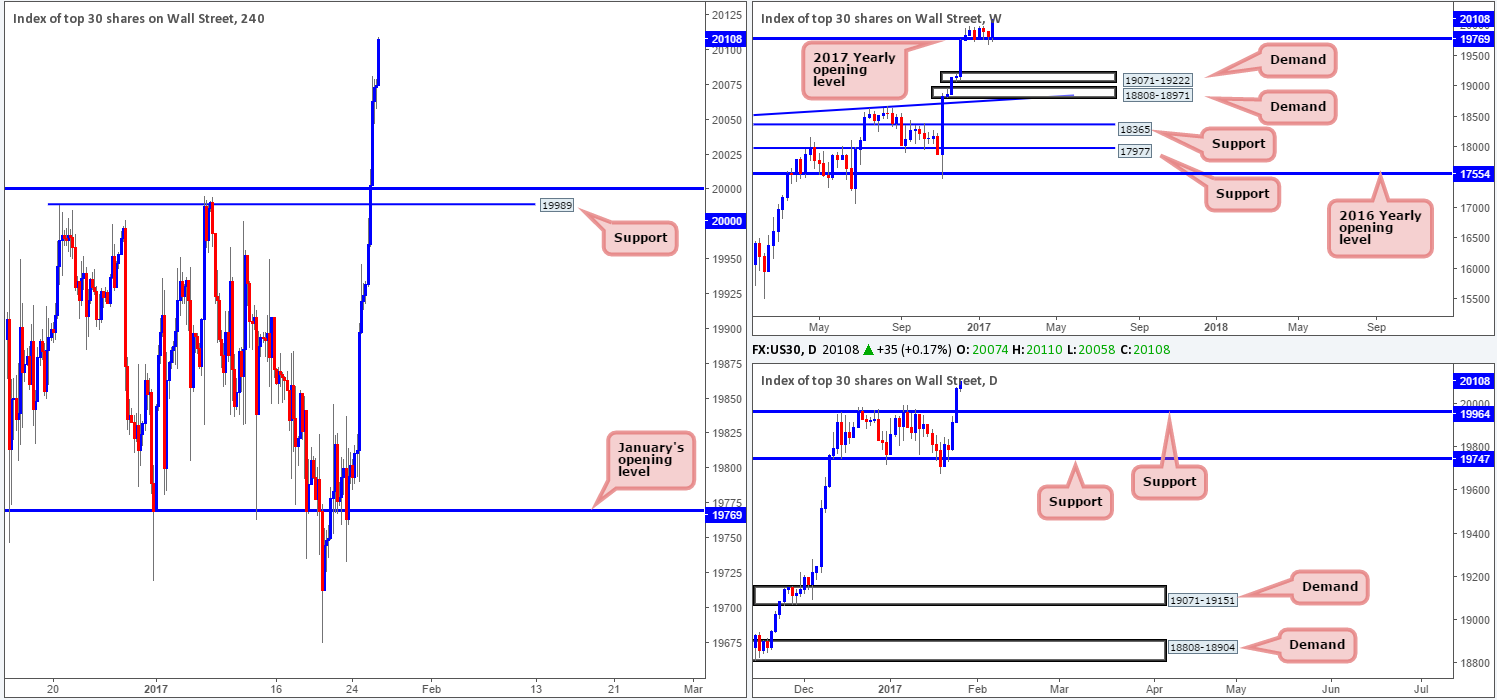
DOW 30:
After spending over a month hovering below the 20000 mark, US equities rose higher yesterday, piercing through this level and clocking a record high of 20082. In view of this, there are absolutely no resistance levels in this market right now. Therefore, to our way of seeing things, the best we can do for the time being is look to ‘buy the dips’. The closest support at the moment, of course, is the 20000 neighborhood, which is reinforced by H4 support at 19989 and a daily support drawn in at 19964.
Our suggestions: As things stand, unless the DOW pulls back to retest 20000 today, we may have to place this piece on the back burner for now.
Data points to consider: US Jobless claims at 1.30pm GMT.
Levels to watch/live orders:
- Buys: Flat (stop loss: N/A).
- Sells: Flat (stop loss: N/A).
GOLD:
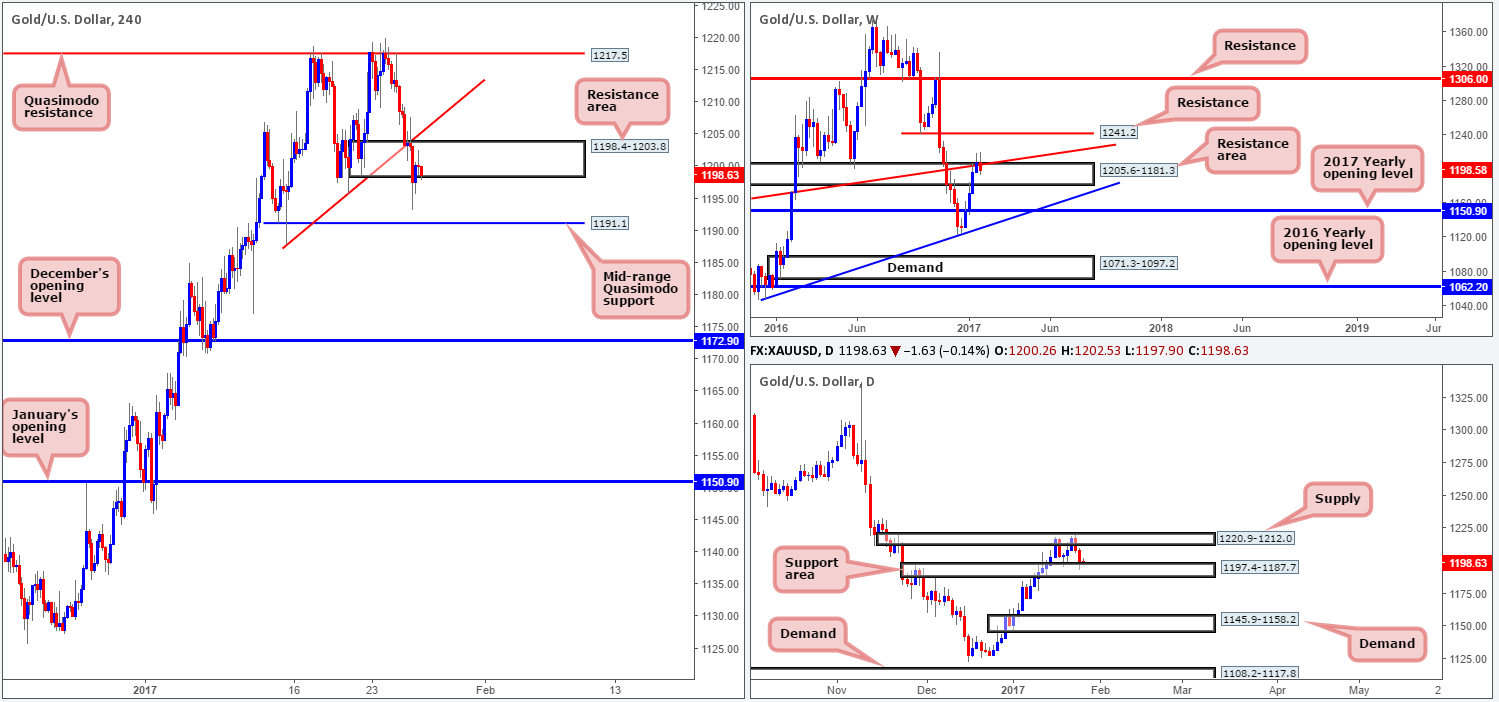
For those who read yesterday’s report you may recall that we highlighted the H4 demand area at 1198.4-1203.8 as a possible place for price to bounce from. As you can see, the market did just that! Our reasoning behind only expecting a bounce came from the bigger picture. Tuesday’s daily bearish engulfing candle that formed within daily supply at 1220.9-1212.0 was, in our opinion, enough to wipe out the H4 area and push price down to the nearby daily support area at 1197.4-1187.7.
In recent hours, the H4 demand has been retested as a resistance area. Should the bears continue to defend this zone, this may set the stage for further selling today and possibly test the H4 mid-range Quasimodo support at 1191.1. Given that this H4 level is housed within the above noted daily support area, a reaction from this angle could be seen. How much of a reaction, nevertheless, is difficult to judge since weekly flow is now seen trading back within the walls of a weekly resistance area at 1205.6-1181.3.
Our suggestions: For traders looking to buy from the aforementioned H4 mid-range Quasimodo support, we would advise waiting for the lower timeframes to prove buyer interest before pulling the trigger. This could be either a break of supply followed by a retest as demand, a trendline break/retest or simply a collection of well-defined buying tails seen positioned around the H4 level. We search for lower-timeframe confirmation between the M15 and H1 timeframes, since most of our higher-timeframe areas begin with the H4. Stops are usually placed 3-5 pips beyond confirming structures.
Levels to watch/live orders:
- Buys: 1191.1 region ([wait for a lower-timeframe confirming setup to form before looking to execute a trade] stop loss: dependent on where one confirms this area).
- Sells: Flat (stop loss: N/A).


