EUR/USD:
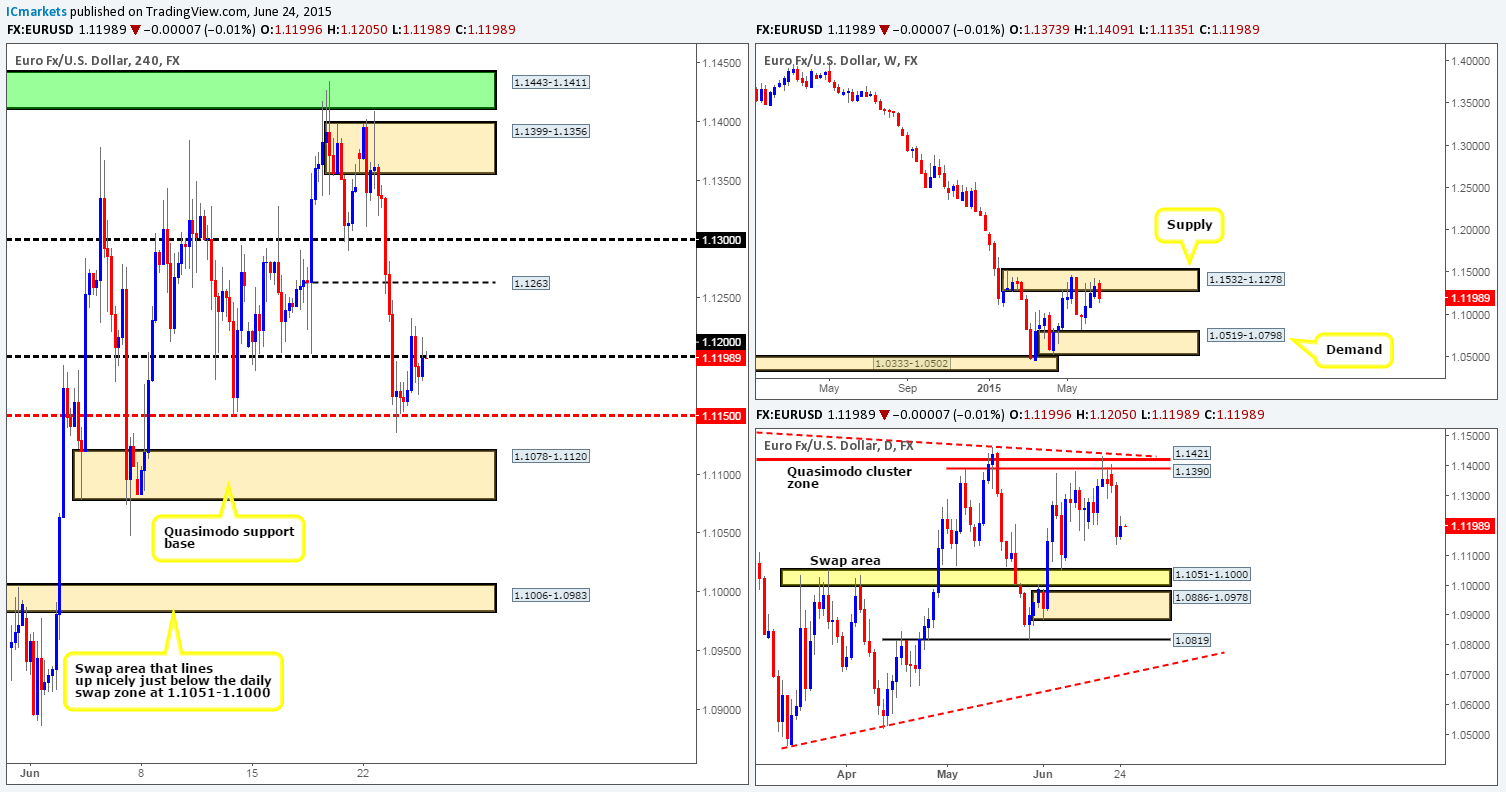
Weekly view: From the weekly timeframe, we can see that price is still being held lower by a weekly supply area coming in at 1.1532-1.1278. This supply zone is a very significant hurdle in our opinion (held price lower since the 11th May) since if there’s a sustained break above this area, our long-term bias (currently short) on this pair will very likely shift north.
Daily view: Following Tuesday’s aggressive sell off, buy-side liquidity held the Euro higher from around the 1.1150 mark. The rebound from here, however, appears weak and will, in our opinion, only spur shorts to keep selling down towards the daily swap area coming in at 1.1051-1.1000.
4hr view: Despite the Greek uncertainty, the EUR/USD managed to find supportive pressure from the mid-level number 1.1150 (as mentioned above) late on Tuesday, which, as you can see, attracted further buying up to the 1.1200 handle during the course of yesterday’s sessions.
From a technical standpoint, the Euro is still in a good position to continue selling off – one only has to look at the weekly and daily timeframes to see this. Therefore, instead of looking to buy the recent momentum, we’re going to stick with our original plan for the time being…
Buy trades will only be considered once/if we see price connect with the 4hr swap area coming in at 1.1006-1.0983, which if you look closely, you’ll see is positioned just below the aforementioned daily swap zone. The 4hr Quasimodo support base at 1.1078-1.1120 seen just below 1.1150 will likely see a bounce, but possibly give way soon after due to little higher timeframe support backing this area.
With regards to sells, nonetheless, our objective is simple. Watch for a convincing push below the 4hr Quasimodo support base at 1.1078-1.1120 (the space for price to move below this zone is very nice), and attempt to trade any retest seen that has corresponding lower timeframe confirming price action. If this trade setup comes to fruition, we’ll look to target the aforementioned 4hr swap area, where at which point our attention will shift to longs.
Levels to watch/live orders:
- Buys: 1.1006-1.0983 [Tentative – confirmation required] (Stop loss: 1.0975).
- Sells: Flat (Stop loss: N/A).
GBP/USD:
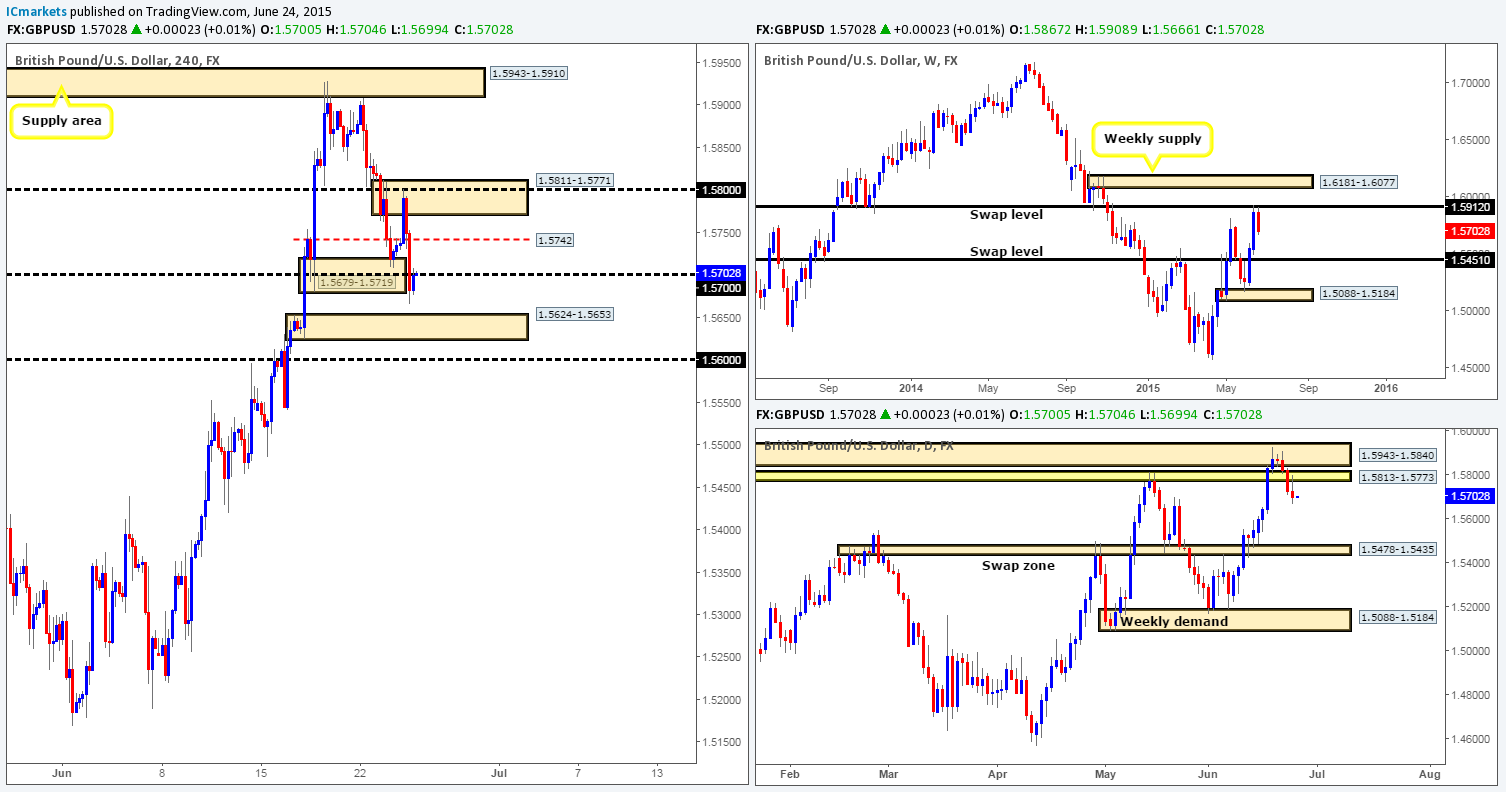
Weekly view – Following the recent two-week advance, selling interest is currently being seen around the underside of a very significant weekly swap level coming in at 1.5912.
Daily view: Yesterday’s daily candle shows that price retested the recently broken daily swap area at 1.5813-1.5773 as resistance, suggesting further selling may be in store.
4hr view: Going into the early hours of the European session, the GBP was heavily bought, forcing price to connect with a combined 4hr supply/round number area at 1.5811-1.5771/1.5800. It was only once we saw the London session get under way did the market begin to decline from here, which as you can see, pushed price below the combined 4hr demand/round number area at 1.5679-1.5719/1.5700.
Considering both the market’s overall position on the higher timeframes at the moment (see above in bold), and the recent spike below the current 4hr demand area (consuming sell stops), the path south is now likely clear for a move down to at least the 4hr demand zone sitting at 1.5624-1.5653. As such, the following levels are going to be closely monitored throughout today’s sessions:
- 1.5700 – the current round number.
- 1.5742 – 4hr Quasimodo resistance level.
- 1.5811-1.5771 – 4hr supply.
We have no plan to set pending sell orders at any of the aforementioned levels, instead we’re going to simply watch how lower timeframe price action behaves at these barriers. Providing we find suitable entry at either area, we’d then look to short, targeting the 4hr demand zone mentioned above at 1.5624-1.5653.
Levels to watch/ live orders:
- Buys: Flat (Stop loss: N/A).
- Sells: 1.5700 [Tentative – confirmation required] (Stop loss: dependent on where one confirms this level) 1.5742 [Tentative – confirmation required] (Stop loss: dependent on where one confirms this level) 1.5811-1.5771 [Tentative – confirmation required] (Stop loss: 1.5818)
AUD/USD:
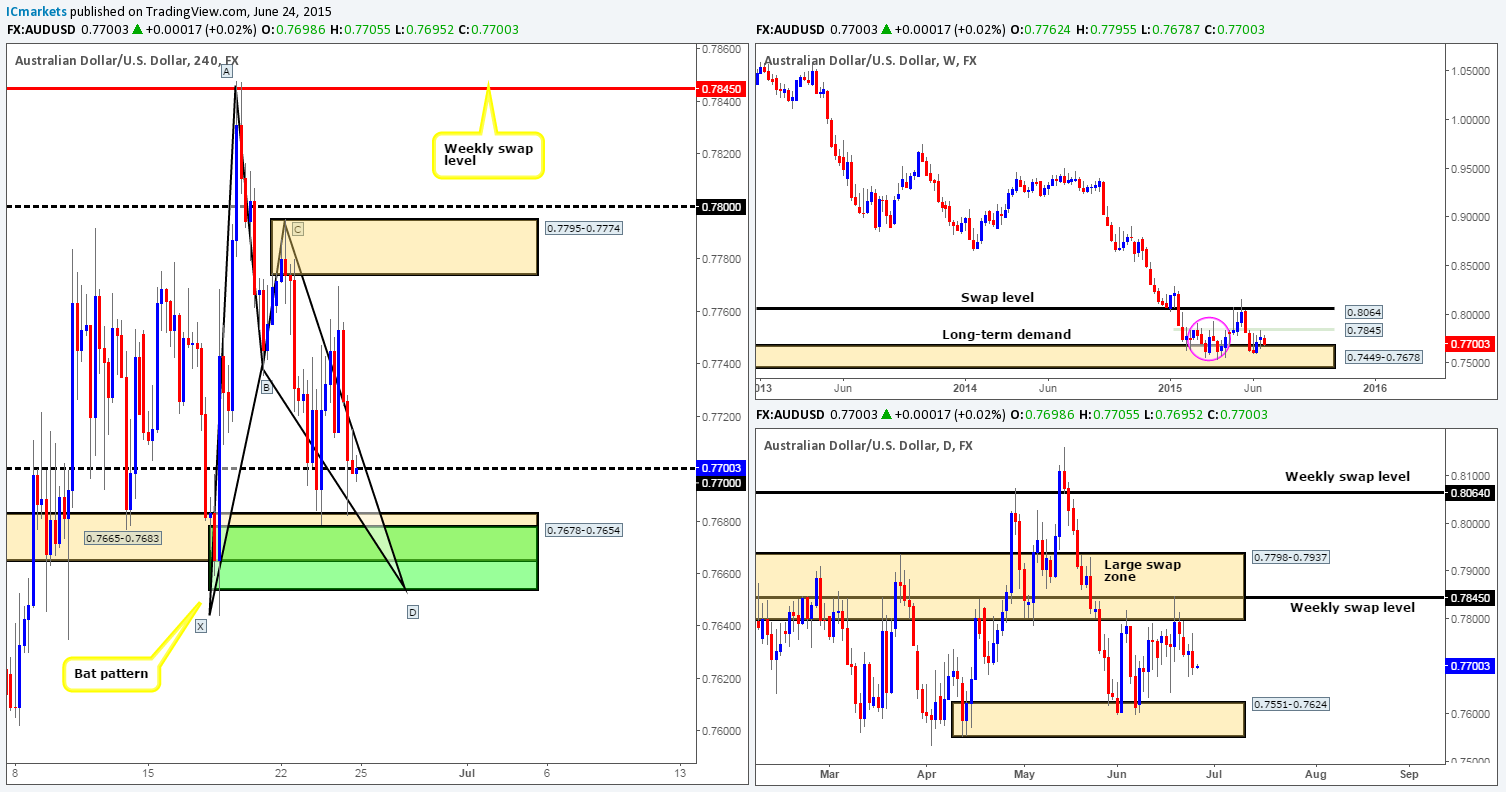
Weekly view – Following the rebound seen from the long-term weekly demand area at 0.7449-0.7678, price connected with a minor weekly swap level coming in at 0.7845 last week, consequently forming a weekly indecision candle. Judging by the sloppy reaction seen (pink circle – 02/02/15-06/04/15) between these two aforementioned weekly areas a few months ago, things could potentially get messy here again before we see any decisive move take place. From a long-term perspective, nonetheless, the trend direction on this pair is still very much south in our opinion, and will remain this way until we see a convincing break above 0.8064.
Daily view: From the pits of the daily scale, we can see that price has begun to consolidate (mid-range at the time of writing) between 0.7798-0.7937 (a large daily swap zone that surrounds the aforementioned weekly swap level), and 0.7551-0.7624 (a daily demand area that is located within the aforementioned weekly demand zone).
4hr view: We mentioned in our previous report that for anyone with long positions from the 4hr Harmonic Bat reversal zone seen in green at 0.7678-0.7654, the final take-profit target would likely be around the 4hr supply area at 0.7795-0.7774. As you can see, price fell six pips short of this target, dropping back down to retest the 4hr swap area at 0.7678-0.7654. We do hope most of you managed to close before this selloff began!
Going into today’s sessions, however, other than looking for confirmed buy entries around the aforementioned 4hr swap zone and the round number 0.7700, there is very little opportunity to trade this pair as per our rules of engagement.
Levels to watch/ live orders:
- Buys: 0.7700 [Tentative – confirmation required] (Stop loss: dependent on where one confirms this level) 0.7665-0.7683 [Tentative – confirmation required] (Stop loss: 0.7661).
- Sells: Flat (Stop loss: N/A).
USD/JPY:
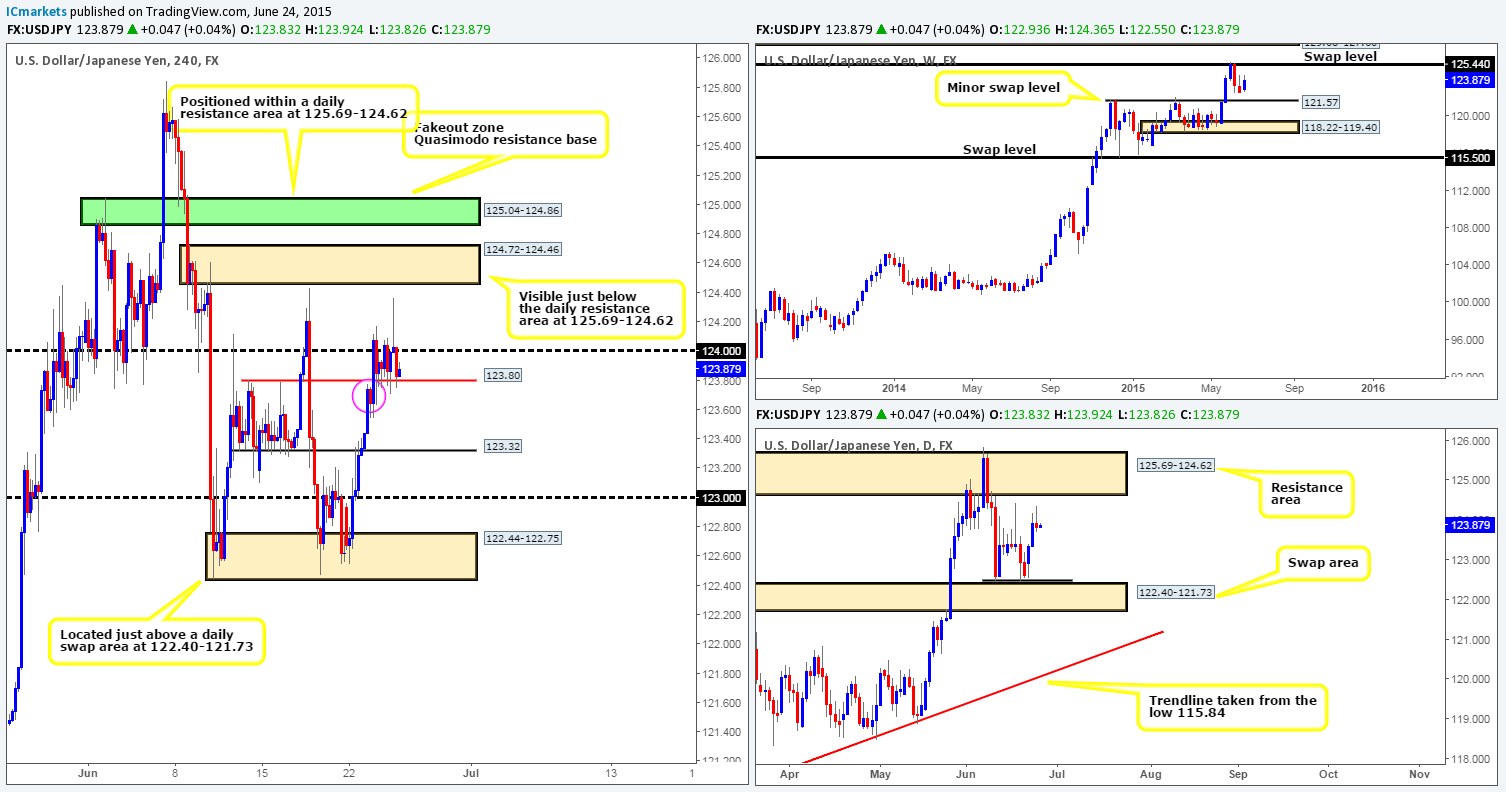
Weekly view – Buying interest is currently being seen from the 122.62 mark on the weekly timeframe. Provided this continues, we might see price challenge the weekly swap level at 125.44 again. From a long-term perspective, however, the uptrend on this pair is still very much intact, and will remain that way in our opinion until the weekly swap level 115.50 is consumed.
Daily view: From the daily timeframe, we can see that buying came to an abrupt halt yesterday as price formed a relatively nice looking bearish pin bar candle just below last Wednesday’s high 124.43.
4hr view: Other than the rather aggressive wick printed during the early hours of the U.S session yesterday, the USD/JPY pair spent much of its time ranging between the round number 124.00 and an ignored 4hr Quasimodo level coming in at 123.80. With all of the above taken into consideration, our prime focus today will be on watching for price to breakout of this temporary 4hr consolidation.
A convincing close above 124.00 would likely stimulate an advance towards the 4hr supply area at 124.72-124.46 (visible just below the aforementioned daily resistance area). Despite this, our team would only be interested in trading this move if (i) 124.00 was retested as support and (ii) a lower timeframe buying signal also accompanied this retest.
On the flip side, should a close below 123.80 be seen, (like above) we’d need to see a retest of this level with lower timeframe confirmation to permit shorts here. The take-profit target for this trade would be set at 123.32. The reason we’re ignoring the 4hr demand area circled in pink at 123.54-123.74 is simply because the amount of times it has been tested already. An area that has been visited multiple times tends to lack strong, in this case, buy-side liquidity in our experience.
Levels to watch/ live orders:
- Buys: Flat (Stop loss: N/A).
- Sells: Flat (Stop loss: N/A).
USD/CAD:
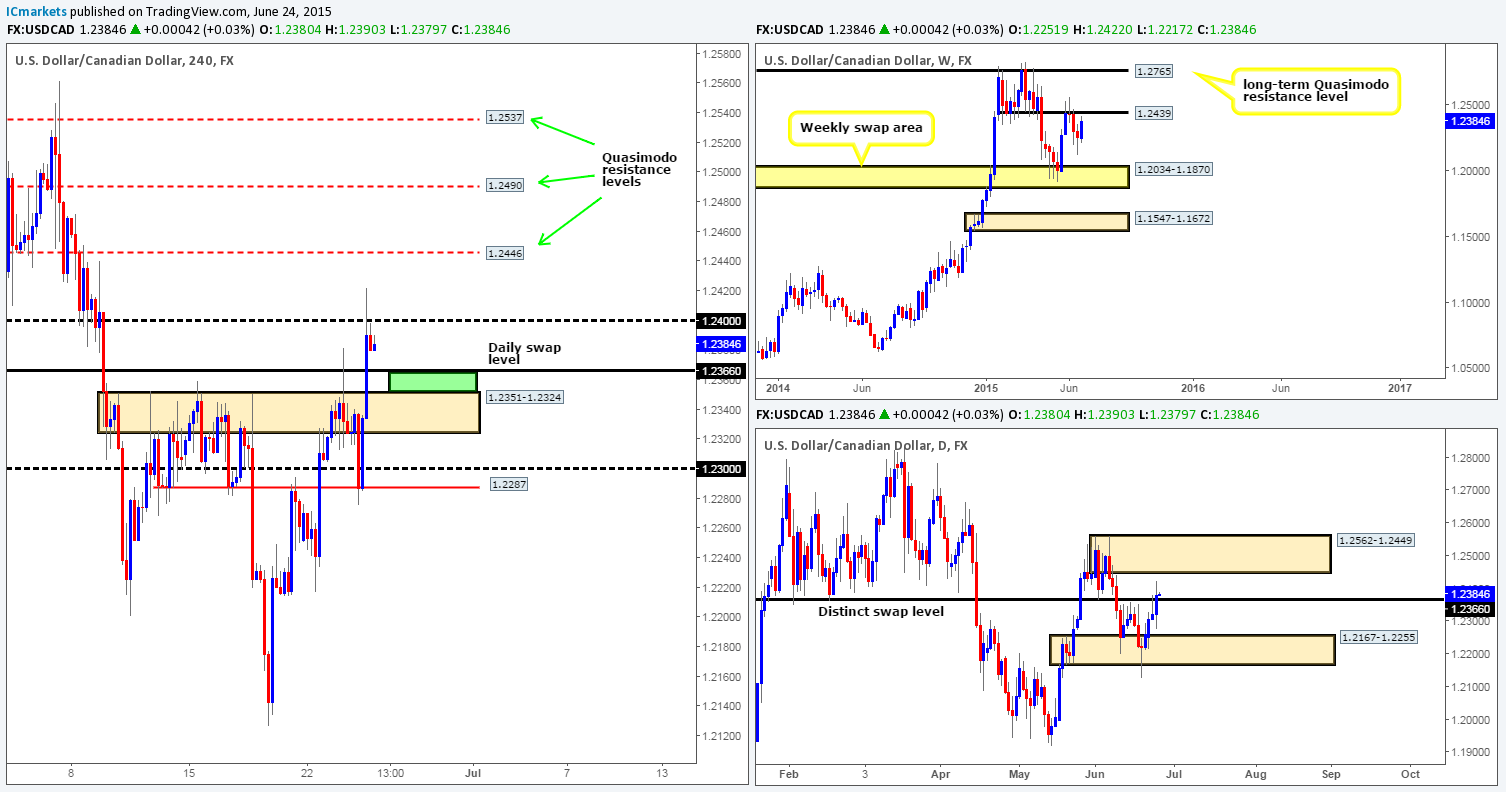
Weekly view – From this angle, we can see that price is trading JUST BELOW a weekly swap level coming in at 1.2439, which could potentially repel the market once again. With that being said though, our long-term bias on this pair remains long, and it will only be once/if we see a break below the weekly swap area at 1.2034-1.1870 would our present bias likely shift.
Daily view: The latest coming in from this timeframe shows that price recently closed above an obvious daily swap level at 1.2366. This move, in our opinion, has very likely cleared the path north up to the daily supply area seen at 1.2562-1.2449 (located just above the aforementioned weekly swap level).
4hr view: After price shook hands with the 4hr swap level 1.2287 yesterday, the buyers literally waited for nobody. The 4hr resistance base at 1.2351-1.2324 was completely obliterated. It was only once price connected with the round number 1.2400 did we see this market begin to stabilize.
On the grounds that both the daily and weekly timeframes are showing room to move further north (see above), our attention will mostly be driven toward short-term longs today. We currently have our eye on the green buy zone positioned in between the aforementioned daily swap level and (now) the 4hr swap area at 1.2351-1.2324. Waiting for lower timeframe confirmation is highly recommended here, because it would be difficult to tell how deep price will drive before rebounding. First take-profit target for any trade taken here will be set around 1.2400; the second and final target comes in at a 4hr Quasimodo resistance level seen at 1.2446.
Once or indeed if price reaches 1.2446, this is where our attention will shift from longs to shorts. 1.2446, 1.2490 and 1.2537 are all 4hr Quasimodo resistance levels which, as far as we can see, all have the potential to reverse this market. The reason for this is simply because each level is encased within the aforementioned daily supply area, which as you already know converges nicely with the weekly swap level at 1.2439 (see above). However, it is difficult to tell which Quasimodo level will be the most reactive, so instead of setting pending sell orders at each zone, we’re going to watch how the lower timeframe price action behaves at each barrier before considering a trade.
Levels to watch/ live orders:
- Buys: 1.2366/1.2351 [Tentative – confirmation required] (Stop loss: dependent on where one confirms this area).
- Sells: 1.2446 [Tentative – confirmation required] (Stop loss: dependent on where one confirms this level) 1.2490 [Tentative – confirmation required] (Stop loss: dependent on where one confirms this level) 1.2537 [Tentative – confirmation required] (Stop loss: dependent on where one confirms this level).
USD/CHF:
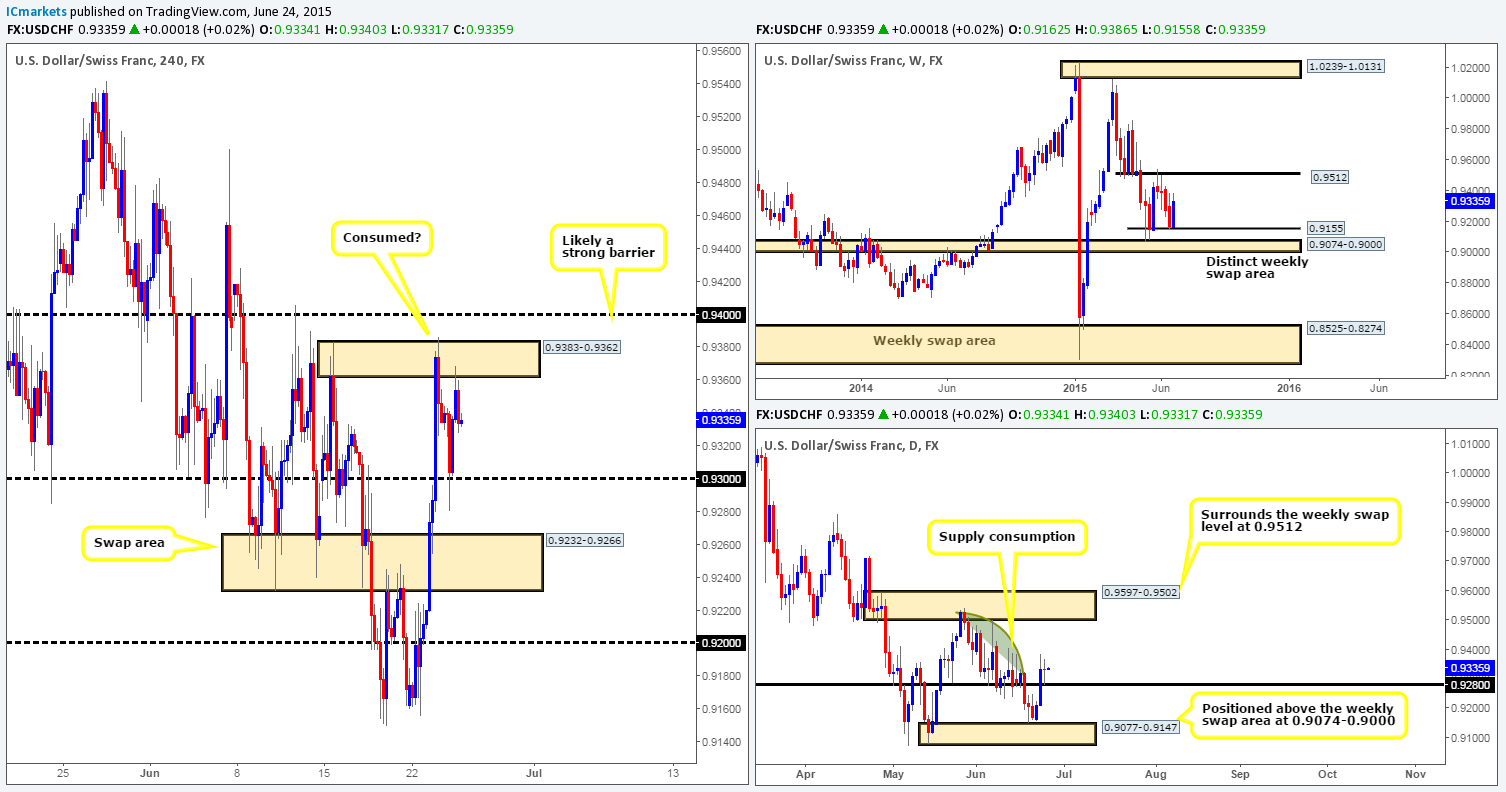
Weekly view – The view from the weekly timeframe is currently bullish. Price has found support around the 0.9155 mark. Continued buying from here could see price connect with 0.9512 – a proven weekly swap level.
Daily view: Following Tuesday’s advance, price formed a daily indecision candle using a daily swap level as support at 0.9280. As such, our previous report still holds…The market has now entered into a consumption zone (the green arc pattern). By consumption zone (in this case) we simply mean an area where we feel supply has already been taken out – check out the supply consumption wicks seen at 0.9405 and 0.9500. Therefore, if our analysis is correct, the path north should now be free up to the daily supply area at 0.9597-0.9502.
4hr view: Previously, we mentioned to keep an eye on 0.9237 and 0.9300 for potential buying opportunities. Yesterday’s sessions show that price reacted beautifully from the 0.9300 region, which we did attempt to enter long at, but unfortunately could not find an entry! Well done to any of our readers that did!
Taking into consideration that both the weekly and daily timeframes are showing support at the moment, our attention will mostly be focused on longs today and possibly into tomorrow. Buying right now, however, may not be the best route to take, since there is near-term 4hr supply sitting just above at 0.9383-0.9362. In all honesty though, this area does not concern us too much as we believe it to be weak, the area we are a little worried about, nonetheless, is the round number sitting just above it at 0.9400. Historically, this price level has been extremely significant! Therefore, as much as we would love to buy now, we’ll hold fire until we see a close above this number.
Levels to watch/ live orders:
- Buys: Flat (Stop loss: N/A).
- Sells: Flat (Stop loss: N/A).
US 30:
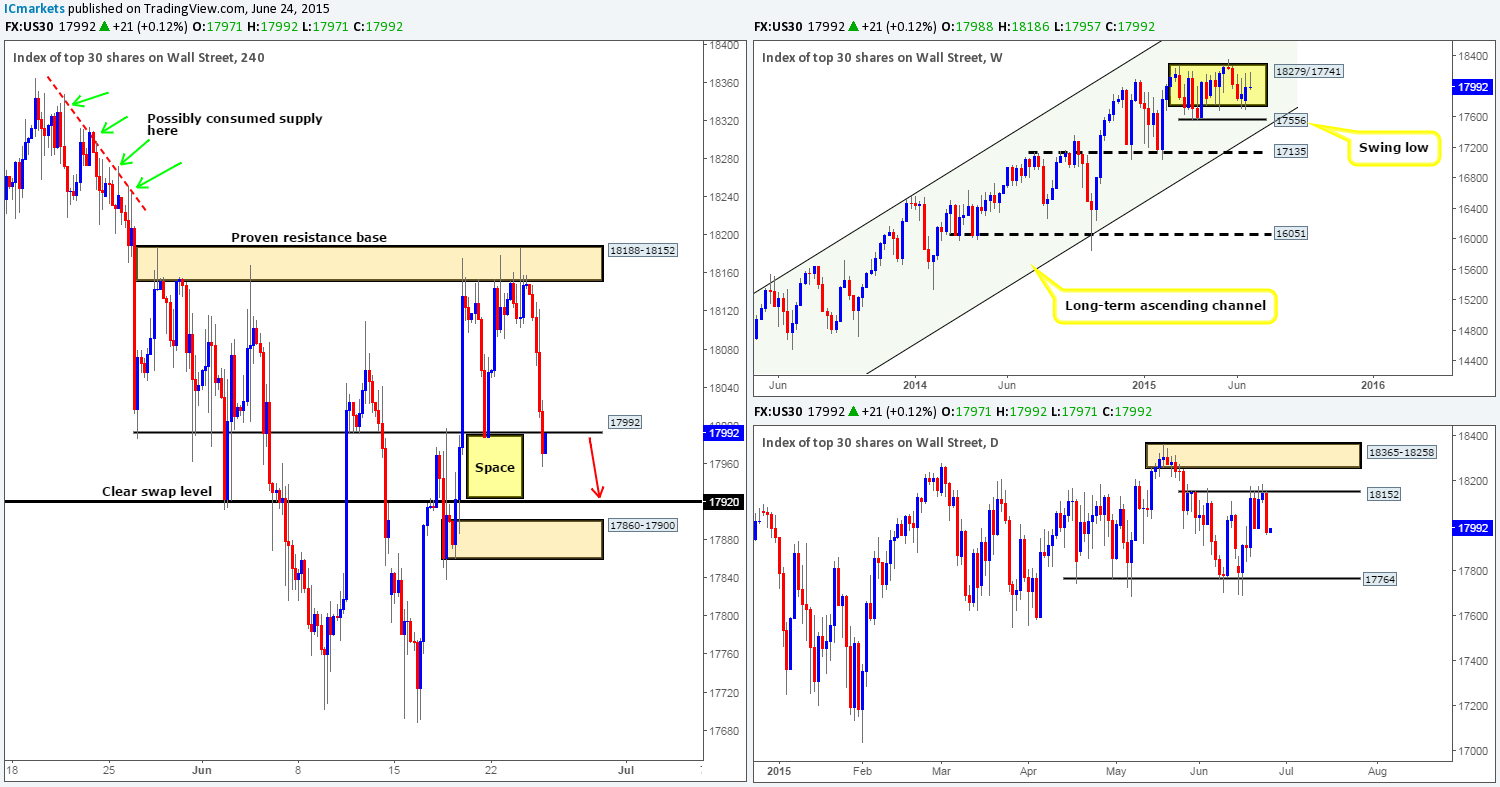
Weekly view – The weekly timeframe shows that the DOW continues to consolidate (currently mid-range) between 18279/17741 (yellow rectangle). From a longer-term perspective, however, the overall uptrend on this index is still very strong, and will remain this way in our opinion until we see a convincing push below 16051.
Daily view: From this viewpoint, we can see that price aggressively sold off yesterday from the underside of a minor daily resistance level at 18512. Should further selling be seen today, we might see price challenge the daily support level coming in at 17764.
4hr view: The recent descent from the 4hr resistance base at 18188-18152 (surrounds the aforementioned minor daily resistance level) has only just recently taken out a 4hr swap level seen at 17992. This could suggest further downside today towards another 4hr swap level at 17920, or even the 4hr demand area looming just below it at 17860-17900.
Therefore, given the points made above, intraday shorts from 17992 is a viable setup in our opinion as long as the retest (which is currently taking place) displays clear lower timeframe selling confirmation such as, a trendline break, an engulf of demand or simply a bearish candlestick pattern. Should we manage to spot a lower timeframe short setup here, the take-profit target for this trade will be at 17924.
Levels to watch/ live orders:
- Buys: Flat (Stop loss: N/A).
- Sells: 17992 [Tentative – confirmation required] (Stop loss: dependent on where one confirms this level).
XAU/USD (Gold)
Weekly view – The weekly timeframe shows that gold is now effectively range bound between a weekly resistance barrier at 1223.1-1204.5 and a weekly demand at 1142.5-1167.3. From a long-term perspective, however, gold is still trending south in our opinion, and It will only be once/if we see a close above the weekly trendline extended from the high 1488.0 would we begin to feel that this market may be reversing.
Daily view: From this viewpoint, we can see that gold declined in value for a third consecutive day yesterday, consequently pushing gold even deeper into the daily buy zone coming in at 1170.3-1184.0.
4hr view: Gold’s recent collapse saw price slice below the 4hr buy zone at 1175.1-1177.5 (located within the aforementioned daily buy zone), which as a result, forced this market to cross swords with a long-term 4hr swap level seen at 1170.4 (represents the lower limit of the aforementioned daily buy zone). The bullish momentum seen from this 4hr level so far looks genuine, but to buy based on this alone would not be something our team would stamp high probability.
Ultimately, we’re looking for price to consume the newly-formed 4hr supply area at 1180.1-1177.8, as this would likely pave the way north up to the 4hr supply area at 1188.0-1185.5 (an ideal take-profit target). This would not only give us confidence to begin looking for buys on any retrace seen (as per the red arrows), but also likely confirm buying strength from both the daily buy zone and the lower limit of the weekly range (see above). It will be interesting to see how this pans out.

Levels to watch/ live orders:
- Buys: Flat (Stop loss: N/A).
- Sells: Flat (Stop loss: N/A).


