A note on lower timeframe confirming price action…
Waiting for lower timeframe confirmation is our main tool to confirm strength within higher timeframe zones, andhas really been the key to our trading success. It takes a little time to understand the subtle nuances, however, as each trade is never the same, but once you master the rhythm so to speak, you will be saved from countless unnecessary losing trades. The following is a list of what we look for:
- A break/retest of supply or demand dependent on which way you’re trading.
- A trendline break/retest.
- Buying/selling tails – essentially we look for a cluster of very obvious spikes off of lower timeframe support and resistance levels within the higher timeframe zone.
- Candlestick patterns. We tend to only stick with pin bars and engulfing bars as these have proven to be the most effective.
EUR/USD:
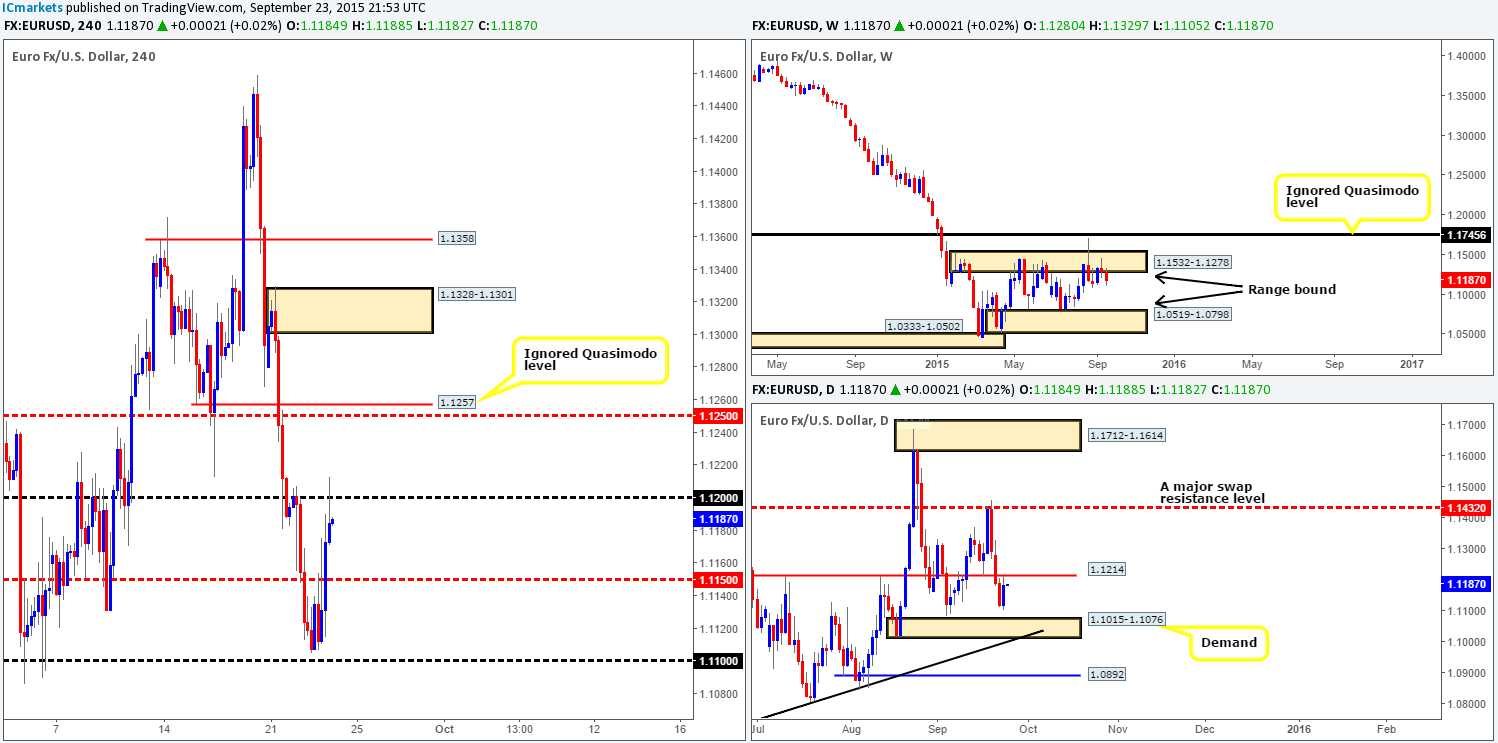
Recent action shows that the EUR enjoyed a relatively successful day of gains yesterday, consequently wiping out 90% of the prior day’s losses.A little resistance, however, was seen around the mid-level barrier 1.1150 going into London trade, but was clearly not enough to hold this market lower. The day ended with price hitting and faking slightly above the round-number 1.1200.The reason for this fakeout likely stems from the daily scale. See how price edged higher yesterday from just above demand at 1.1015-1.1076 in order to connect with a swap resistance level coming in at 1.1214. As you can see,it always pays to know where you’re trading in the bigger picture!
In light of price currently holding below: 1.1200, daily resistance and also the fact that this market continues to show bearish intent from weekly supply at 1.1532-1.1278, we feel the EUR may sell-off back down to at least 1.1150 today. Ideally, for us to trade this potential move south, we’d want to see price retest 1.1200 again, that way, the risk/rewardwill be far better than if we were to enter at current prices.Alternatively, should our analysis be incorrect and a close above 1.1200 is seen, this would likely expose 1.1250, followed closely by the ignored Quasimodo level given at 1.1257. A confirmed retest of 1.1200 following the break would need to be seen for this to be a valid long opportunity in our book.
Levels to watch/live orders:
- Buys: Watch for offers at 1.1200 to be consumed and then look to enter on any retest seen at this number (confirmation required).
- Sells:1.1200 [Tentative- confirmation required] (Stop loss: dependent on where one confirms this level)
GBP/USD:
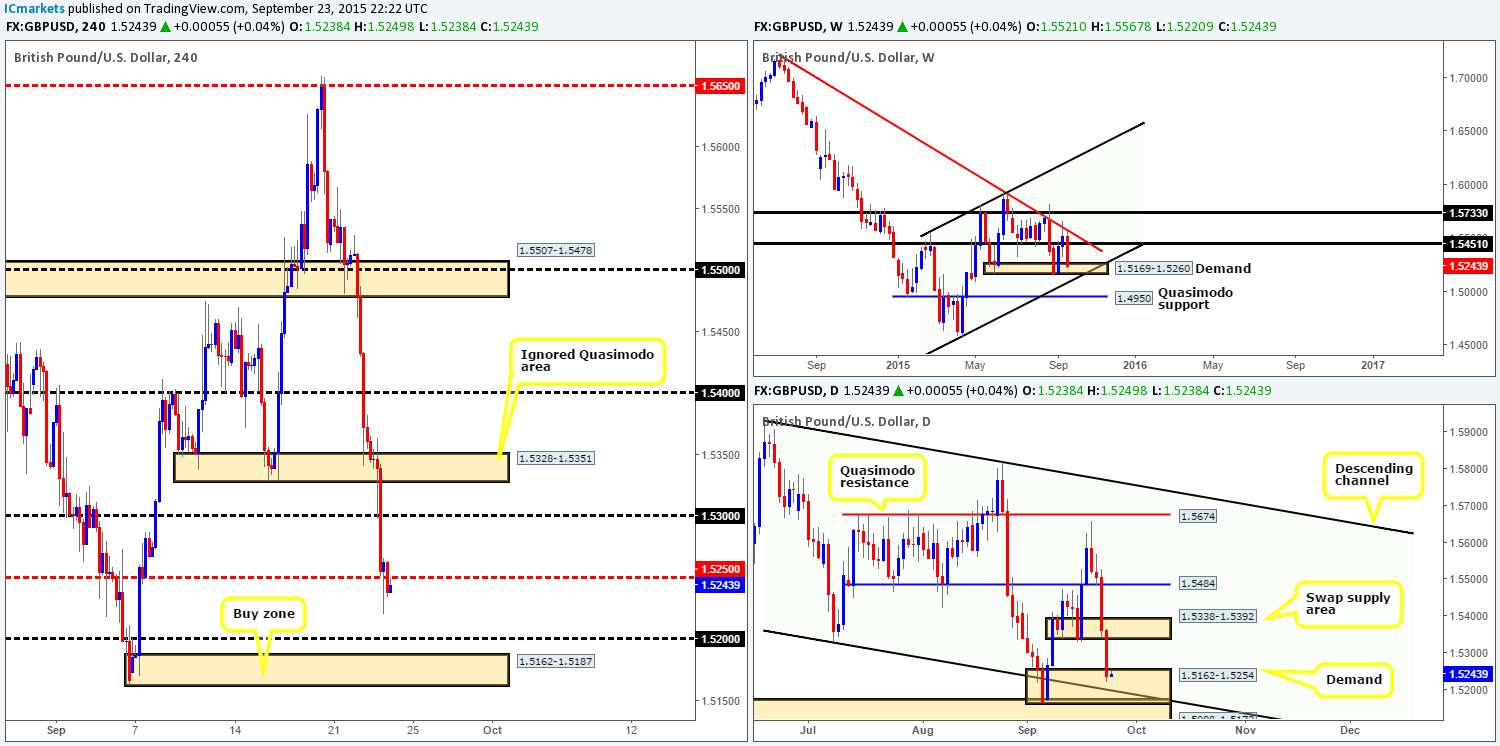
Further selling was seen on Cable yesterday, resulting in price taking out several 4hr technical levels during its onslaught. There was little fight seen at the Quasimodo area 1.5328-1.5351, while1.5300, however, managed to hold this market steady for a while, but did eventually gave way consequently reaching lows of 1.5220 on the day.
As can be seen from the 4hr chart at present, price is kissing the underside of 1.5250, which so far seems to be holding firm. Should the sellers manage to hold this market below here today, a push lower to connect with 1.5200 could be on the cards. Granted one could look to sell into this move, but quite frankly we would have little interest in joining the current hoard of selling going on at the moment. Our rationale behind this approach simply comes from scanning across to the higher timeframes. Check out how both the weekly and daily chartsshow price now sitting within demand (1.5169-1.5260/1.5162-1.5254). The daily demand even converges with a descending channel support taken from the low 1.5329. Therefore, from a technical perspective this is not really the ideal place to begin looking to sell in our opinion.
Ultimately, we’d only look to trade this pair long IF price reached the 4hr demand zone lurking below at 1.5162-1.5187. Yes, we run the risk of missing a bull move from current price, but by entering long now, we also run the risk of serious drawdown. The 1.5300 handle sitting just above our chosen buy zone will likely be faked lower should price reach this number today, so guys do watch your stops here. In fact, this 4hr demand area looks so attractive considering its higher timeframe confluence that we have decided to place a pending buy order just above it at 1.5188, and stop set below the zone at 1.5157.
Levels to watch/ live orders:
- Buys: 1.5188 (Stop loss: 1.5157).
- Sells: Flat (Stop loss: N/A).
AUD/USD:
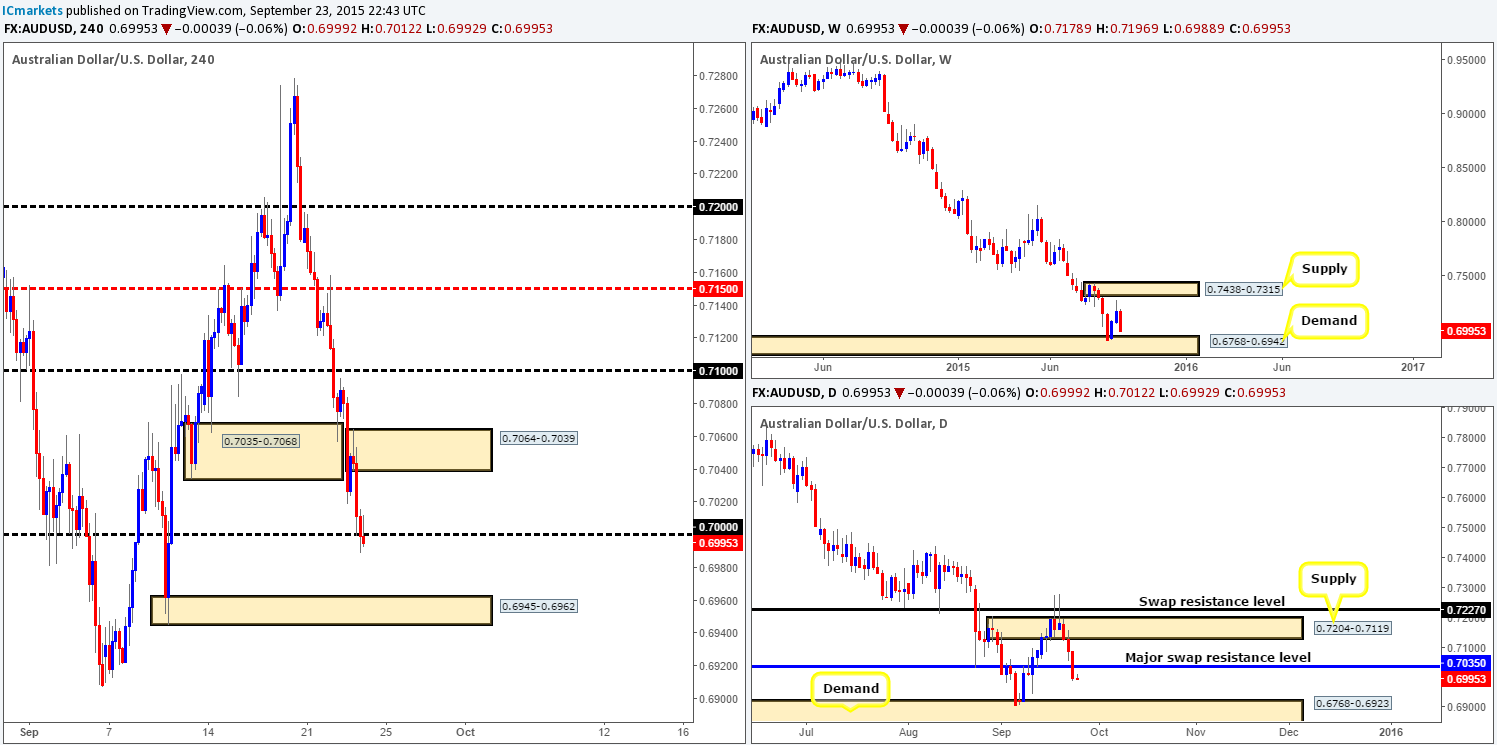
Despite the bounce seen from demand at 0.7035-0.7068, the Aussie pair declined for a third consecutive day during yesterday’s trade, resulting in price shaking hands with the large psychological support 0.7000. This recent sell-off also saw price take out a major daily swap (support) level coming in at 0.7035, which on its own may indicate further downside this week towards demand drawn from 0.6768-0.6923.
So, the big question today really is, is 0.7000 a stable enough handle to look to buy from? We really feel this number is going to give way. The big giveaway is that little bullish intent is currently being seen on the 4hr timeframe here, and also the fact that daily support has just been taken out. What is more, there is also room seen on the weekly timeframe for price to continue depreciating yet down to demand at 0.6768-0.6942. A close below 0.7000 potentially opens up the path towards demand at 0.6945-0.6962. This forty-pip move south is tradable as long as price retests 0.7000 as resistance and shows corresponding lower timeframe selling confirmation.The stop loss would need to be no more than fifteen pips here, in our opinion, since any more than this and we run the risk of trading with poor risk/reward.
Conversely, Should the bulls make an appearance at 0.7000, the most we see price rallying to is supply at 0.7064-0.7039, since this is likely where the initial decision was made to breakout below the aforementioned daily support. Like above, this is a forty-pip move but not one we’d want to trade, as by doing so you’re potentially going again higher timeframe flows (see above).
Levels to watch/ live orders:
- Buys: Flat (Stop loss: N/A).
- Sells:Watch for bids at 0.7000 to be consumed and then look to enter on any retest seen at this number (confirmation required).
USD/JPY:
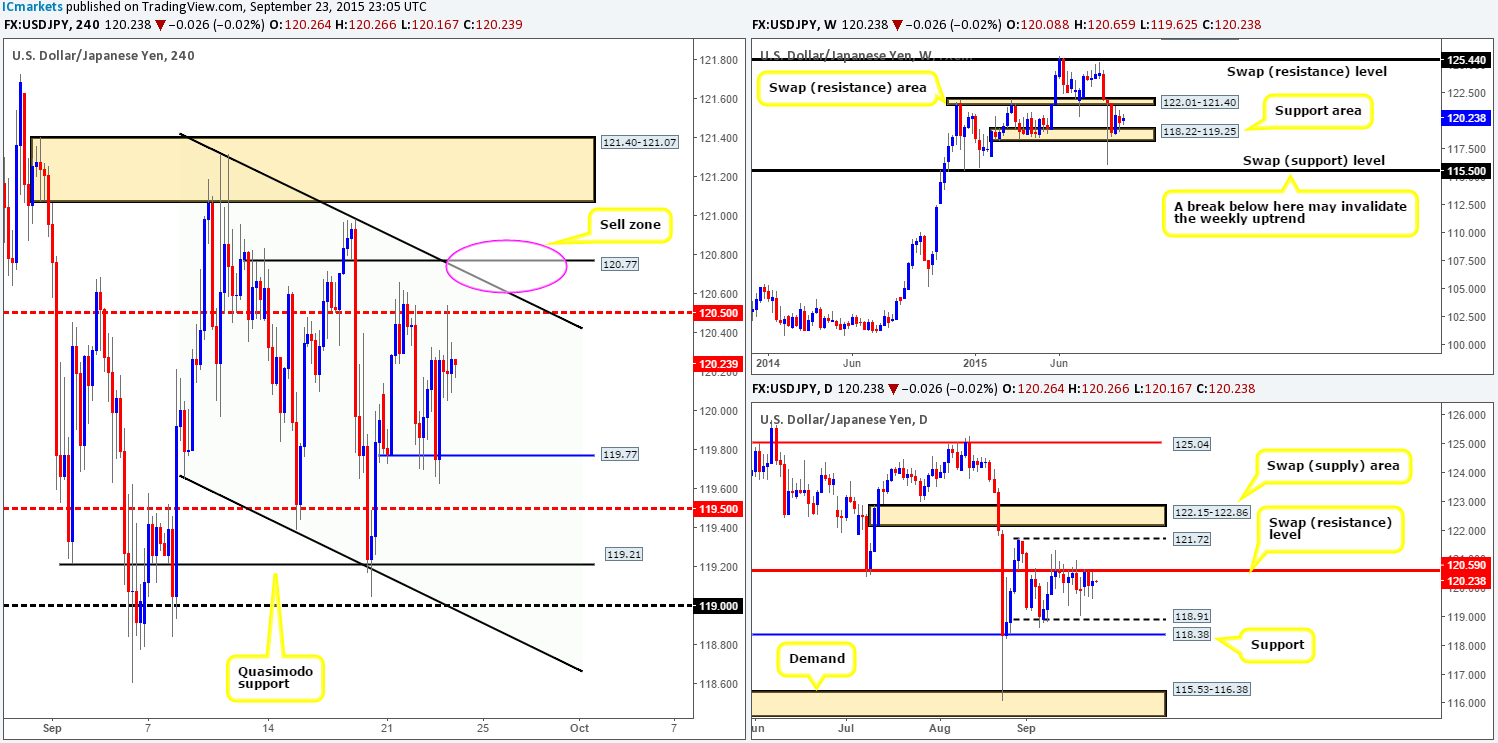
Using a top-down approach this morning, we can see that weekly action has somewhat stagnated on the weekly timeframe between a swap resistance area coming in at 122.01-121.40 and a support barrier drawn from 118.22-119.25. Looking down to the daily timeframe, however, it’s clear that offers still remain strong around the swap resistance level at 120.59. This beast has held this pair lower now for over two weeks!
Pushing down one lower, the 4hr timeframe shows price is consolidating between support at 119.77 and the mid-level barrier 120.50.
Our team has little interest in trading this current 4hr consolidation even though there is adequate room to profit. The reason being is we still have our eye on the 120.77 level just above it for confirmed shorts, which coincides nicely with the 4hr channel resistance (121.31), and also sits just above the aforementioned daily swap (resistance) level. Now, we understand that some technicians may say: ‘well, why not just look to trade 120.50 as this is even closer to the daily resistance barrier?’ Our answer to this would be because there is a strong possibility of a fakeout above this number to connect with offers at the 4hr descending channel. If one does not mind having a large stop, then a trade at 120.50 is valid in our book.
Levels to watch/ live orders:
- Buys: Flat (Stop loss: N/A).
- Sells:120.77 [Tentative – confirmation required] (Stop loss: dependent on where one confirms this level).
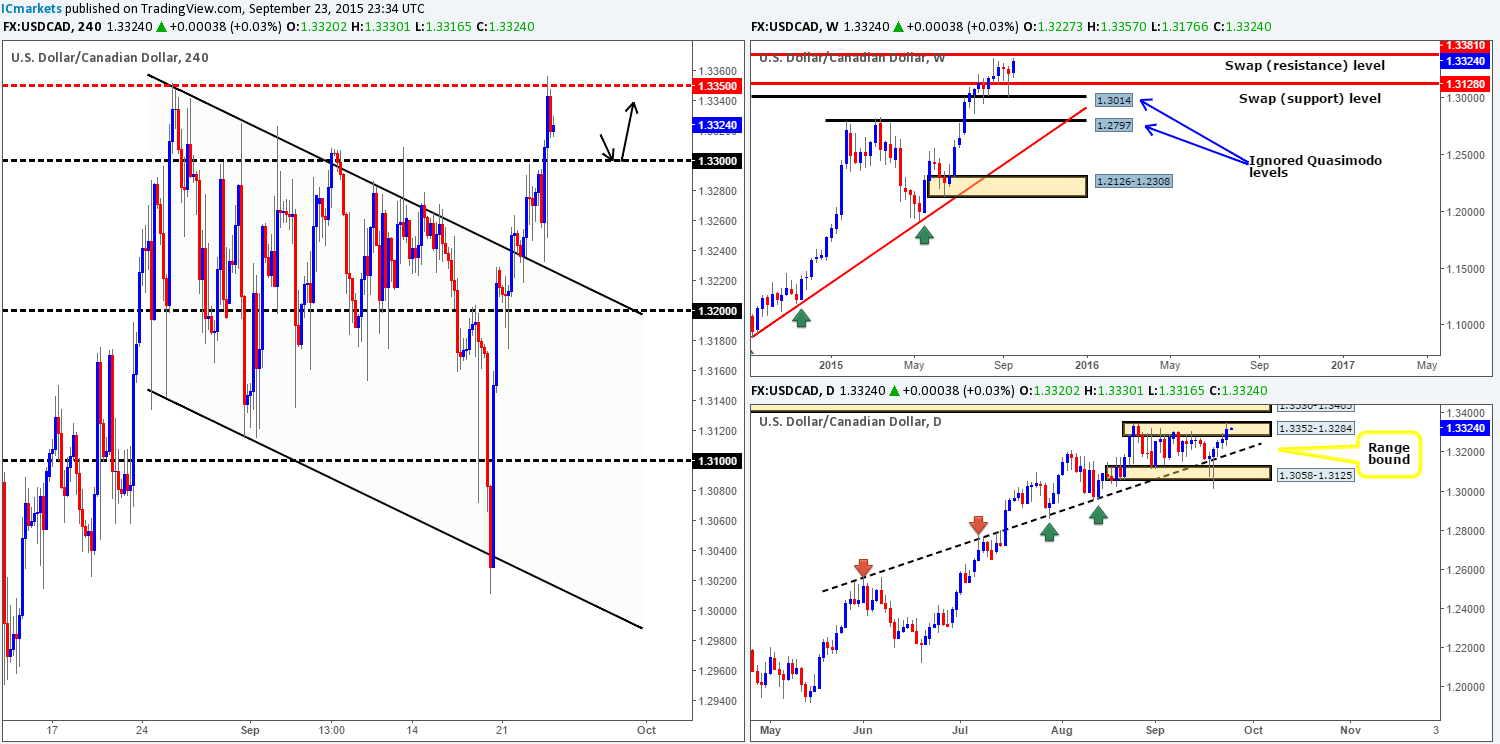
USD/CAD:
Traders who attempted to buy the retest of 1.3300during yesterday’s trade likely got burnt as a result, as a vicious spike penetrated this levelreaching lows of 1.3249. Following this, the pair continued to march north, taking out stops above the mid-level number 1.3350 and reaching a new 11-year high at 1.3357.
Consequent to this recent rally, daily action shows price faked above daily supply at 1.3352-1.3284 by a few pips, as reported may happen in our previous analysis http://www.icmarkets.com/blog/wednesday-23rdseptember-daily-technical-outlook-and-review/. With offers now likely clear around 1.3350, and supply on the daily timeframe possibly weakened, the path is potentially clear up to 1.3381 in our opinion – the weekly swap (resistance) level. With that being the case, there may be an opportunity to enter long on this pair should price retest the 1.3300 handle later on today. This number has provided a significant resistance to this market since late August, so let’s see how it holds as support. In the event that price does retest this number today, and we manage to spot a lower timeframe buy setup here, we’ll ultimately be targeting 1.3379 – two pips below the aforementioned weekly level.
Levels to watch/ live orders:
- Buys:1.3300 [Tentative – confirmation required] (Stop loss: dependent on where one confirms this level).
- Sells: Flat (Stop loss: N/A).
USD/CHF:
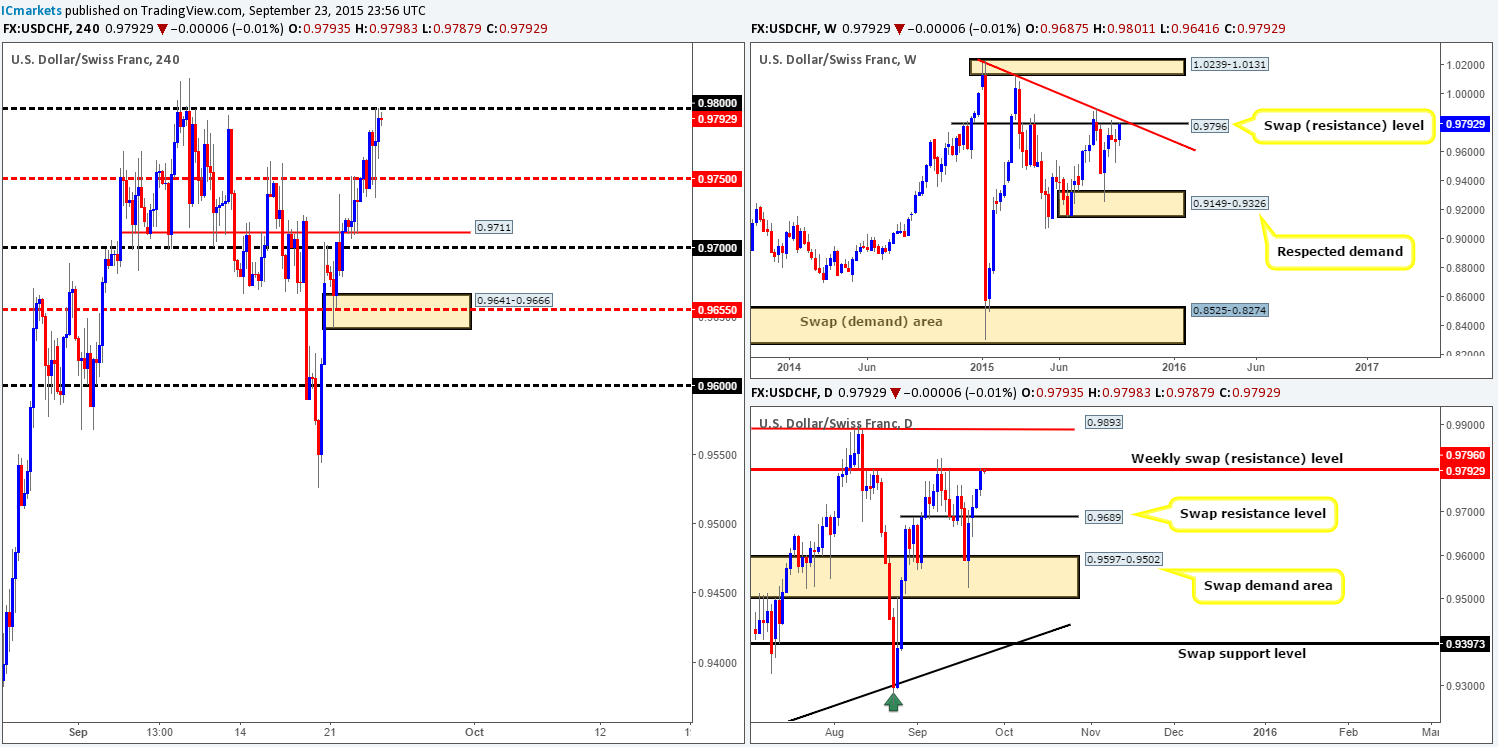
The USD/CHF pair, as you can see, broke above the mid-level number 0.9750 late Tuesday, which was retested as support going into London trade yesterday. 0.9750 remained well-bid throughout the sessions, resulting in the market rallying up to connect with offers sitting around 0.9800.
Today’s analysis is relatively straightforward in that this market appears to be trading around overall resistance at the moment. The weekly shows price hugging the underside of a swap resistance level coming in at 0.9796, while price is seen holding firm below the 0.9800 figure on the 4hr scale. In addition to this, notice that the weekly level also boastsdown trendlineconfluence extended from the high 1.0215 adding weight to a potential downside move.To that end, we’re confident there will likely be a sell-off seen today from 0.9800 back down to at least 0.9750. However, entering at market now is out of the question for us as a fakeout above 0.9800 is highly likely as we come into the European session today. Therefore, lower timeframe confirmation will be required for us to be given the green light to go ahead and short from here.
Levels to watch/ live orders:
- Buys:Flat (Stop loss: N/A).
- Sells: 0.9800 [Tentative – confirmation required] (Stop loss: dependent on where one confirms this level).
DOW 30:
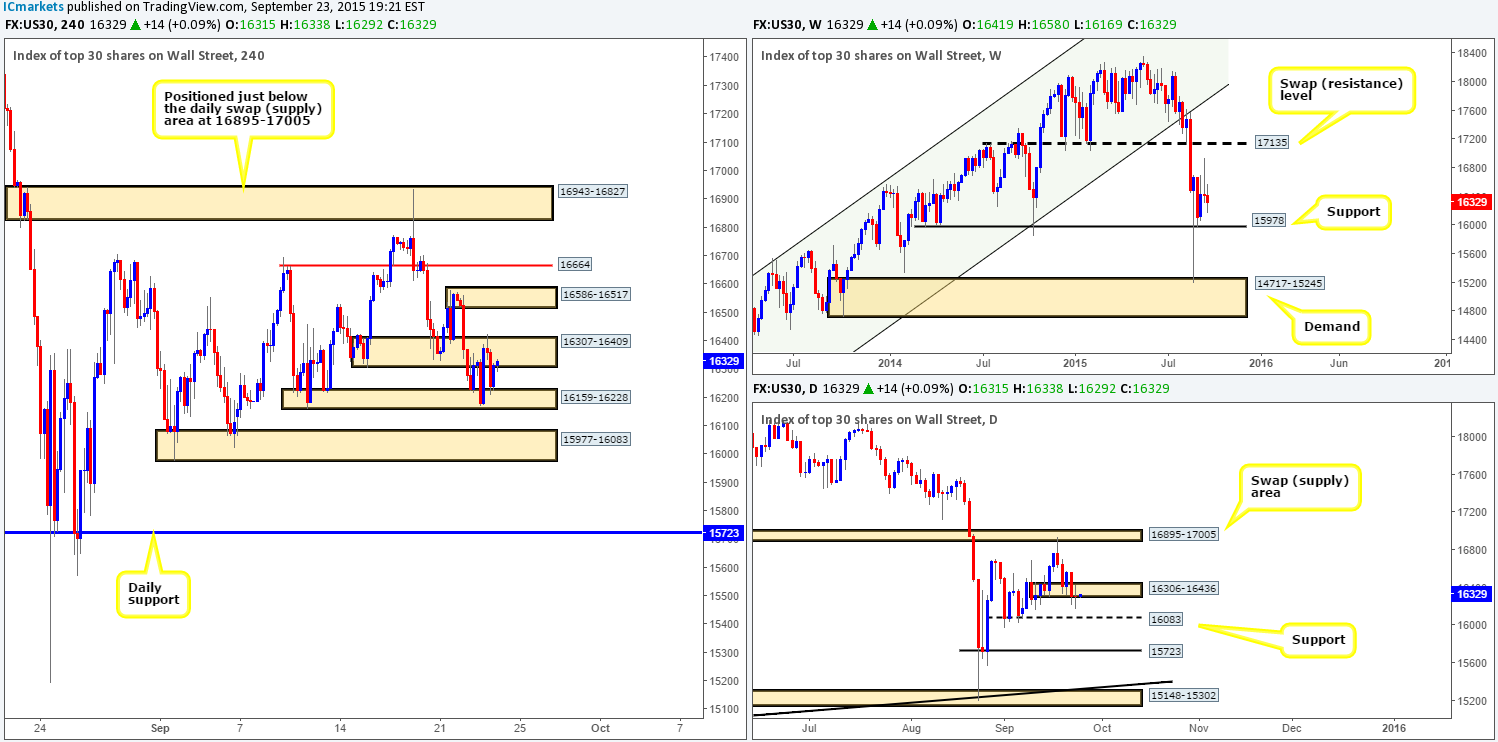
Action on the DOW was relatively quiet during yesterday’s sessions, as price tightly consolidated between demand at 16159-16228 and a swap supply coming in at 16307-16409. Due to this lackluster performance, much of the following analysis will be similar to the previous…
Our team has stated that they have absolutely no interest in trading within the current 4hr range, since we still have our beady little eye on the demand zone just below it at 15977-16083 for two reasons:
- The top-side of this demand is formed from daily support at 16083.
- The lower limit of this demand area comes from weekly support at 15978.
With just these two points, we are still confident enough to leave our original pending buy order in place at 16024 and a stop just below at 15891. With bids now likely well and truly consumed around daily demand at 16306-16436 by yesterday’s indecision candle, we feel our order has a good chance of getting filled today.
As our 4hr buy zone shows higher timeframe confluence, we are going to look to trail price as/if it moves in our favor behind distinct lower timeframe supports up to at least 16306 – the underside of the aforementioned daily demand zone. It will be interesting to see how this plays out!
Levels to watch/ live orders:
- Buys: 16024 (Stop loss: 15891).
- Sells:Flat (Stop loss: N/A).
XAU/USD: (Gold)
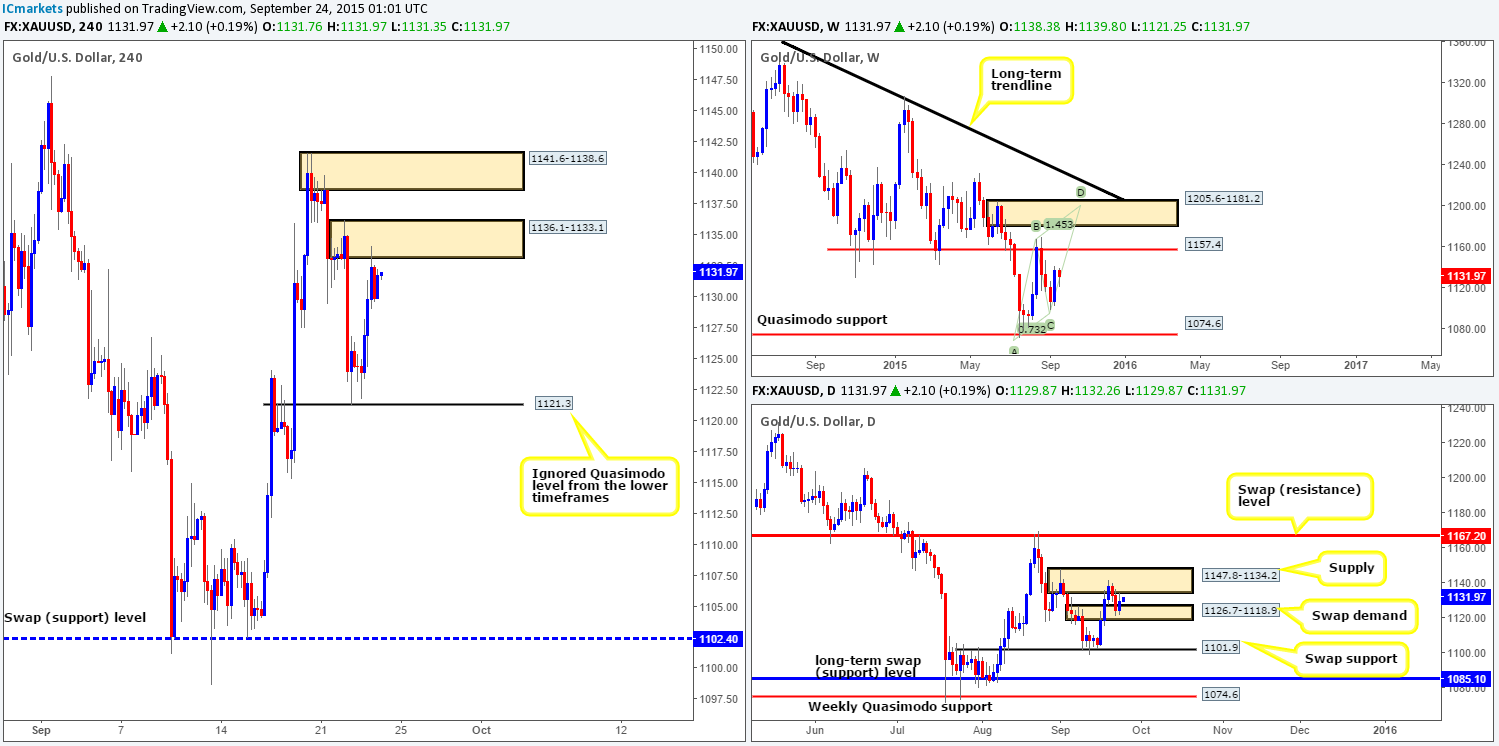
Following on from yesterday’s report: http://www.icmarkets.com/blog/wednesday-23rdseptember-daily-technical-outlook-and-review/, we did in fact place a pending buy order at 1121.70, but was unfortunately not filled before price took off north to connect with offers at supply drawn from 1136.1-1133.1. What a shame!
Considering only the 4hr timeframe for the moment, we would agree that price is at a very tempting location to sell from. Just look at the space from the current supply zone back down to 1121.3! However, when we scan across to the daily picture, it’s clear to see that Gold is tightly lodged in between supply at 1147.8-1134.2, and a swap demand area taken from 1126.7-1118.9. This is certainly not to say that price will not decline from the 4hr supply today, we’d just prefer to see a more distinct area of supply on the daily chart that’s all. Furthermore, we also have to take into account the 4hr supply looming just above the current at 1141.6-1138.6, as price could very well head towards this zone later on today.
Given the points made above, and seeing how there is clear space to move south rather north on the 4hr timeframe, our team will closely watch both the above said 4hr supply zones for potential (confirmed) sells. A trade from either area will only be considered valid should lower timeframe confirmation (30/60 min preferably) be seen.
Levels to watch/ live orders:
- Buys: Flat (Stop loss: N/A).
- Sells:1136.1-1133.1 [Tentative – confirmation required] (Stop loss: 1136.8) 1141.6-1138.6 [Tentative – confirmation required] (Stop loss: 1142.4).


