A note on lower timeframe confirming price action…
Waiting for lower timeframe confirmation is our main tool to confirm strength within higher timeframe zones, and has really been the key to our trading success. It takes a little time to understand the subtle nuances, however, as each trade is never the same, but once you master the rhythm so to speak, you will be saved from countless unnecessary losing trades. The following is a list of what we look for:
- A break/retest of supply or demand dependent on which way you’re trading.
- A trendline break/retest.
- Buying/selling tails/wicks – essentially we look for a cluster of very obvious spikes off of lower timeframe support and resistance levels within the higher timeframe zone.
- Candlestick patterns. We tend to only stick with pin bars and engulfing bars as these have proven to be the most effective.
We search for lower timeframe confirmation between the M15 the H1 timeframes, since most of our higher-timeframe areas begin with the H4. Stops are usually placed 5-10 pips beyond confirming structures.
EUR/USD:
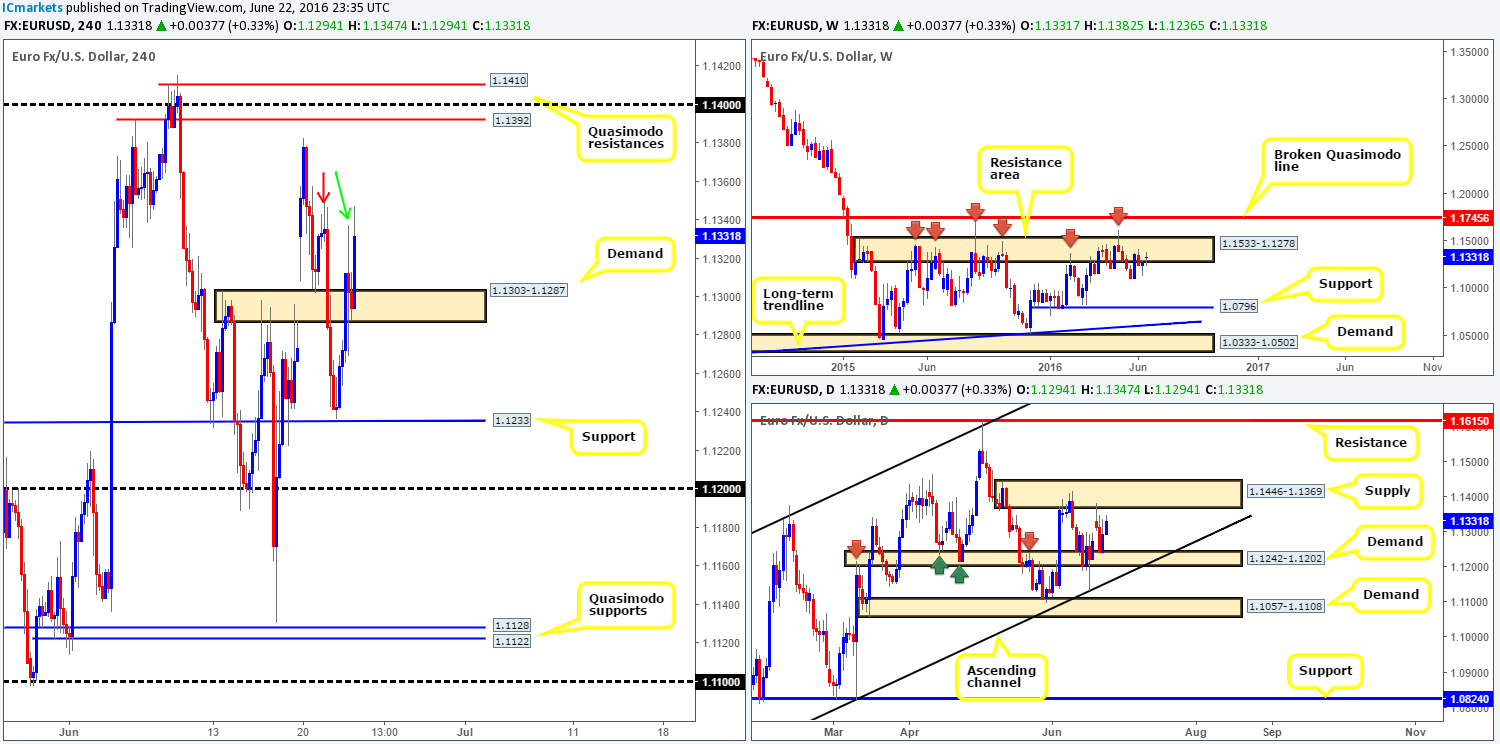
Backed by daily price trading from a demand zone at 1.1242-1.1202, recent H4 action shows that the EUR/USD extended its bounce from H4 support at 1.1233 yesterday, managing to reach highs of 1.1337 on the day. In addition to this, the single currency wiped out H4 supply at 1.1303-1.1287, which, as you can see, was later on respected as demand. The green arrow seen on the H4 chart represents yesterday’s high while the red arrow highlights H4 supply at 1.1349-1.1333. We believe, given the bullish response seen from the current H4 demand, that yesterday’s high consumed the majority of offers within the current H4 supply in order to push prices higher today. Furthermore, let’s also keep in mind that over on the daily chart there is room seen for this market to appreciate towards daily supply coming in at 1.1446-1.1369.
Our suggestions: Although H4 and daily structure suggests that this might be the better path to take today, buying this market is not something our team will be taking part in. The reason being simply comes down to the large weekly resistance area surrounding current price at 1.1533-1.1278.
To our way of seeing things, the more concrete zone to be looking for trades is seen between 1.1410/1.1392. This area is formed by two H4 Quasimodo resistance lines, coupled with a psychological number lodged in between at 1.14. Additionally, it is also housed within both the aforementioned weekly and daily barriers (see above); therefore the chance of a bearish reversal from here is much greater in our opinion. Despite all of the above our team will, even if price strikes the 1.1410/1.1392 region today, likely pass on selling from here since price action is potentially going to be very ugly due to the UK voting taking place today.
Levels to watch/live orders:
- Buys: Flat (Stop loss: N/A)
- Sells: 1.1410/1.1392: Despite this being a technically sound base to sell from, the UK voting could potentially cause this zone to fail, so we remain very cautious here!
GBP/USD:
With voting set to commence today in the UK on whether they remain in the EU or not will likely cause price action on GBP and EUR-related pairs to become erratic! Latest polls show that the ‘leave’ camp is slightly ahead but as we’ve seen in the past, polls are not always the most accurate.
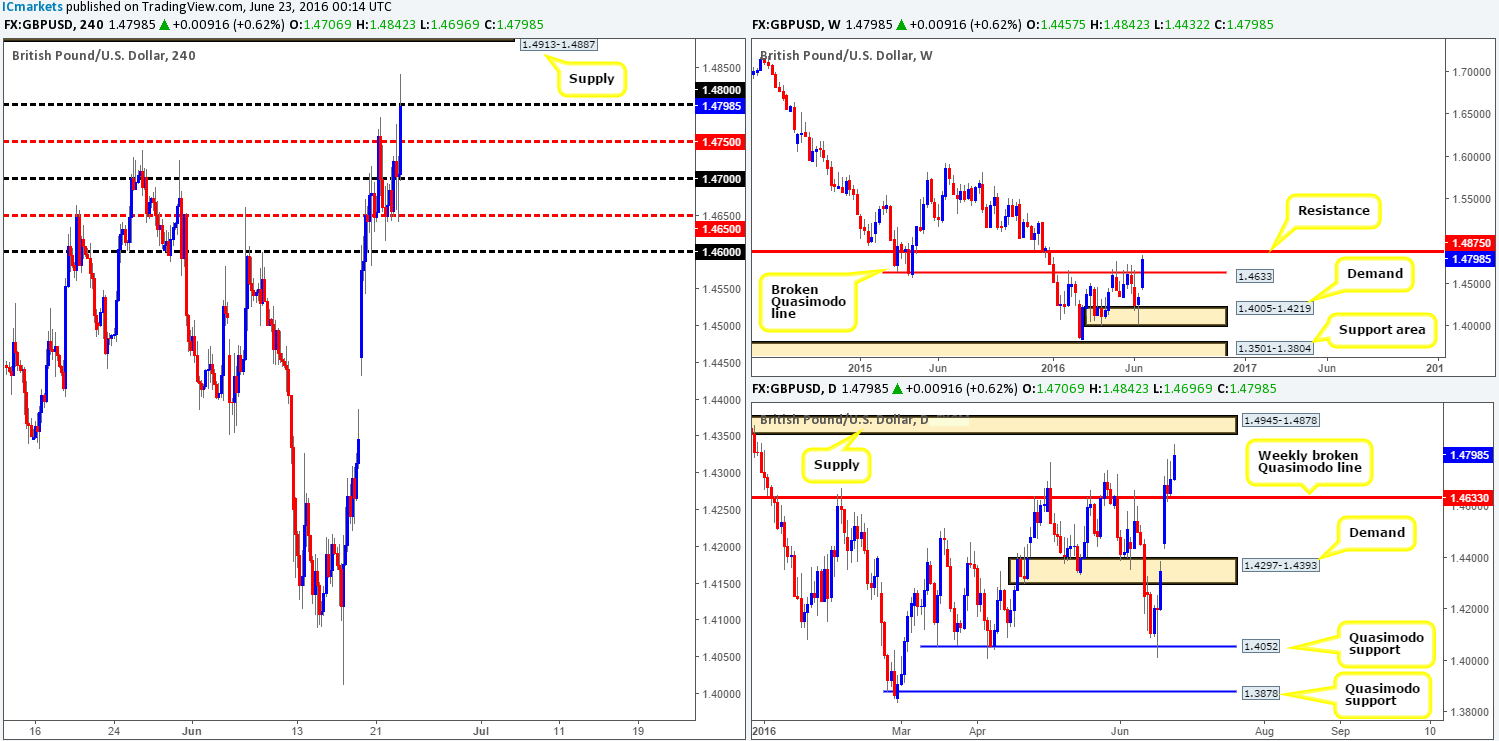
Technically, we can see that weekly price is now trading within touching distance of a weekly resistance line penciled in at 1.4875, following a break of the broken weekly Quasimodo line at 1.4633. Down on the daily chart, price is also seen lurking just below a major area of daily supply coming in at 1.4945-1.4878, which, as you can probably see, sits just three pips above the current weekly resistance line. Stepping across to the H4 chart, psychological resistance 1.48 is seen holding cable lower at the moment. However, we feel, judging by the higher timeframe price action (see above), 1.48 will cave in shortly. Beyond this number we have our sights set on the H4 supply area coming in at 1.4913-1.4887.
Our suggestions: From the weekly chart down to the H4 chart technicals suggest shorting from the current H4 supply, as it is lodged nicely within the above said daily supply base, and positioned just above weekly resistance! However, given that high volatility is likely to be seen today as well as tomorrow, our team will sidestep this pair during this time as technicals are likely to take a back seat. For those who still wish to trade this market, we would strongly advise waiting for a lower timeframe confirming signal to form beforehand (see the top of this report for confirming techniques) before risking capital!
Levels to watch/live orders:
- Buys: Flat (Stop loss: N/A).
- Sells: 1.4913-1.4887 [Tentative – confirmation required] (Stop loss: dependent on where one confirms this area).
AUD/USD:
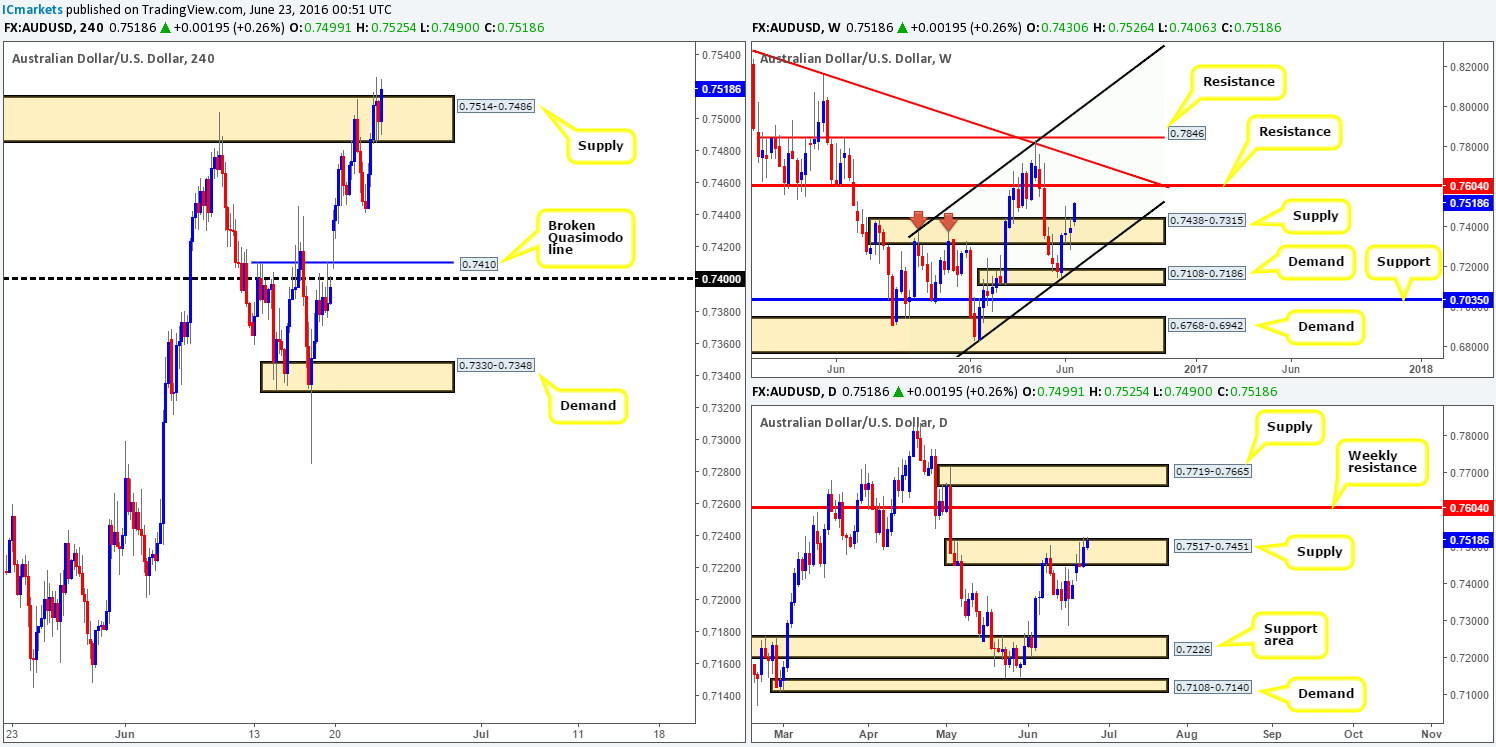
Starting from the top this morning, it’s clear that the Aussie bulls remain on the offensive as price is now seen trading above weekly supply drawn from 0.7438-0.7315, and looks to be heading in the direction of weekly resistance at 0.7604. Meanwhile, down on the daily timeframe the commodity currency is flirting with the upper edge of daily supply coming in at 0.7517-0.7451. The bears look incredibly weak here in our opinion and we feel it’s only a matter of time before a close above this area is seen, which will open the doors for price to challenge the aforementioned weekly resistance level.
Looking over to the H4 chart, supply at 0.7514-0.7486 is also having some difficulty at the moment. Given that the next upside target beyond this area is the 0.76 handle, which converges perfectly with weekly resistance at 0.7604, longs are certainly a possibility above the current H4 supply.
Our suggestions: Watch for price to close above H4 supply at 0.7514-0.7486 and look to trade any retest seen thereafter (lower timeframe confirmation required), targeting 0.76. To confirm bullish interest, we usually look for either an engulf of a supply followed by a retest, a trendline break/retest or simply a collection of well-defined buying tails around the higher timeframe area.
Levels to watch/live orders:
- Buys: Watch for price to close above H4 supply at 0.7514-0.7486 and look to trade any retest seen thereafter (lower timeframe confirmation required)
- Sells: Flat (Stop loss: N/A).
USD/JPY:
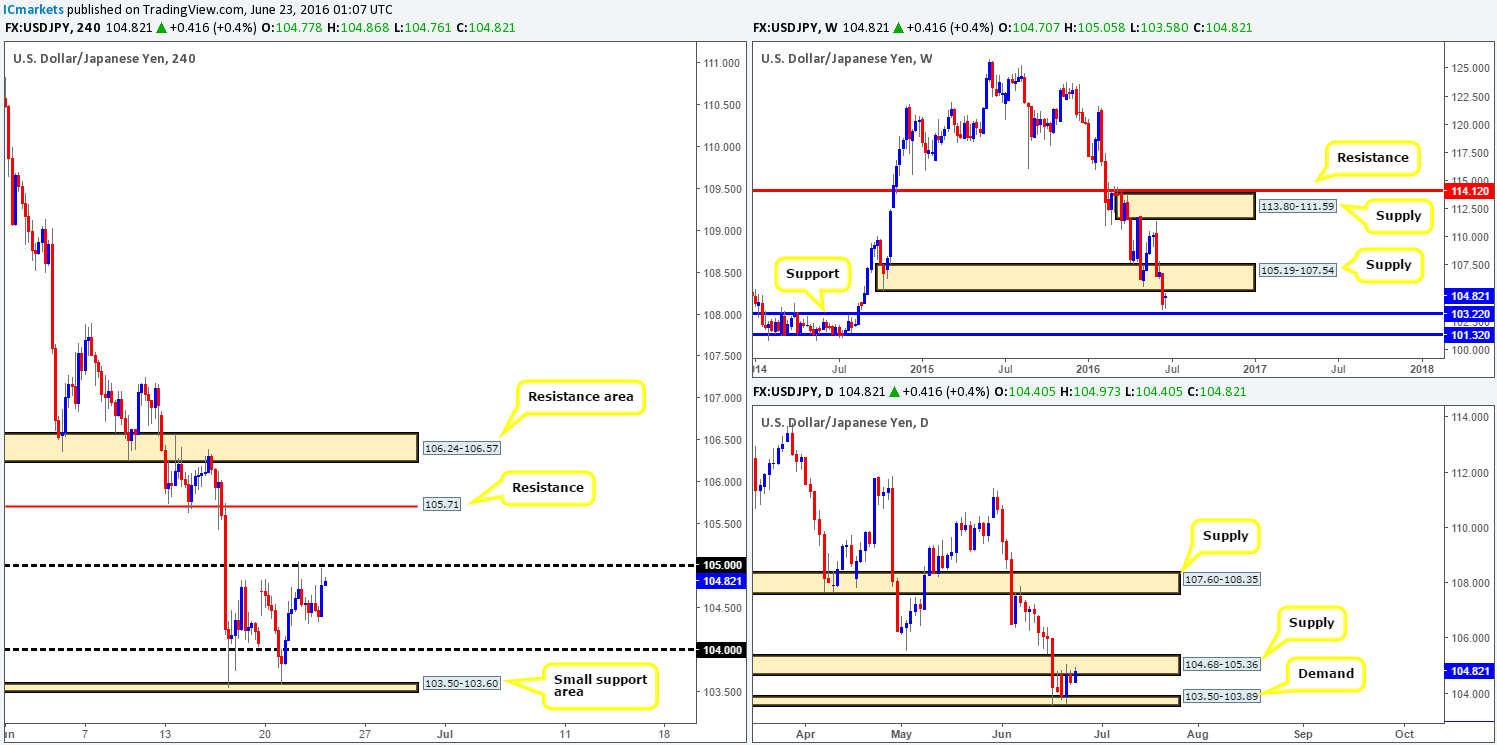
Reporting directly from the weekly chart this morning, the USD/JPY shows price loitering between a large weekly supply zone drawn from 105.19-107.54 and a weekly support coming in at 103.22. With the trend predominantly pointing south at the moment, we have placed more weight on the aforementioned weekly supply area. Sliding down into the daily chart, price is seen hugging the underside of daily supply penciled in at 104.68-105.36 (glued to the underside of weekly supply at 105.19-107.54).
Jumping across to the H4 chart, however, we can see that the pair is trading within touching distance of the 105 handle. This line is particularly important in our opinion since let’s not forget that it held price lower once already on Tuesday, and is immersed within the above said daily supply.
Our suggestions: One could look for shorts from 105 if price retests this handle again today, targeting the H4 mid-way point 104.50, followed closely by the 104 handle. However, do be prepared for a fakeout here as price may want to tag in offers from the lower edge of weekly supply at 105.19. As such, our team would not consider this a valid level unless lower timeframe confirmation was seen (for confirming techniques please see the top of this report).
Levels to watch/live orders:
- Buys: Flat (Stop loss: N/A).
- Sells: 105 region [Tentative – confirmation required] (Stop loss: dependent on where one confirms this area).
USD/CAD:
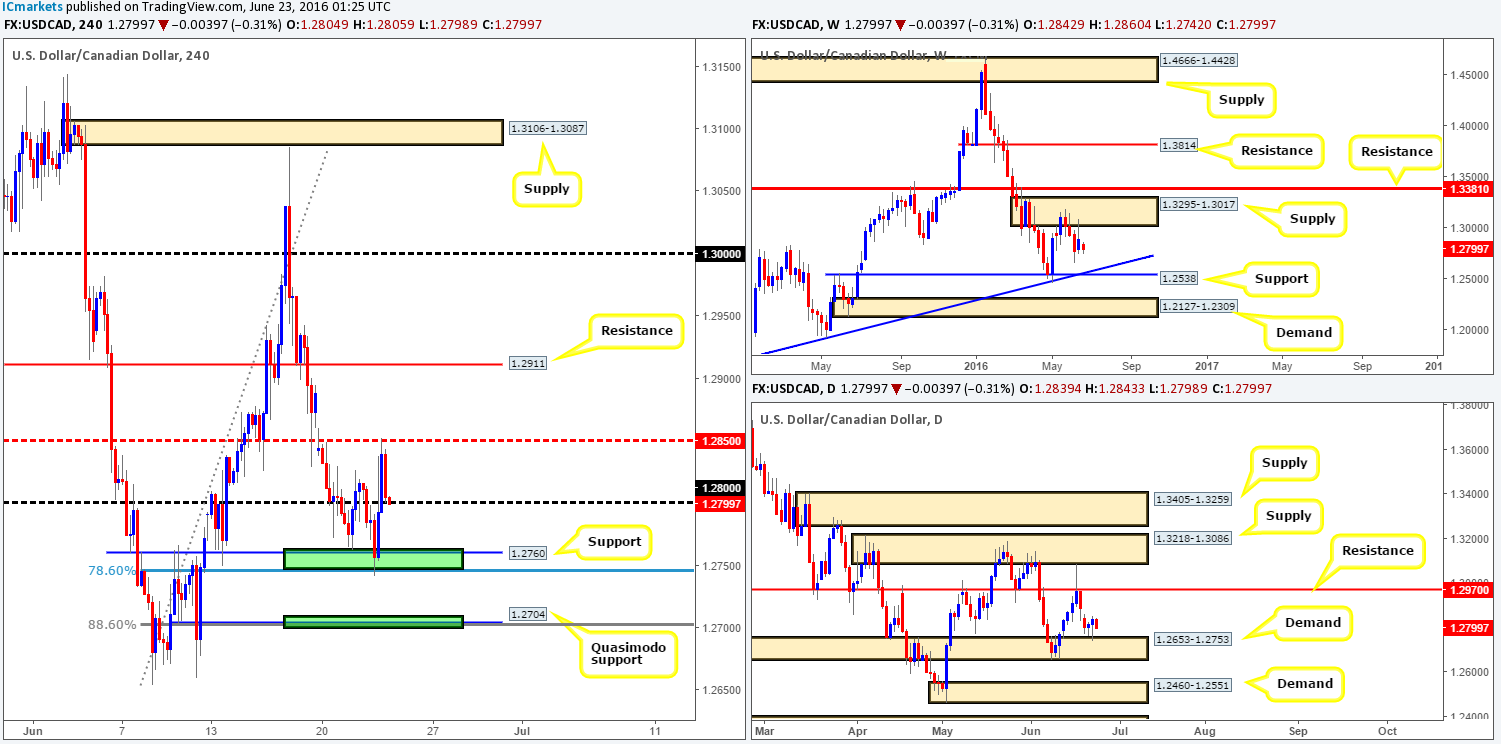
Going into yesterday’s American session, the USD/CAD once again retested the H4 support area at 1.2760/1.2704 (green zone) and bounced up to H4 mid-way resistance at 1.2850 on the back of US oil inventories data. Consequent to this, psychological resistance 1.28 was taken out and is, as you can see, now being retested as support.
With offers seen holding firm from weekly supply at 1.3295-1.3017, and bids controlling this pressure from daily demand at 1.2653-1.2753, there is clearly somewhat of a tug-of-war taking place between these two higher timeframe structures. As a result, this makes trading this pair difficult as we effectively have no joint higher timeframe direction as far as structure is concerned right now.
Our suggestions: Personally, the only area that really stands out to us is the H4 Quasimodo support seen below at 1.2704. Not only does this line also represent a round number at 1.27, but it also fuses well with a H4 88.6% Fib support at 1.2703 and is positioned within daily demand mentioned above at 1.2653-1.2753. Trading this line would of course mean going against weekly selling, so we would strongly advise not placing pending orders here! Instead, wait for price to reach the buy line and then begin hunting on the lower timeframes for reasonable buying strength (for lower timeframe confirming techniques please see the top of this report) to make your final decision on whether the trade is worth the risk.
Levels to watch/live orders:
- Buys: 1.2700 region [Tentative – confirmation required] (Stop loss: dependent on where one confirms this area).
- Sells: Flat (Stop loss: N/A).
USD/CHF:
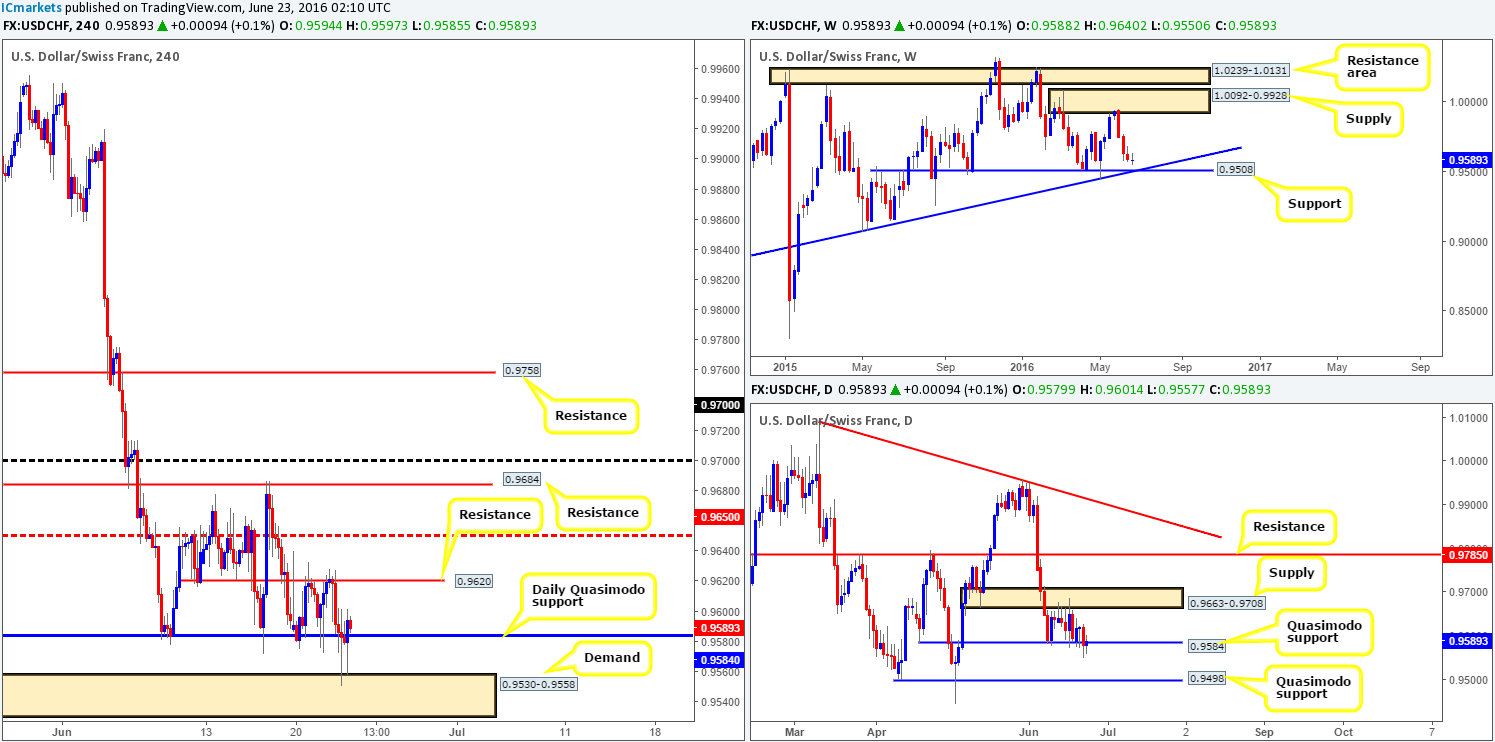
This morning’s analysis will kick-off with a look at the weekly chart this morning. Since the Swissy came into contact with weekly supply seen at 1.0092-0.9928, the bears have been in control of this market. In view of there being little weekly support to stop price from continuing to trade lower, weekly support drawn from 0.9508 (coincides nicely with weekly trendline confluence taken from the low 0.9078) is likely to be tagged very soon!
The buyers over on the daily chart are now showing signs of weakness around the daily Quasimodo support at 0.9584, which held price higher since the 8th June. In the event that bids completely give way here, the path south appears clear for a push down to the 0.9498 region – another daily Quasimodo support.
As can be seen from the H4 chart, price is currently being supported by a H4 demand at 0.9530-0.9558. This could, by the looks of things, push the candles back up to retest H4 resistance at 0.9620 today where we believe price will once again struggle.
Our suggestions: Quite frankly, we see very little on this chart that interests us today. Structure is tight on the H4 with little room seen to move and given the fact that higher timeframe structure is not trading in unison, this pair may be best left on the back of the shelf today.
Levels to watch/live orders:
- Buys: Flat (Stop loss: N/A).
- Sells: Flat (Stop loss: N/A).
DOW 30:
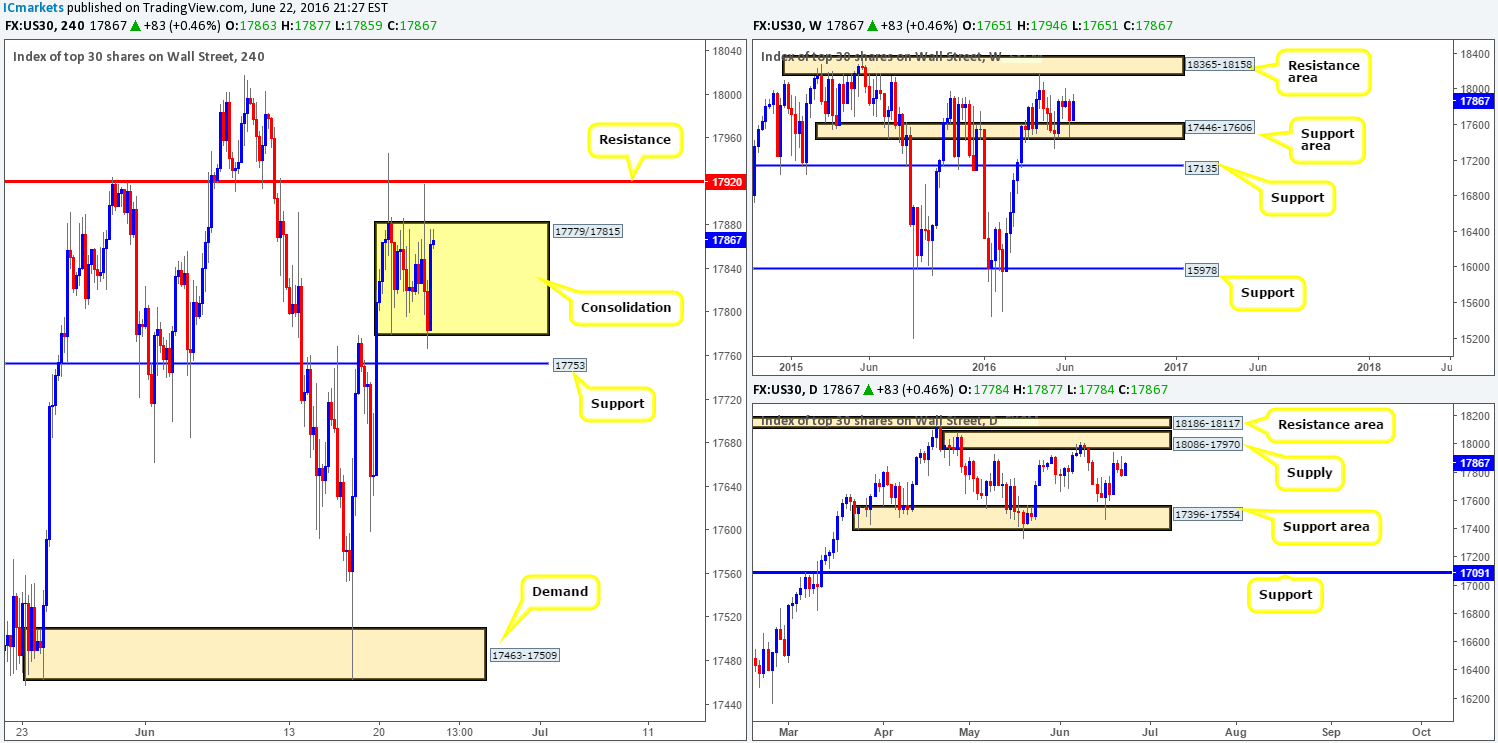
To our way of seeing things, the DOW is now in the process of chiseling out a H4 consolidation zone fixed between 17779/17815. Surrounding this box is a H4 resistance at 17920 and a H4 support seen just below at 17753, which are, as far as we can see, beautiful barriers for price to fakeout to from the current H4 range. Despite this ranging action, weekly bulls appear in strong form at the moment following a bounce from the weekly support area seen at 17446-17606 and shows room to continue north up to a weekly resistance zone at 18365-18158. On the other side of the ledger, however, daily price is seen hovering just ahead of daily supply coming in at 18086-17970 which already held this market lower once already back on the 9th June.
Our suggestions: With the higher timeframes showing conflicting signals at the moment, and the H4 currently lodged within a range, we have no intention of risking capital in this market right now as we see no clear path for price to trade.
Levels to watch/live orders:
- Buys: Flat (Stop loss: N/A).
- Sells: Flat (Stop loss: N/A).
GOLD:
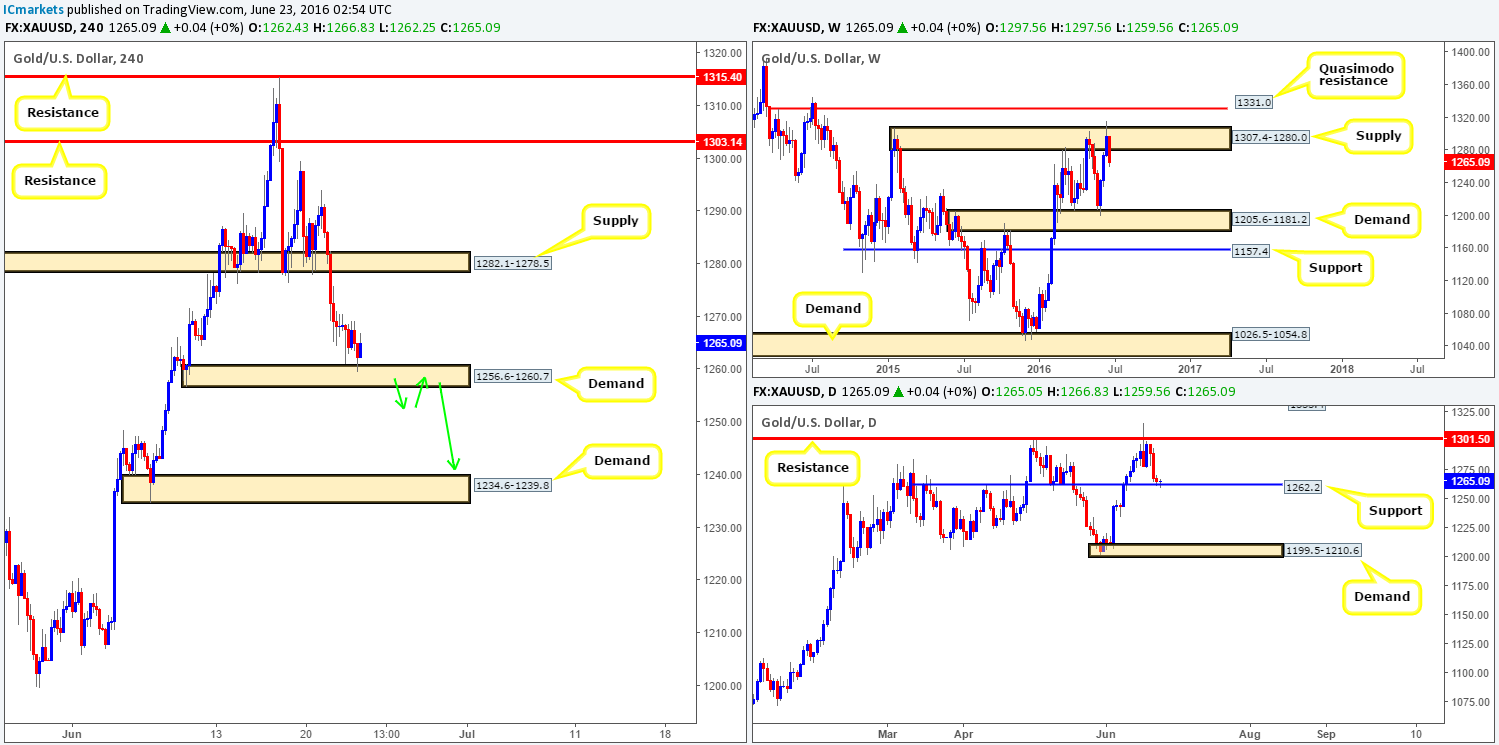
After price connected with weekly supply at 1307.4-1280.0, the weekly bears look to be in a very strong position ahead of the EU referendum. On the assumption that offers remain in good shape, we could see the yellow metal drive down to retest weekly demand at 1205.6-1181.2. Before gold can be sold further, nevertheless, daily support at 1262.2 will need to be taken out. This, in our estimation, is the last barrier of defense for the bulls on the higher timeframes. Beyond this line the runway south looks to be relatively clear down to daily demand coming in at 1199.5-1210.6 which sits on top of the aforementioned weekly demand area.
With H4 price also now seen teasing the top-side of a H4 demand base at 1256.6-1260.7 (surrounds the current daily support line), where does one go from here? Well, as we mentioned in yesterday’s report, given the position price is in on the weekly chart (see above) we are not willing to take longs in this market for now.
Our suggestions: Watch for a close beyond the current H4 demand base, as the path below here seems clear down to at least H4 demand at 1234.6-1239.8. To trade this setup, a retest to the underside of the broken H4 demand would need to be seen (green arrows), followed by a lower timeframe sell signal (see the top of this report for entry techniques).
Levels to watch/live orders:
- Buys: Flat (Stop loss: N/A).
- Sells: Watch for price to consume 1256.6-1260.7 and look to trade any retest seen thereafter (lower timeframe confirmation required).


