A note on lower timeframe confirming price action…
Waiting for lower timeframe confirmation is our main tool to confirm strength within higher timeframe zones, and has really been the key to our trading success. It takes a little time to understand the subtle nuances, however, as each trade is never the same, but once you master the rhythm so to speak, you will be saved from countless unnecessary losing trades. The following is a list of what we look for:
- A break/retest of supply or demand dependent on which way you’re trading.
- A trendline break/retest.
- Buying/selling tails/wicks – essentially we look for a cluster of very obvious spikes off of lower timeframe support and resistance levels within the higher timeframe zone.
- Candlestick patterns. We tend to only stick with pin bars and engulfing bars as these have proven to be the most effective.
We search for lower timeframe confirmation between the M15 and H1 timeframes, since most of our higher-timeframe areas begin with the H4. Stops are usually placed 5-10 pips beyond confirming structures.
EUR/USD:
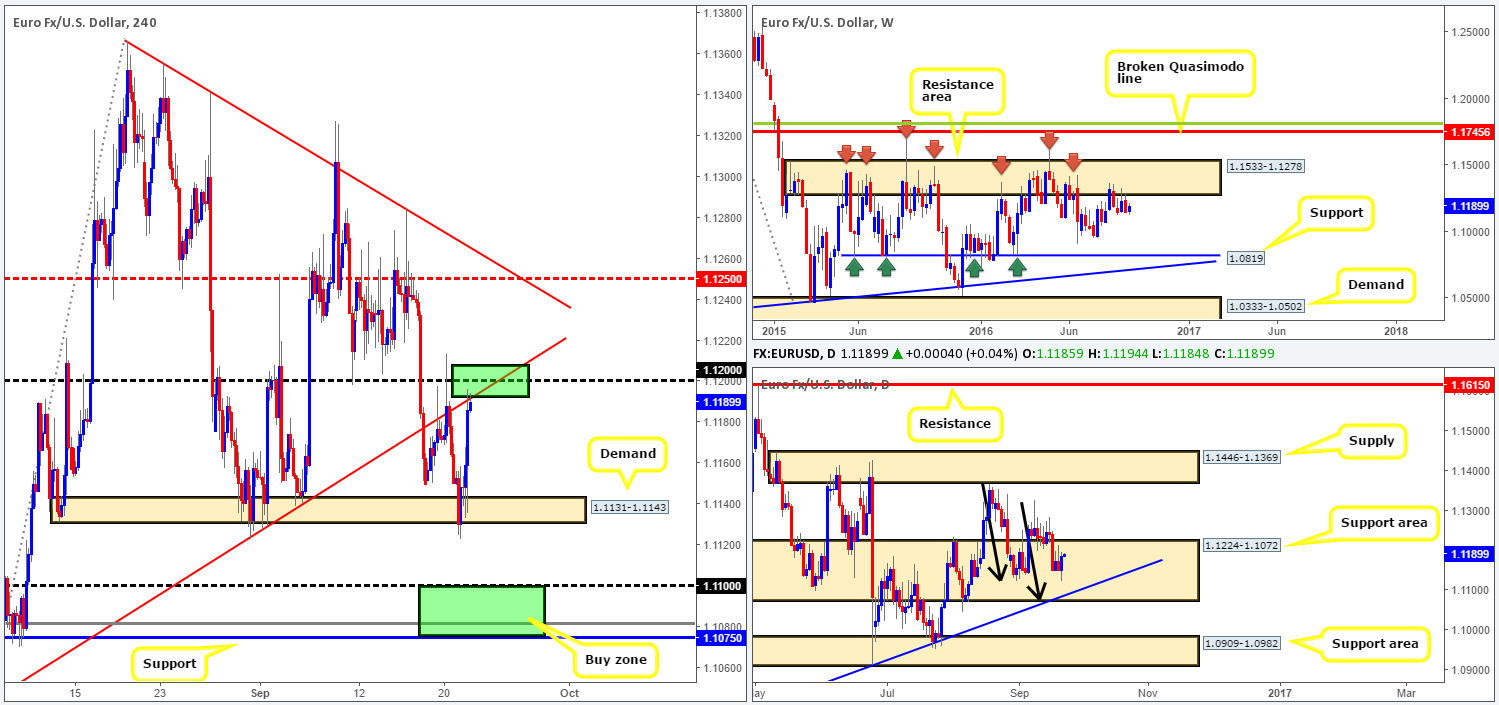
The EUR/USD attracted fresh buyers into the market yesterday from a H4 demand logged in at 1.1131-1.1143, following the Fed’s decision to leave monetary policy unchanged. This, as you can see from the H4 chart, saw prices eventually cross swords with a trendline resistance taken from the low 1.1045. United with a nearby psychological hurdle seen at 1.12, the team feels bids will likely weaken from this vicinity today.
Although the 1.12 handle deserves attention, we would still exercise caution here! On the daily chart, the candles are currently lurking within a support area seen at 1.1224-1.1072. However, as we’ve mentioned in previous writings, there’s been little noteworthy bullish intent registered from this barrier. Perhaps the most compelling factor here is that the candlesticks are in the process of completing an AB=CD bull pattern (black arrows) which terminates around the lower edge of the above said support area, and also converges with a trendline support extended from the low 1.0516. In addition to this, weekly action remains trading around the underside of a major resistance area at 1.1533-1.1278, thus increasing the chances of a selloff being seen.
Our suggestions: All in all, our team is looking for prices to weaken from the 1.12 neighborhood today. For us personally though, a short trade will not be permitted until a H4 bearish candle is seen. Targets for this trade fall in at the above said H4 demand, followed by the H4 support at 1.1075 and the 1.11 band (green zone). Not only is 1.1075/1.11 a good take-profit area for any shorts in this market, it’s also a fantastic barrier to look for longs. It sits within the depths of the aforementioned daily support area, as well as merging with both the above noted daily trendline support and a deep H4 88.6% Fib support at 1.1081. Although the H4 buy zone will very likely bounce price, do keep in mind that by entering long from here you’re effectively buying into weekly flow.
Levels to watch/live orders:
- Buys: 1.1075/1.11 [strong-looking buy zone which could, dependent on the time of day and approach, be sufficient enough to condone an entry without waiting for lower timeframe confirmation] (Stop loss: 1.1060).
- Sells: 1.12 [H4 bearish close required] (Stop loss: beyond the trigger candle).
GBP/USD:
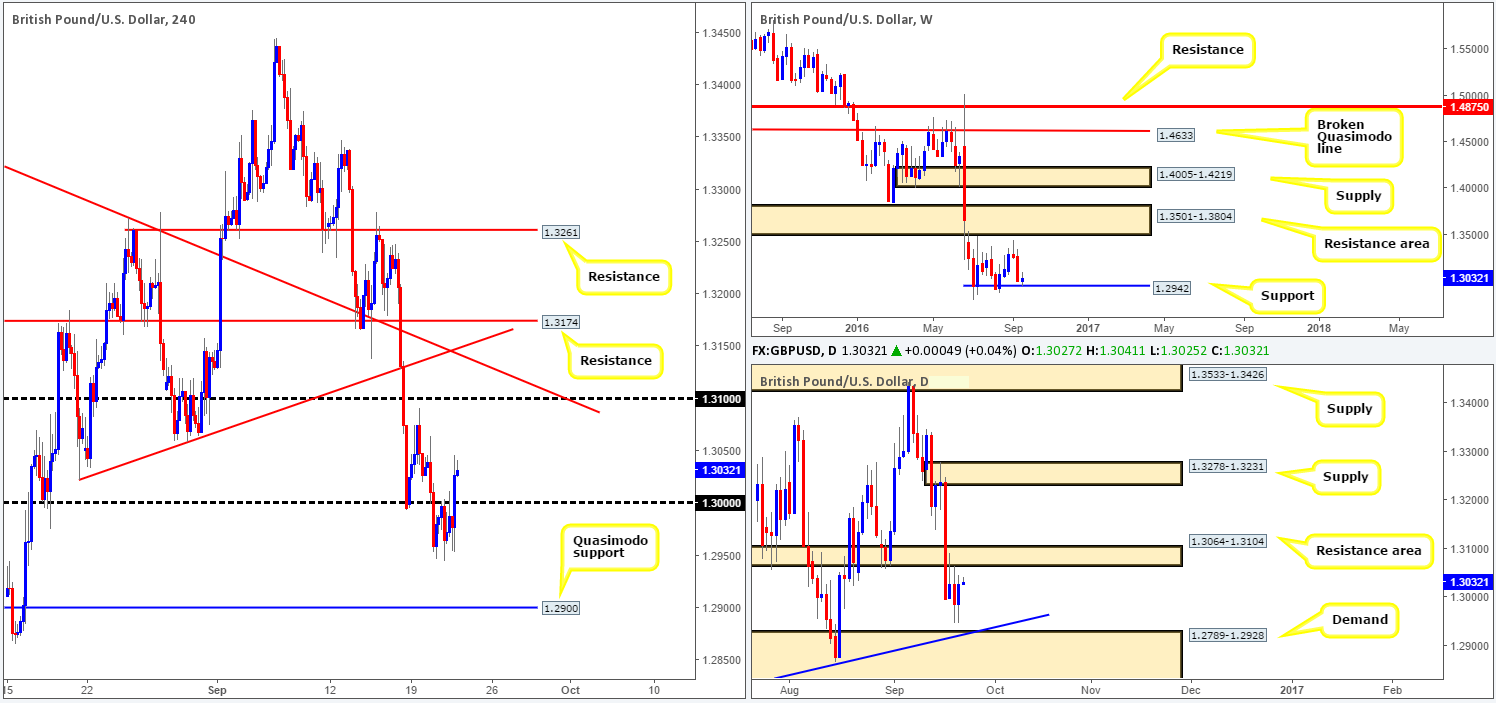
The after-effects of yesterday’s Fed meeting (rates were left unchanged) saw the GBP appreciate against the US dollar. This advance, as you’ll see on the weekly chart, was triggered three pips ahead of support registered at 1.2942 and ended the day closing prices above the key figure 1.30 on the H4 chart. While a retest of 1.30 and a continuation move north seems logical, given how close weekly price came to testing weekly support yesterday, one has to also take into account that there’s a nearby daily resistance area seen overhead at 1.3064-1.3104.
Our suggestions: Regardless of 1.30 being attractive or not, we would not consider this number a valid buy zone should price connect with the underside of the daily resistance area before tapping 1.30. Should the psychological handle see some action today (prior to connecting with the daily area), our team would, on the condition that a reasonably-sized H4 bullish candle is seen, look to jump in long here, targeting the underside of the daily zone as an immediate take-profit range.
On the data front guys, we would advise caution around 1pm GMT and 5pm GMT today as two MPC members, along with the BoE Gov. Carney, take to the stage.
Levels to watch/live orders:
- Buys: 1.30 region [H4 bullish close required] (Stop loss: beyond the trigger candle).
- Sells: Flat (Stop loss: N/A).
AUD/USD:
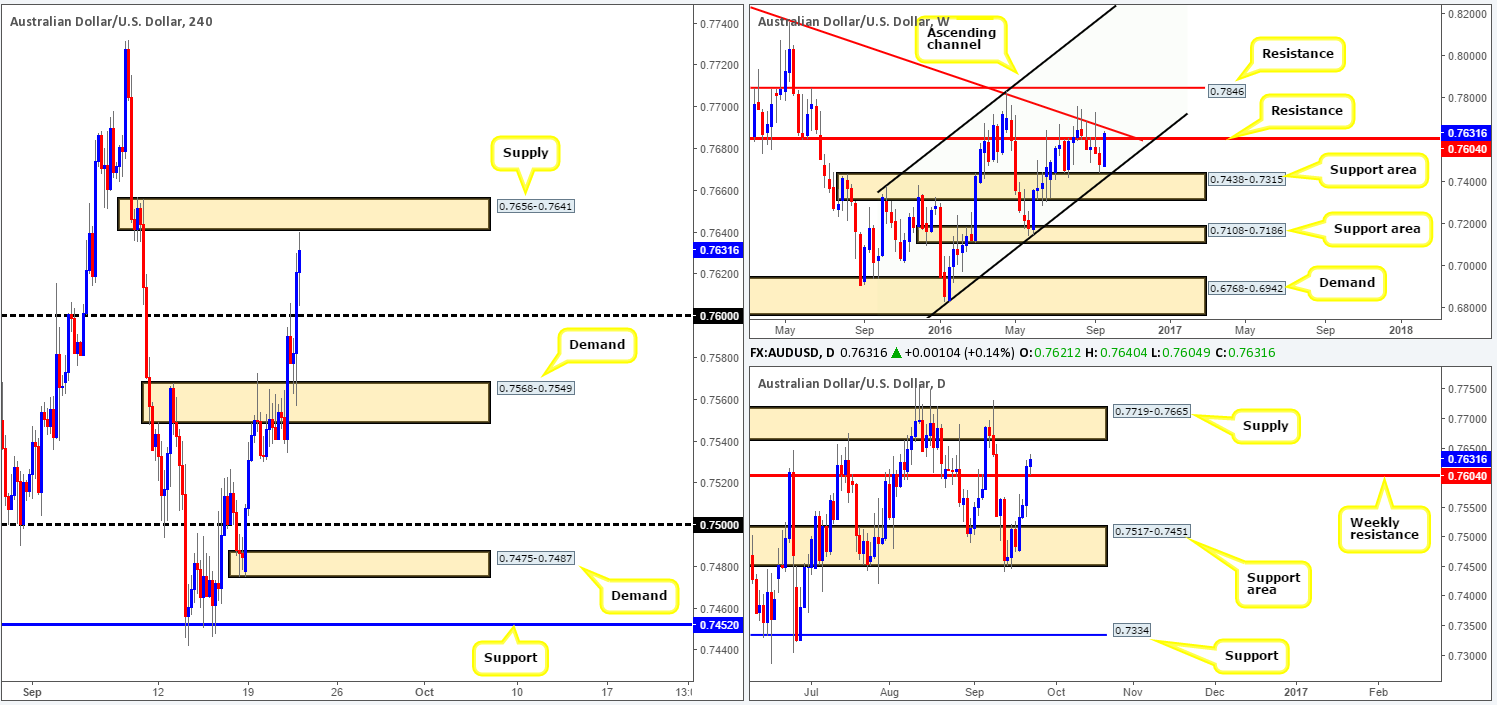
Going into the early hours of yesterday’s European session, the commodity-backed currency walloped its way through H4 supply seen at 0.7568-0.7549 and tagged the 0.76 handle. However, following this, the Fed took the spotlight and left rates unchanged. This, as a result, saw the Aussie tap the top edge of the recently broken H4 supply as demand and aggressively take out the 0.76 hurdle.
Further buying, however, was seen during the early hours of this morning, consequently bringing prices up to a H4 supply area coming in at 0.7656-0.7641. This supply converges with a weekly trendline resistance taken from the high 0.8295, and also sits just below daily supply seen at 0.7719-0.7665.
Our suggestions: Despite weekly price recently breaking above resistance at 0.7604, there is, as we’ve highlighted above in bold, a sufficient amount of supply still seen in this market. As such, our prime focus today will be on the current H4 supply zone. Given that price may fake above this area to tag in offers sitting at the overhead daily supply, waiting for at least a reasonably-sized H4 bearish close is something we would certainly advise doing, prior to selling from this neighborhood.
Levels to watch/live orders:
- Buys: Flat (Stop loss: N/A).
- Sells: 0.7656-0.7641 [H4 bearish close required] (Stop loss: beyond the trigger candle).
USD/JPY:
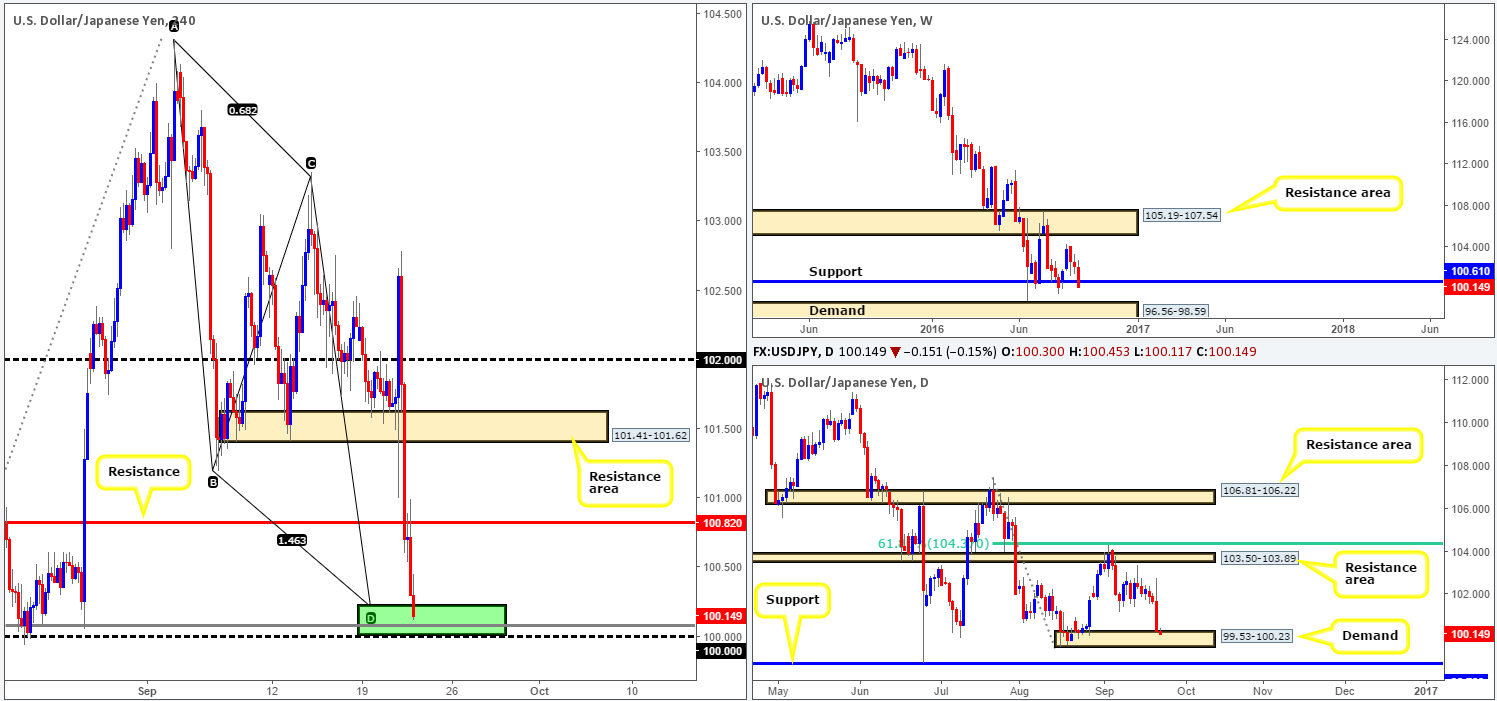
Thanks to both the BoJ and the Fed yesterday, the USD/JPY couple dropped close to 140 pips on the day (open/close). Several H4 technical supports were wiped out during the bearish onslaught, leaving price closing the day ahead of the key figure 100.00. Taking into consideration that 100.00 ties in nicely with a H4 88.6% Fib support at 100.07, a H4 AB=CD completion point at 100.21 and is also now seen treading water within a daily demand base seen at 99.53-100.23, we feel the pair is likely to reverse tracks sometime today.
Our suggestions: Should one deem the 100.00/100.21 range (green zone) a stable enough area to enter at market from, we would advise being conservative with your stops and placing them beyond the current daily demand area around the 99.50ish range. If you’re like us, however, and prefer to wait for a H4 bullish close to form, stops could then potentially be placed below the trigger candle, thus increasing risk/reward should the trade move favorably.
Levels to watch/live orders:
- Buys: 100.00/100.21 [H4 bullish close required] (Stop loss: beyond the trigger candle).
- Sells: Flat (Stop loss: N/A).
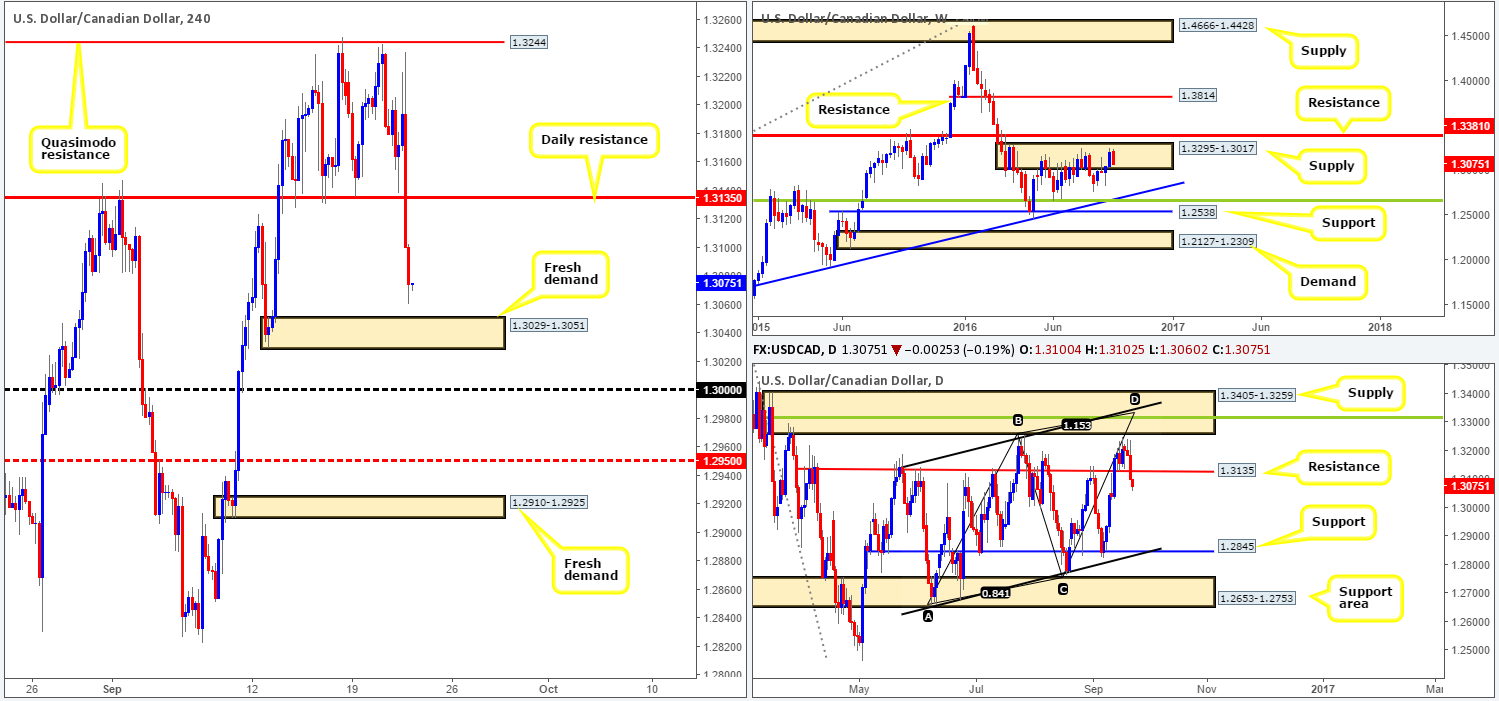
USD/CAD:
The Fed’s decision to leave interest rates unchanged yesterday sent the USD/CAD screaming lower. Daily support at 1.3135 was absolutely demolished, with current prices now seen trading just ahead of a fresh H4 demand base at 1.3029-1.3051. Now, buying from this H4 demand area is certainly attractive given how fresh it is. However, when we throw the higher timeframes into the mix, this H4 demand zone no longer looks as appealing. Weekly price is seen selling off from within a supply zone carved in at 1.3295-1.3017, while daily support at 1.3135, as we mentioned above, was also taken out. This – coupled with room seen for this unit to move lower on both the weekly and daily charts, suggests we may see the current H4 demand base taken out today.
Our suggestions: Do the above points mean that our team is looking for shorts beyond the H4 demand? With the key figure 1.30 lurking just below this area, we would not look to short the break of this H4 demand. To become sellers in this market, a decisive close below/retest of 1.30 would need to be seen, targeting the H4 mid-way support 1.2950, followed closely by another H4 fresh demand sitting at 1.2910-1.2925.
Levels to watch/live orders
- Buys: Flat (Stop loss: N/A).
- Sells: Watch for price to close beyond 1.30 and then look to trade any retest seen thereafter [waiting for a H4 bearish close following the retest is preferred] (Stop loss: beyond the trigger candle).
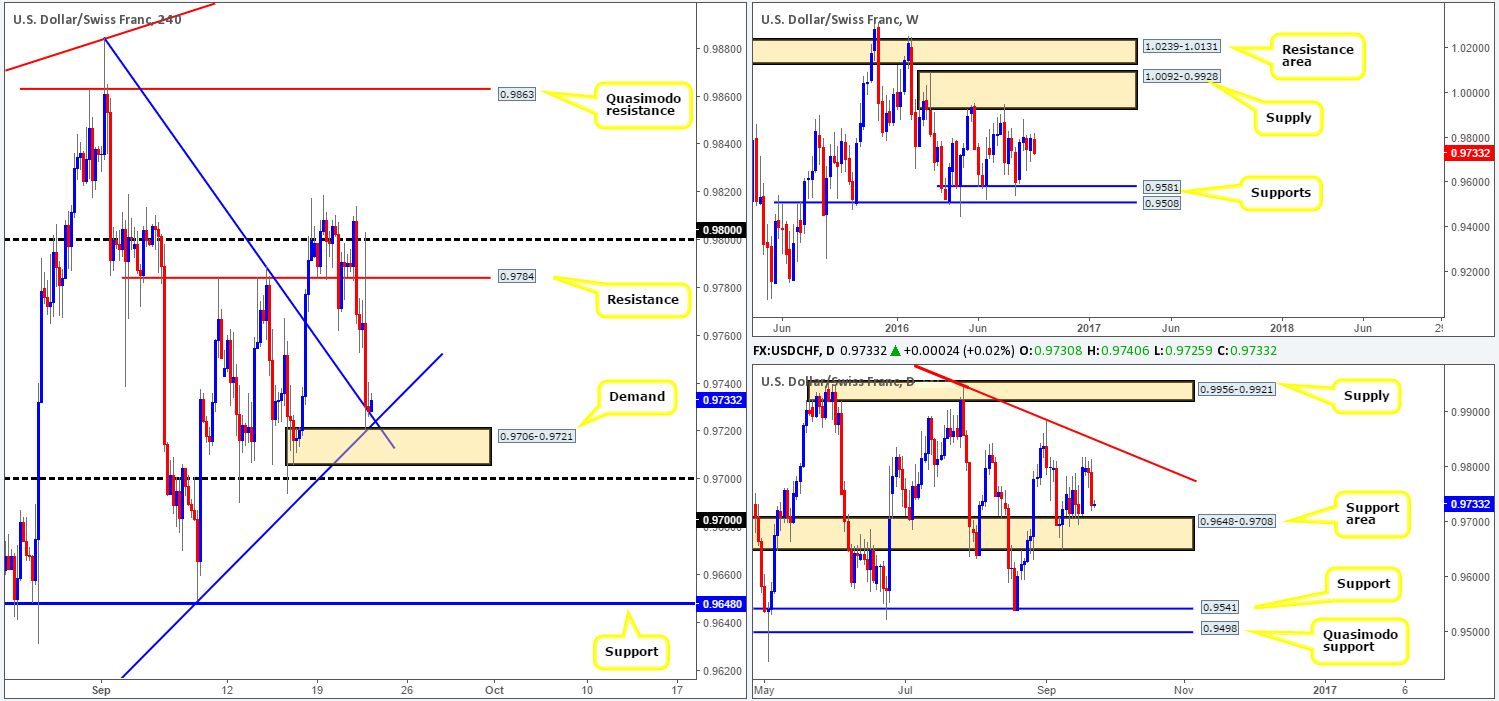
USD/CHF:
The impact of the Fed’s decision to leave monetary policy in place pressured the USD/CHF lower yesterday. As is evident from the H4 chart, the unit only begun to stabilize once prices connected with a H4 demand at 0.9706-0.9721, that’s bolstered by two H4 trendline supports (0.9884/0.9537) and a daily support area at 0.9648-0.9708. Although there is ample evidence to suggest a reversal may take place from here today, we cannot help thinking that price will fake below the current H4 demand to tag in bids sitting around the nearby 0.97 handle before taking off north.
Our suggestions: Personally, we’d rather miss the trade off the current H4 demand than having to sit through possible drawdown if price did decide to fake lower to test 0.97 today. With that being the case, today’s spotlight will firmly be focused on 0.97 for longs. The fakeout down to 0.97, should it take place, will likely be aggressive. Therefore, one may not have time to wait for lower timeframe confirmation to form (see the top of this report). That said, the best we feel one can do here in regards to waiting for confirmation is simply wait for a reasonably-sized H4 bull candle to form off 0.97, and place stops beyond the trigger candle. Depending on when the fakeout takes place, we’d likely look to take a portion of our position off the table around the above said H4 trendlines, and then allow the remaining position to run up to H4 resistance 0.9784/0.98 handle.
Levels to watch/live orders:
- Buys: 0.97 region [H4 bullish close required] (Stop loss: beyond the trigger candle).
- Sells: Flat (Stop loss: N/A).
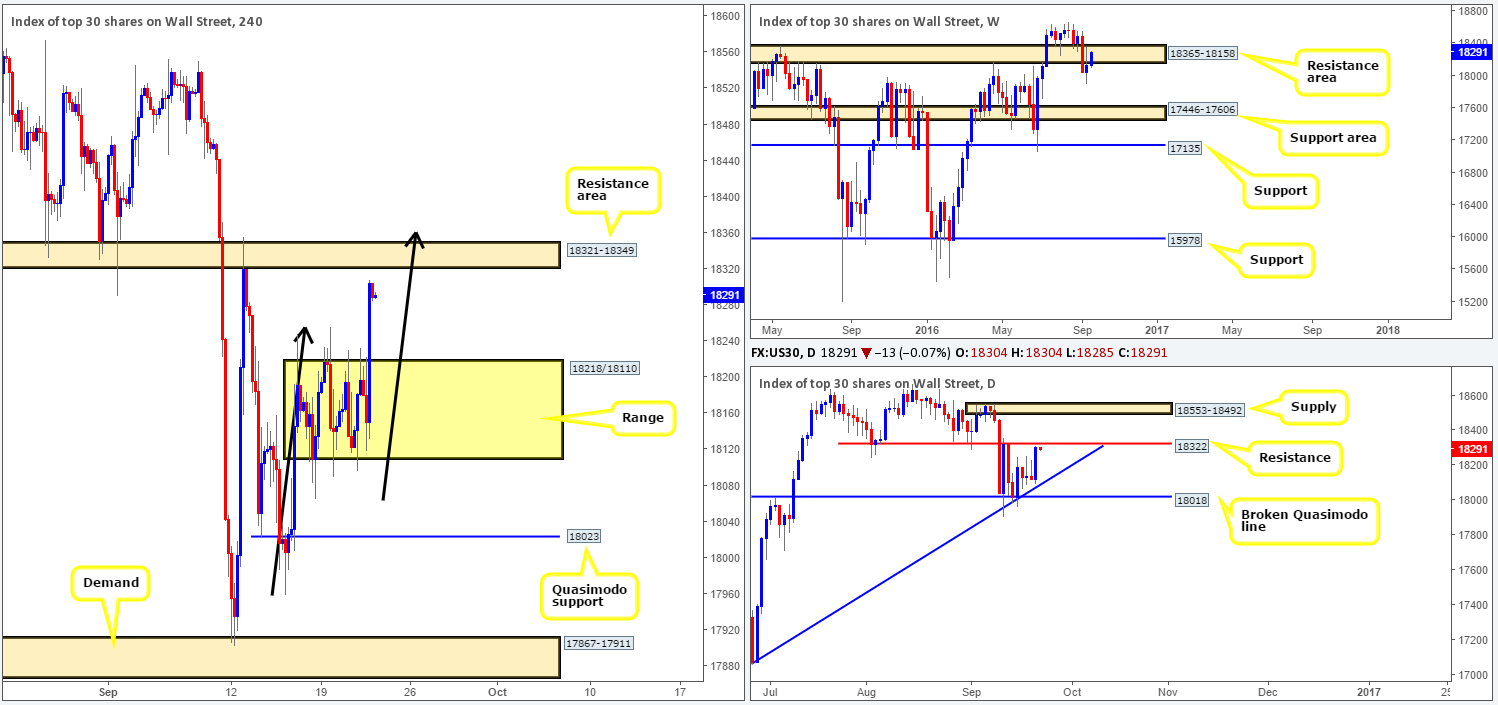
DOW 30:
US stocks rallied on the Fed’s decision to leave interest rates unchanged yesterday, consequently forcing price to breach and close above the current H4 consolidation fixed between 18218/18110. Now, what this also did was bring prices very close to a H4 resistance area at 18321-18349, which is complemented by a daily resistance level coming in at 18322 and also sits deep within a weekly resistance area seen at 18365-18158.
As you can see, all three timeframes we follow show prices are likely to reverse today – not to mention the fact that the H4 approach to the current H4 resistance area is in the form of an AB=CD pattern, terminating at 18355ish (drawn from the low 17959 – black arrows).
Our suggestions: Put simply, watch for a reasonably-sized H4 bearish close to form around the current H4 resistance zone today. Should this come to fruition, the first take-profit objective is seen at the top side of the recently broken H4 range: 18218.
Levels to watch/live orders:
- Buys: Flat (Stop loss: N/A).
- Sells: 18321-18349 [H4 bearish close required] (Stop loss: beyond the trigger candle).
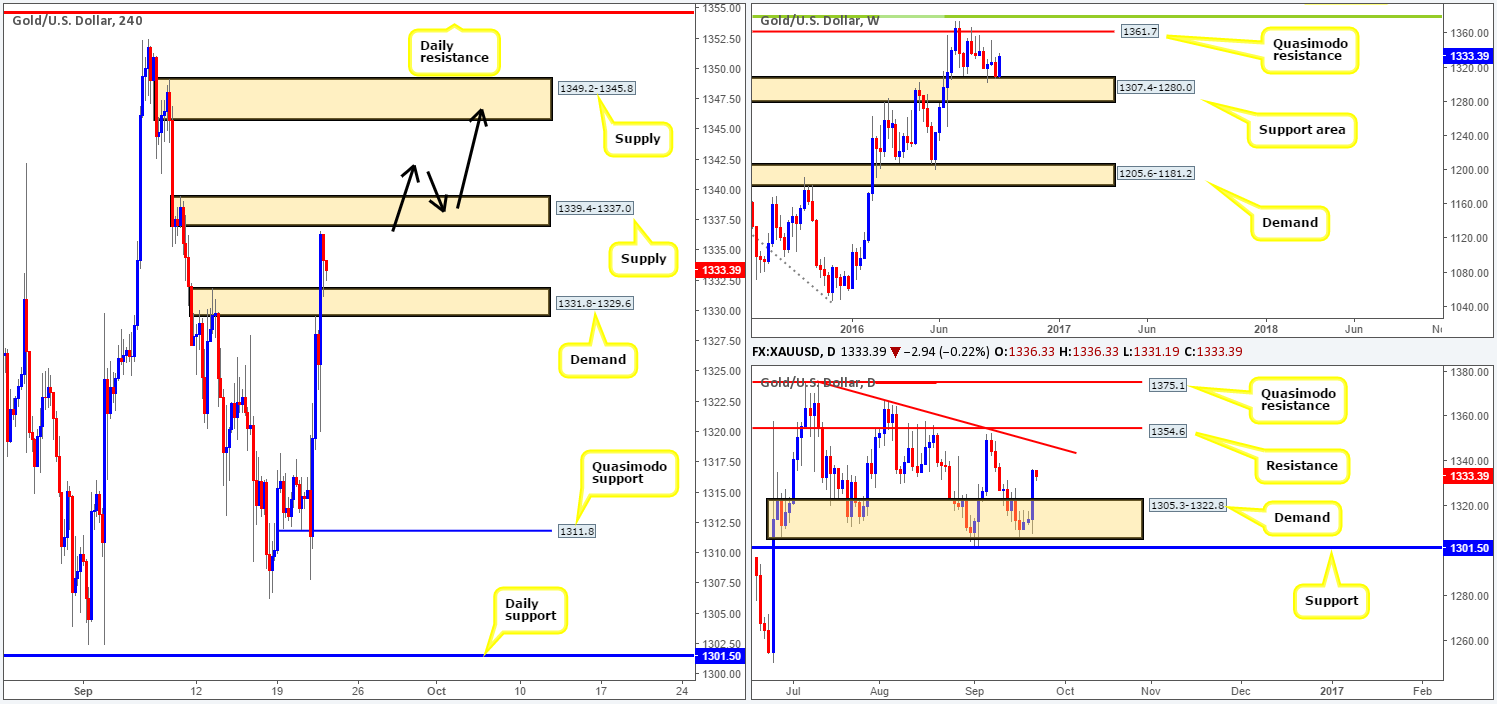
GOLD:
Starting from the top this morning, we can see that weekly bulls reacted beautifully to the top edge of a support area at 1307.4-1280.0. Assuming that this dominance continues, we could see the yellow metal strike the Quasimodo resistance at 1361.7 sometime in the near future. Moving down to the daily chart, the candles recently advanced from a demand base seen at 1305.3-1322.8, opening up the possibility of further buying towards the trendline resistance extended from the high 1375.0.
Stepping across to the H4 chart, the Fed’s decision to leave interest rates on hold yesterday pressured the dollar lower, and by extension the gold market higher. Breaching and eventually closing above H4 supply at 1331.8-1329.6, prices went on to respect the top edge of this area as demand going into the close.
Our suggestions: While prices are currently locked between a H4 demand at 1331.8-1329.6 and a H4 supply zone at 1339.4-1337.0, we feel that prices will continue to push higher from here today, given the higher-timeframe picture, (see above) and eventually break through the above said H4 supply. In the event that our analysis is correct, we’d look to buy any strong (H4 bullish close) retest seen to the top edge of 1339.4-1337.0, targeting H4 supply at 1349.2-1345.8 (see black arrows), which merges nicely with the daily trendline resistance mentioned above (also a sell zone to keep an eyeball on for a bounce).
Levels to watch/live orders:
- Buys: Watch for price to close beyond the H4 supply area at 1339.4-1337.0 and then look to trade any retest seen thereafter [waiting for a H4 bullish close to form following the retest is preferred] (Stop loss: beyond the trigger candle).
- Sells: Flat (Stop loss: N/A).


