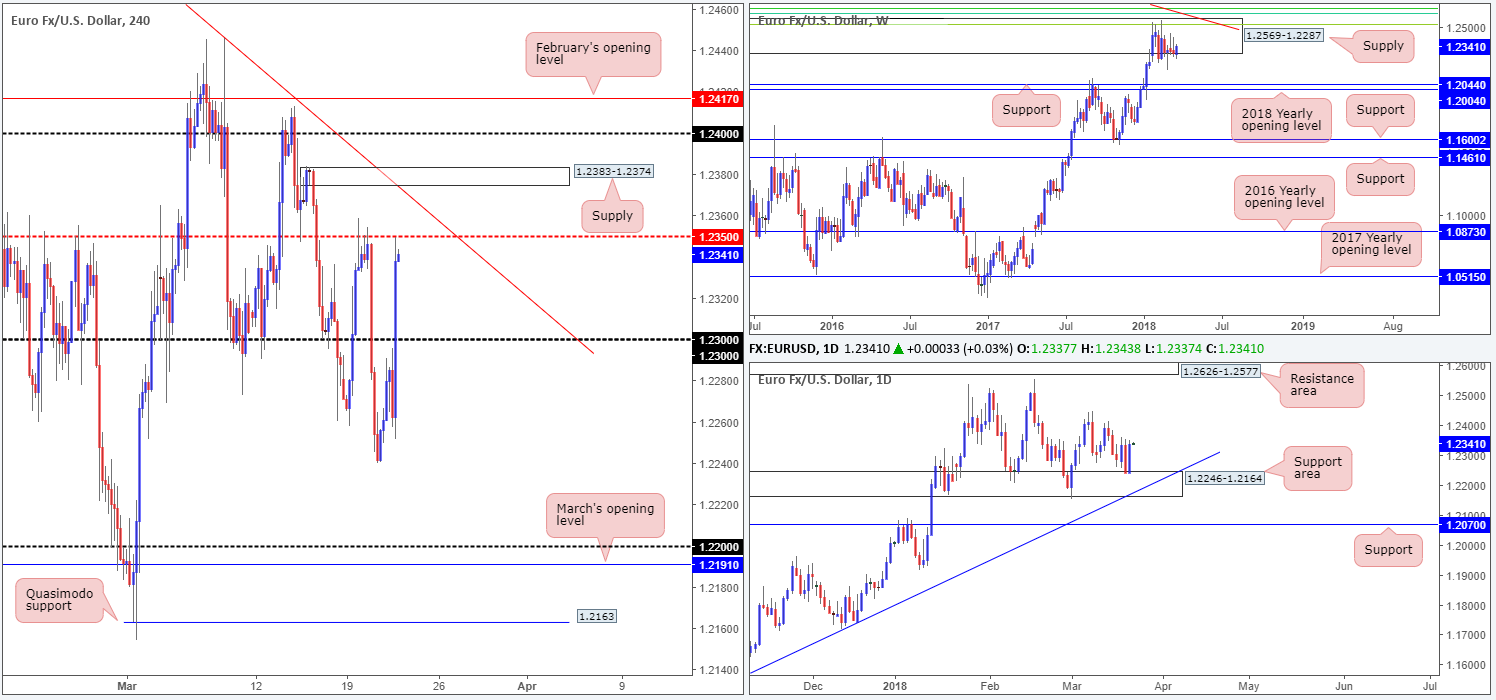
EUR/USD:
The Fed, as anticipated, raised their target interest rate to 1.50-1.75 percent on Wednesday. Ultimately, though, the market chose to latch on to the dovish aspects of the decision/press conference.
The EUR/USD snapped through orders at 1.23 and concluded trade shaking hands with the H4 mid-level resistance at 1.2350. Directly overhead, the team has noted a nearby H4 trendline resistance extended from the high 1.2555, shadowed closely by a fresh H4 supply base coming in at 1.2383-1.2374.
Technically speaking, yesterday’s advance was assisted by a familiar daily support area at 1.2246-1.2164, which, as you can see, has been in play since mid-January. On the other side of the field, nevertheless, the buyers and sellers remain battling for position within the walls of a major-league weekly supply zone at 1.2569-1.2287.
Potential trading zones:
The fresh H4 supply mentioned above at 1.2383-1.2374 is of interest this morning, given the intersecting H4 trendline resistance and surrounding weekly supply. The only grumble we see for sellers here, however, is the fact that the pair recently rebounded form a daily support area, as well as the prospect of a fakeout being seen up to 1.24.
A strong response from the noted H4 supply that prints a H4 close back below 1.2350 would be the ideal move, in our view. Traders can then think about reducing risk to breakeven and trailing price lower for profits.
Data points to consider: Eurozone manufacturing PMIs at 8-9am; US unemployment weekly claims at 12.30pm GMT.
Areas worthy of attention:
Supports: 1.23; 1.2246-1.2164.
Resistances: 1.2350; H4 trendline resistance; 1.2383-1.2374; 1.24; 1.2569-1.2287.
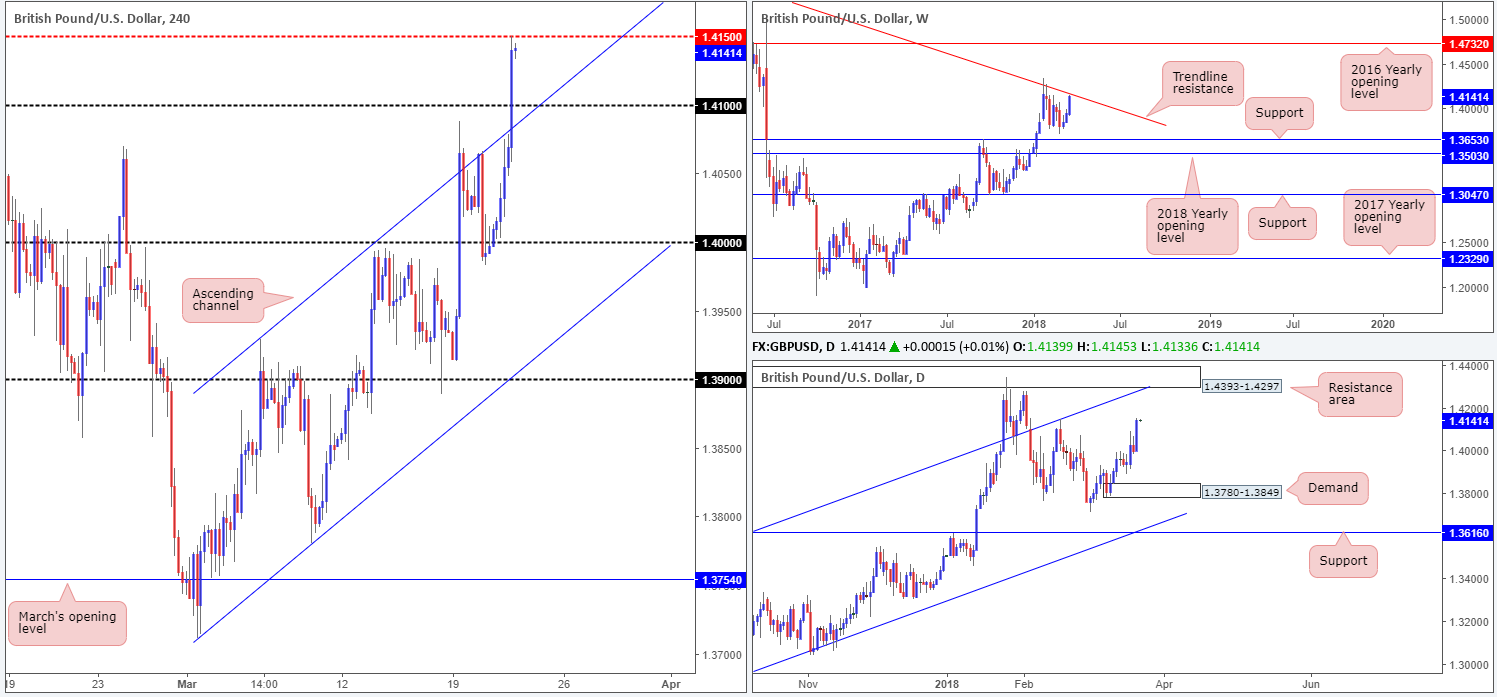
GBP/USD:
The greenback fell sharply on Wednesday following the Fed's 25bps rate hike to 1.75%. The USD retreated across the board as the FOMC failed to deliver the all-important 'dot plot' increase, holding their internal expectations at three rate hikes in 2018 instead of the four that many were expecting.
This bolstered the British pound, quickly crossing above a H4 channel resistance line (taken from the high 1.3929) and the 1.41 handle, and permitting H4 price to cross swords with the underside of a H4 mid-level resistance at 1.4150 into the close.
What this move also accomplished was positioning weekly price within striking distance of a long-term weekly trendline resistance extended from the high 1.5930. In addition to this, though, the recent move may have also set the stage for continuation buying on the daily timeframe up to a daily resistance area pegged at 1.4393-1.4297, which happens to overlap nicely with a daily channel resistance etched from the high 1.2903.
Potential trading zones:
Weekly price will not reach the weekly trendline resistance until the unit clips 1.4170ish. Therefore, traders looking to fade 1.4150 this morning may want to brace themselves for a potential fakeout! An ideal sell signal here would be a H4 bearish pin bar that pierces through 1.4150 and taps the noted weekly trendline, with an initial target objective set at 1.41.
Traders also need to keep in mind that that a possible fakeout of the weekly trendline resistance may take place, given the threat of further buying being seen on the daily timeframe. This is why we would strongly recommend waiting for a H4 bearish pin bar to form before looking to short 1.4150.
Data points to consider: MPC official bank rate votes, Monetary policy summary, official bank rate, Asset purchase facility and MPC Asset purchase facility votes at 12pm; MPC Ramsden speaks at 5pm; US unemployment weekly claims at 12.30pm GMT.
Areas worthy of attention:
Supports: 1.41; H4 channel support.
Resistances: 1.4393-1.4297; daily channel resistance; weekly trendline resistance; 1.4150.
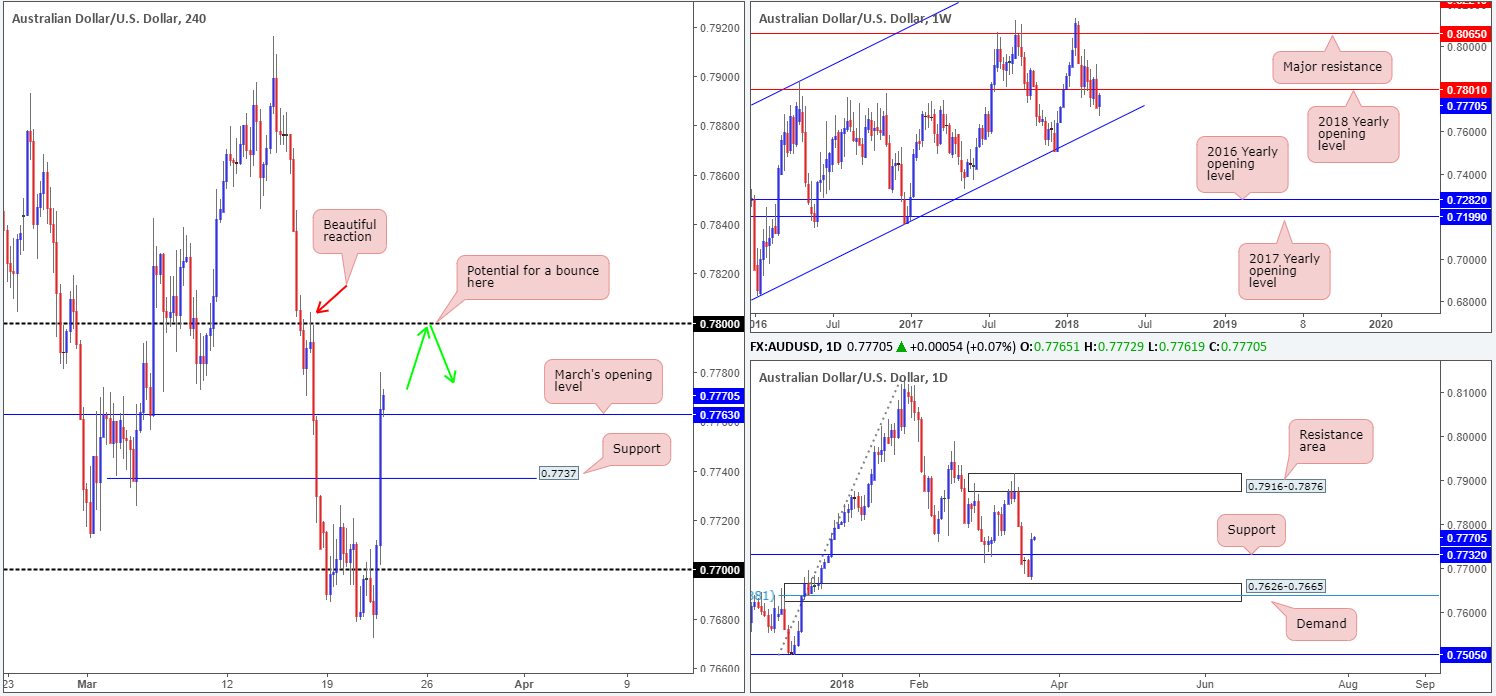
AUD/USD:
Leaving the daily demand zone plotted at 0.7626-0.7665 unchallenged, the AUD/USD popped above nearby daily resistance at 0.7732 on Wednesday and is now on track to retest the 2018 yearly opening level seen on the weekly timeframe at 0.7801.
The aftermath of yesterday’s FOMC decision saw USD selling across the board, propelling the Aussie dollar to fresh weekly highs of 0.7780. The move, as you can see, dragged the commodity currency above H4 resistance at 0.7737 and marginally beyond March’s opening level at 0.7763. The next port of call on this scale falls in at the 0.78 handle, which you may recall also represents the 2018 yearly opening level seen on the weekly timeframe.
Potential trading zones:
Seeing how well the pair held when price retested 0.78 on the 16th March (see red arrow), we feel that there’s a high probability an additional reaction could be seen. To avoid being taken out on a fakeout above 0.78 (common around psychological bands), we would strong recommend waiting for additional candle confirmation in the form of a full or near-full-bodied H4 bearish candle. This will at least give some indication of seller intent and likely reach March’s opening level as an initial take-profit target.
Data points to consider: Aussie employment figures at 12.30am; US unemployment weekly claims at 12.30pm GMT.
Areas worthy of attention:
Supports: 0.7763; 0.7732.
Resistances: 0.78; 0.7801.
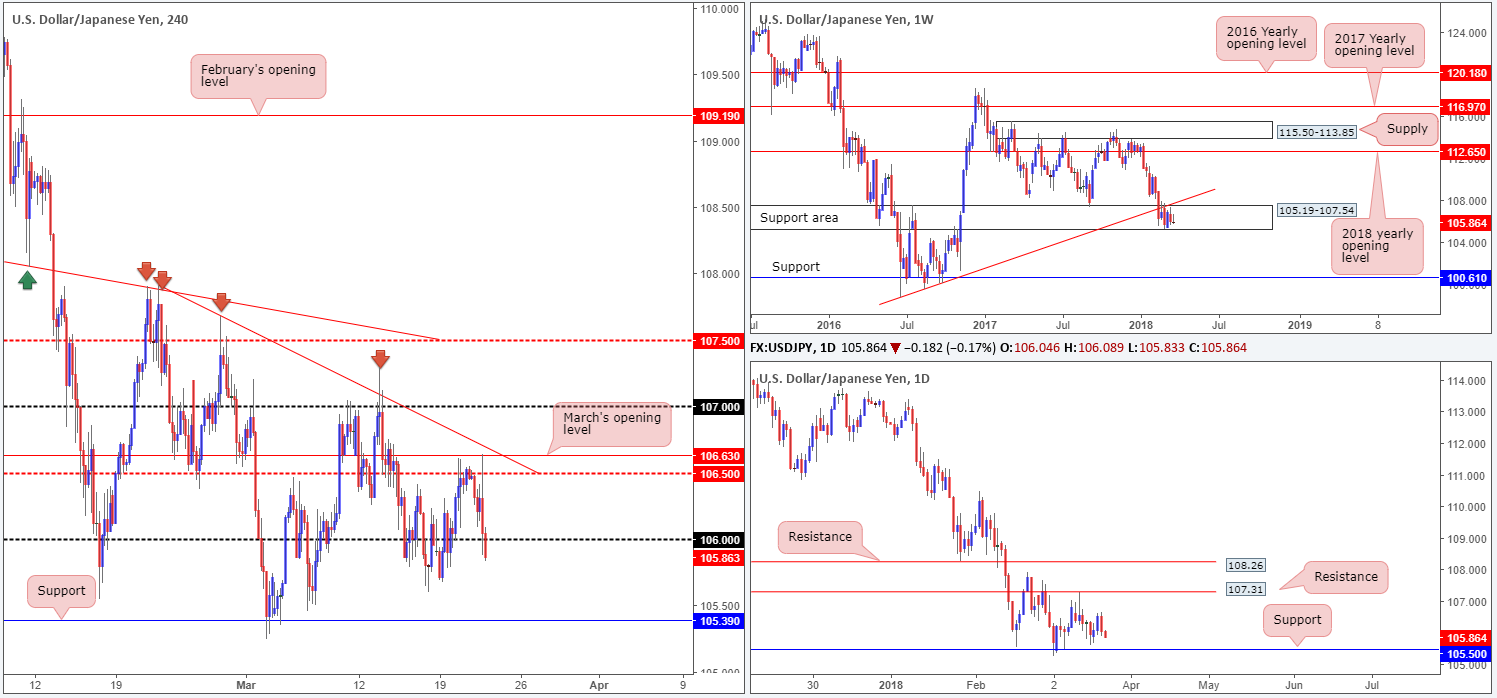
USD/JPY:
Across the board, the USD took a hit to the mid-section on Wednesday after the FOMC announced a 25bps rate hike to 1.75%. The Fed failed to deliver the all-important 'dot plot' increase, holding their internal expectations at three rate hikes in 2018 instead of the four that many were expecting.
Technically, however, the USD/JPY briefly popped above the H4 mid-level resistance 106.50 and touched gloves with March’s opening level at 106.63, before collapsing lower and challenging the 106 handle. A decisive H4 close beyond this line has the H4 support at 105.39 to target, which is sited just beneath daily support marked at 105.50. On the weekly timeframe, buyers and sellers remain battling for position between a weekly support area pegged at 105.19-107.54, and a nearby weekly trendline support-turned resistance etched from the low 98.78.
Potential trading zones:
Should H4 sellers manage to close beneath 106 this morning, an intraday sell from the underside of this line could be considered, targeting 105.50/105.39. The reason we believe this to be an intraday setup is simply because we could eventually see weekly buyers make an appearance from the current weekly support area.
Data points to consider: US unemployment weekly claims at 12.30pm GMT.
Areas worthy of attention:
Supports: 105.19-107.54; 105.39; 105.50.
Resistances: 106; weekly trendline resistance.
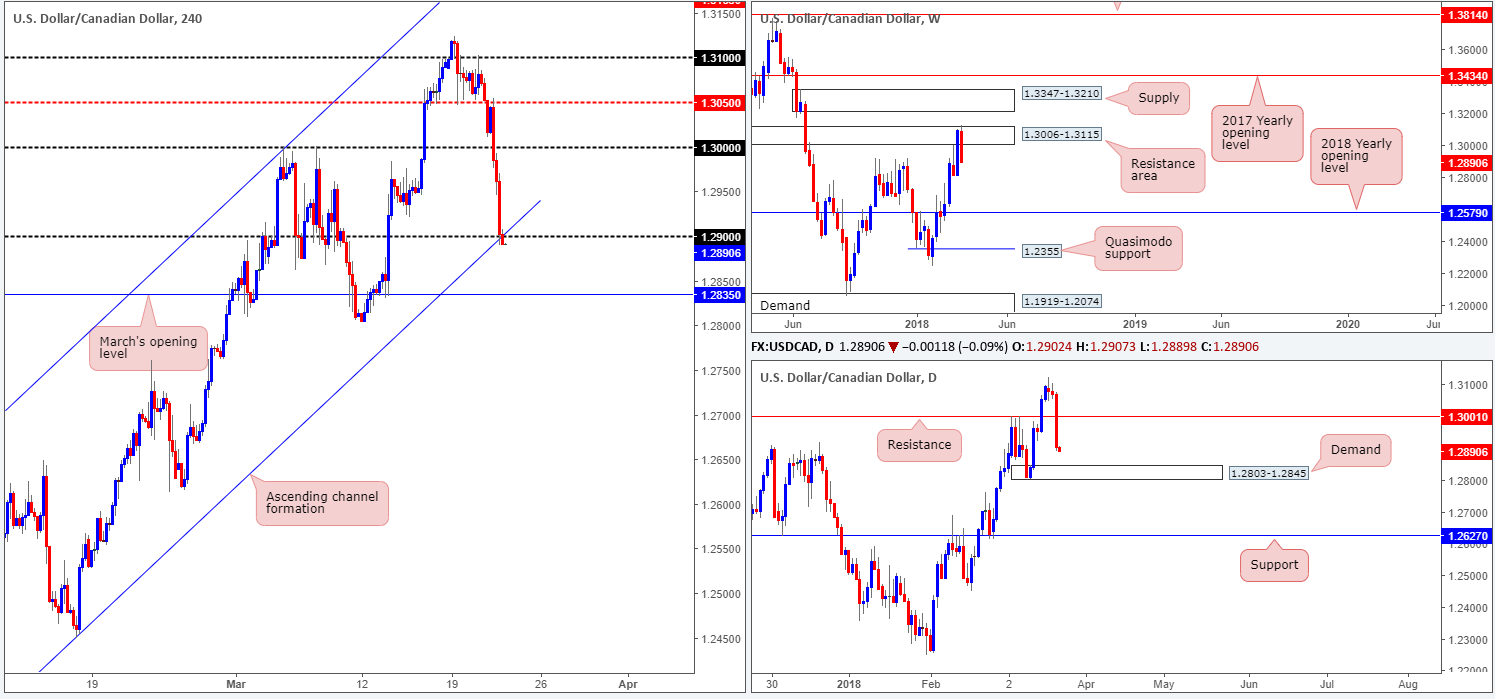
USD/CAD:
In the shape of a near-full-bodied daily bearish candle, the USD/CAD tumbled 1.33% during Wednesday’s segment. The primary catalyst came about following the Fed’s decision to hike its interest rate target to 1.75%. In accompanying information, the Fed failed to deliver the all-important 'dot plot' increase, holding their internal expectations at three rate hikes in 2018 instead of the four that many were expecting. Further influencing downside pressure, however, was also the price of oil!
The pair, as you can see, has responded aggressively from the weekly resistance area pegged at 1.3006-1.3115. Continued selling from this point could drag the unit down as far as the 2018 yearly opening level at 1.2579. A little lower on the curve, daily price recently crossed beneath daily support at 1.3001 and is on track to touch gloves with a daily demand base sited at 1.2803-1.2845. Movement on the H4 timeframe, however, recently landed the candles a touch below the 1.29 handle/H4 channel support etched from the low 1.2255. Should the sellers remain in the driving seat here, the next downside objective falls in at March’s opening level at 1.2835 (positioned within the current daily demand).
Potential trading zones:
Given both weekly and daily timeframes indicating further downside, there’s a good chance that March’s opening level mentioned above at 1.2835 could be brought into the fray sometime today. With that being the case, the team has noted to keep an eye on the lower timeframes around 1.29 for a retest play. Catching the retest on the lower timeframes could prove highly profitable in terms of risk/reward.
Data points to consider: US unemployment weekly claims at 12.30pm; CAD Gov. Council Member Wilkins speaks at 6.45pm GMT.
Areas worthy of attention:
Supports: 1.2835; 1.2803-1.2845; 1.2579
Resistances: 1.29; 1.3001; 1.3006-1.3115.
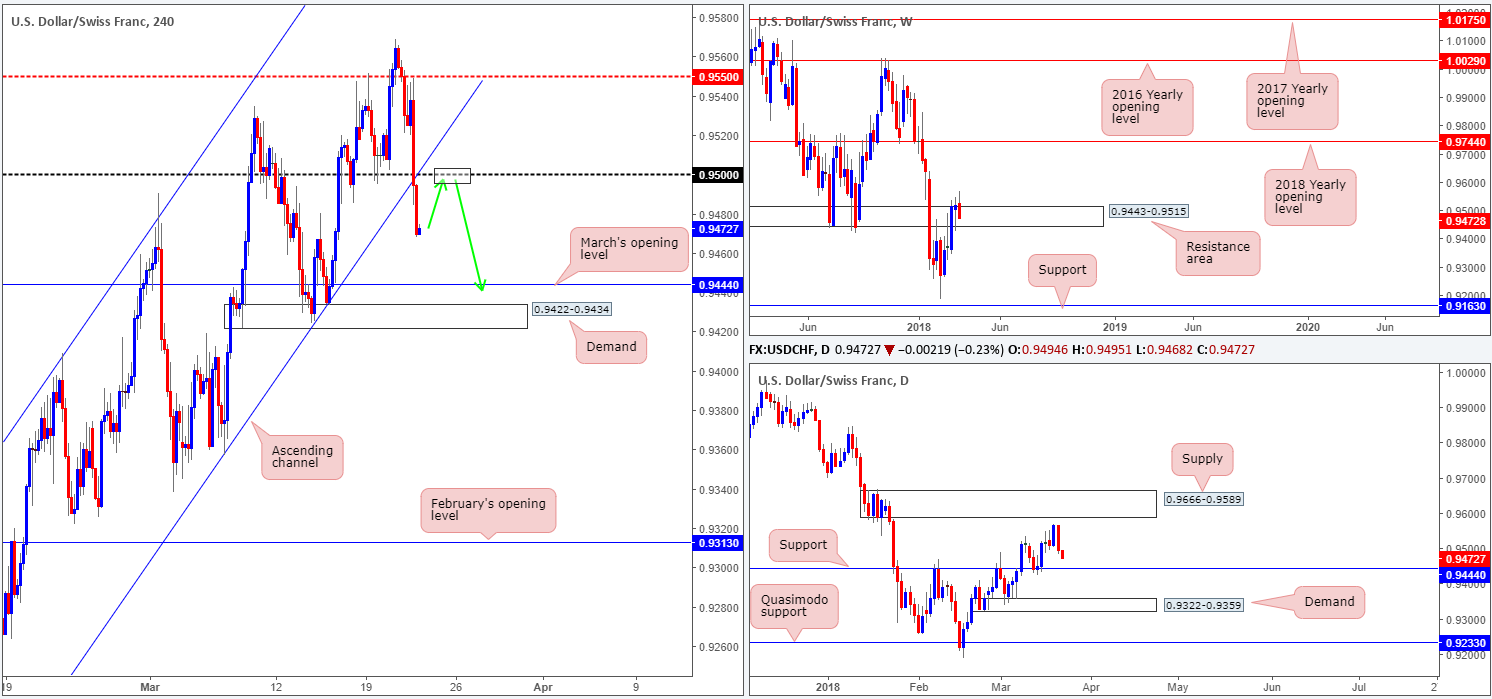
USD/CHF:
A strongly offered USD on the back of recent FOMC movement saw the Swissie’s H4 candles attack and conquer the 0.95 handle, as well as its intersecting H4 channel support taken from the low 0.9187. As you can probably see, this has left downside free to approach March’s opening level at 0.9444, followed closely by a H4 demand area located at 0.9422-0.9434. The other key thing to note here is that March’s opening level also represents a daily support level! Also worthy of note is weekly price is seen responding to a weekly resistance area plotted at 0.9443-0.9515. Further selling from this point could potentially force the couple as far south as weekly support coming in at 0.9163.
Potential trading zones:
A retest of the recently consumed 0.95 handle is likely on the radar for many traders this morning. A solid retest in the shape of a reasonably sized full or near-full-bodied H4 bearish candle is, at least in our book, worthy of a short, targeting March’s open level at 0.9444. We would strongly advise taking the majority of your position off the table here since let’s remember that 0.9444 also denotes a daily support!
Data points to consider: US unemployment weekly claims at 12.30pm GMT.
Areas worthy of attention:
Supports: 0.9444; 0.9422-0.9434; 0.9163.
Resistances: 0.95; 0.9443-0.9515.
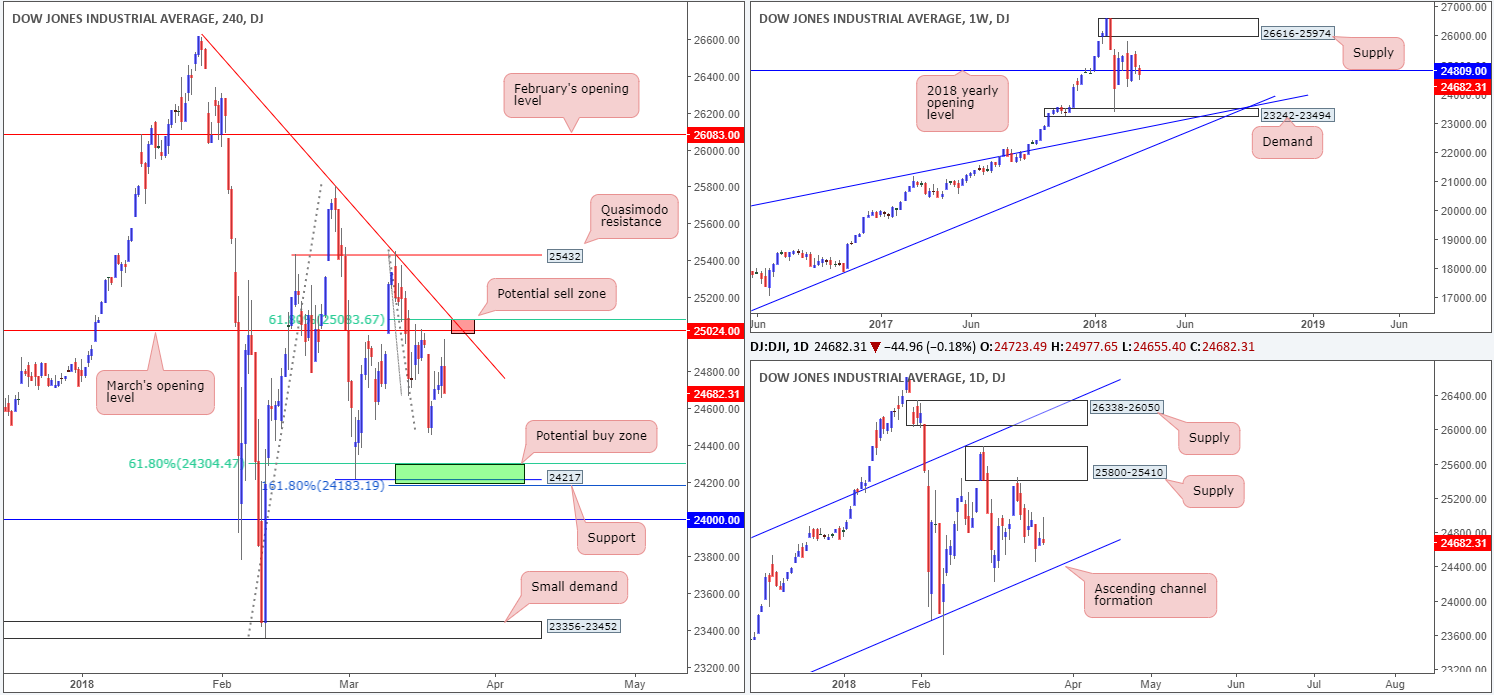
DOW 30:
US equity indexes began Wednesday’s session on strong footing, but were unable to hold on to early gains following the Fed’s decision to hike interest rates.
H4 price came within shouting distance of March’s opening level at 25024, before turning lower. Yesterday’s movement also saw daily price form a nice-looking bearish selling wick, which actually stabbed into the underside of the 2018 yearly opening level seen on the weekly timeframe at 24809. This could lead to the index probing for lower prices today and maybe even challenging the daily channel support extended from the low 17883.
Potential trading zones:
In a similar fashion to Wednesday report, we still believe there’s equal opportunity to trade both long and short in this market.
- The H4 area shaded in green at 24183/24304 (comprised of a161.8% Fib ext. at 24183, a swing H4 support at 24217 and a 61.8% Fib support at 24304), which, as far as we can see, intersects with the aforementioned daily channel support line. Longs from here, therefore, could be a consideration.
- March’s opening level at 25024, which happens to unite with a H4 trendline resistance extended from the high 26608, and is positioned nearby a 61.8% H4 Fib resistance at 25083 as well as the 2018 yearly opening level mentioned above at 24809. This area, shaded in red, is likely to bounce price should the index test where the monthly level and trendline intersect.
Data points to consider: US unemployment weekly claims at 12.30pm GMT.
Areas worthy of attention:
Supports: 24183/24304; daily channel support.
Resistances: 25083/25024; H4 trendline resistance.
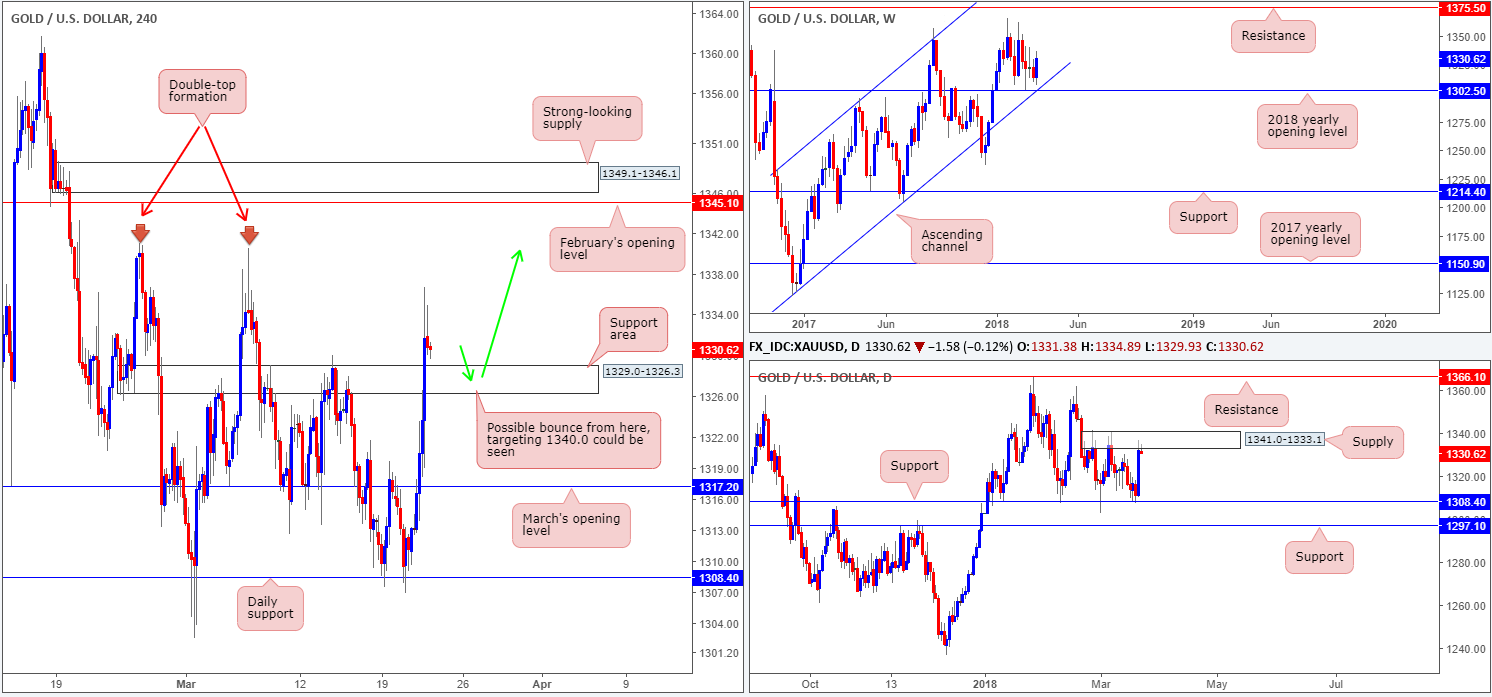
GOLD:
USD losses amid Wednesday’s FOMC decision, as you can see, firmly bolstered the yellow metal. Wiping out March’s opening level on the H4 timeframe at 1317.2, and then later the H4 resistance area at 1329.0-1326.3, the piece was able to clock fresh highs of 1336.6. Should the unit retest this recently broken area as support today, the next upside objective falls in at 1340.4ish: a H4 double-top formation, which is shadowed closely by February’s opening level at 1345.1 and then a nearby H4 supply at 1349.1-1346.1.
Although weekly price also exhibits room to press as far north as weekly resistance at 1375.5, daily flow is seen chewing on the underside of a notable daily supply base at 1341.0-1333.1!
Potential trading zones:
Attempting to trade long from the current H4 support area is a risk given the threat of selling from daily supply. However, owing to weekly price showing reasonably free upside, a long, providing H4 price forms a full or near-full-bodied H4 bull candle on the retest, could still be something to consider, targeting 1340.4 as your initial take-profit zone.
Areas worthy of attention:
Supports: 1329.0-1326.3.
Resistances: 1340.4; 1345.1; 1349.1-1346.1; 1341.0-1333.1; 1375.5.
This site has been designed for informational and educational purposes only and does not constitute an offer to sell nor a solicitation of an offer to buy any products which may be referenced upon the site. The services and information provided through this site are for personal, non-commercial, educational use and display. IC Markets does not provide personal trading advice through this site and does not represent that the products or services discussed are suitable for any trader. Traders are advised not to rely on any information contained in the site in the process of making a fully informed decision.
This site may include market analysis. All ideas, opinions, and/or forecasts, expressed or implied herein, information, charts or examples contained in the lessons, are for informational and educational purposes only and should not be construed as a recommendation to invest, trade, and/or speculate in the markets. Any trades, and/or speculations made in light of the ideas, opinions, and/or forecasts, expressed or implied herein, are committed at your own risk, financial or otherwise.
The use of the site is agreement that the site is for informational and educational purposes only and does not constitute advice in any form in the furtherance of any trade or trading decisions.
The accuracy, completeness and timeliness of the information contained on this site cannot be guaranteed. IC Markets does not warranty, guarantee or make any representations, or assume any liability with regard to financial results based on the use of the information in the site.
News, views, opinions, recommendations and other information obtained from sources outside of www.icmarkets.com.au, used in this site are believed to be reliable, but we cannot guarantee their accuracy or completeness. All such information is subject to change at any time without notice. IC Markets assumes no responsibility for the content of any linked site. The fact that such links may exist does not indicate approval or endorsement of any material contained on any linked site.
IC Markets is not liable for any harm caused by the transmission, through accessing the services or information on this site, of a computer virus, or other computer code or programming device that might be used to access, delete, damage, disable, disrupt or otherwise impede in any manner, the operation of the site or of any user’s software, hardware, data or property.