EUR/USD:
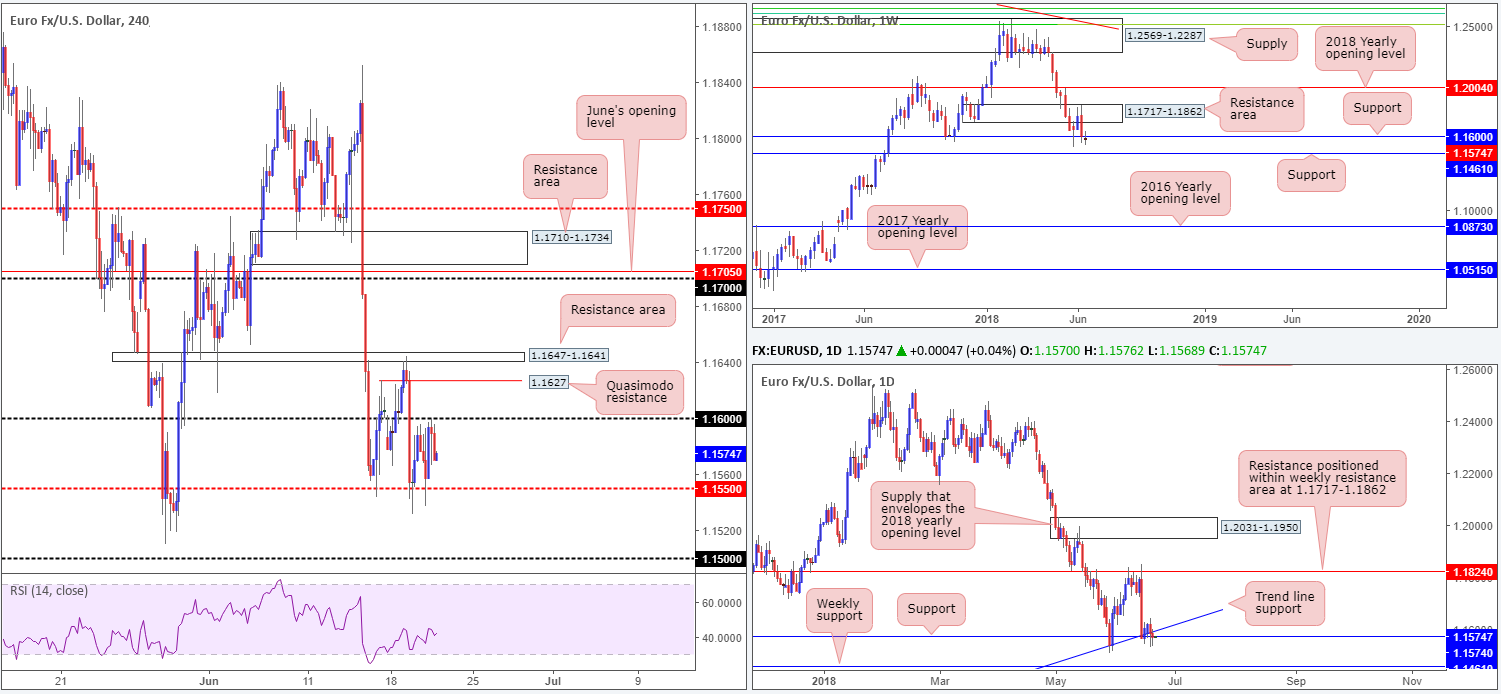
ECB’s Draghi and Fed’s Powell took to the stage in Portugal on Wednesday, but pretty much stuck to the script and repeated what they said last week in their respective monetary policy meetings. In terms of price movement, H4 is seen capped between the 1.16 handle and a H4 mid-level support at 1.1550. Directly above this area a H4 Quasimodo resistance level is seen at 1.1627, followed closely by a H4 resistance area at 1.1647-1.1641, whereas below 1.1550 we have the 1.15 handle in view.
Outside H4 action, we can see that daily price recently closed below daily trend line support taken from the low 1.0340, but has yet to overcome nearby daily support plotted at 1.1574. Higher up on the curve, nevertheless, weekly flows remain sub 1.1600: a weekly support level. It’s far too early to tell whether this level is fully consumed yet, but it may pay to pencil in the next weekly support target which stands at 1.1461, should further selling take place.
Areas of consideration:
Having seen weekly price pop below support, the 1.16 handle on the H4 timeframe (which effectively represents weekly support) along with the H4 Quasimodo resistance positioned a few pips above it at 1.1627, remain of interest for potential shorts.
Technically speaking, though, we still prefer the Quasimodo resistance on this occasion due to the fact that psychological numbers tend to suffer fakeouts. As for stop-loss placement, the ideal location appears to be beyond the nearby H4 resistance area at 1.1647-1.1641. Traders can expect some support to materialize from 1.16, but it should not pose too much of a problem. Traders may also want to consider reducing risk to breakeven on a H4 close beneath 1.16 and begin taking profits around the 1.1550 neighborhood.
Today’s data points: German Buba President Weidmann speaks; US Philly Fed Manufacturing Index; US unemployment claims.
GBP/USD:
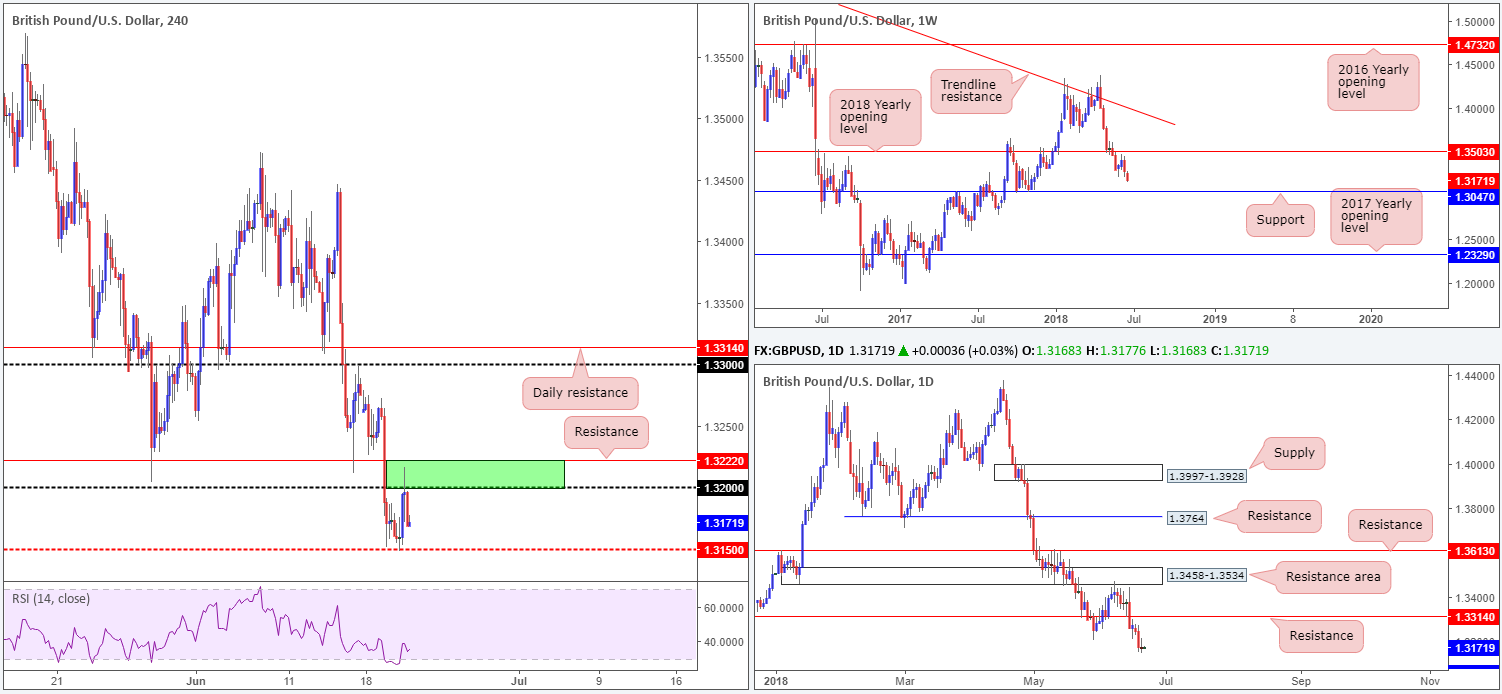
Although briefly seen eclipsing the 1.32 handle on the H4 timeframe, the British pound failed to sustain gains and peaked at highs of 1.3216 amid US hours on Wednesday. The pair found support on earlier headlines indicating that UK’s PM May secured another parliamentary vote. Strong selling around the 1.32 handle, though, proved difficult to overcome despite news, forcing the unit to pare a large portion of intraday gains into the close.
Technically speaking, all three timeframes continue to air somewhat bearish vibes. While H4 price recently established modest support off 1.3150, the 1.32 handle and nearby H4 resistance level at 1.3222 (green zone) has, as expected, proven a difficult base to conquer.
Further adding to this, we can see that both weekly and daily structure show room to stretch lower. The closest support can be found on the daily timeframe (not seen on the screen) at 1.3063, followed closely by weekly support priced in at 1.3047.
Areas of consideration:
Well done to those who managed to pin down a position out of the aforementioned green zone on the H4 timeframe, as this was a noted area to keep eyeballs on.
Going forward, the team has eyes on a break of 1.3150. A decisive H4 close beneath this boundary that’s followed with a retest as resistance would, in our book of technical setups, be considered a strong signal to consider intraday shorts in this market.
In regards to areas of concern from below 1.3150, we have the 1.31 handle as the first port of call, shadowed by nearby H4 Quasimodo support at 1.3085 (not seen on the screen). By this point, you may want to consider liquidating a large portion of your position, as the next stop, in terms of supportive structure, is the aforementioned daily support!
Today’s data points: UK public sector net borrowing; MPC official bank rate votes; BoE monetary policy summary; BoE official bank rate decision; MPC asset purchase facility votes; BoE Gov. Carney speaks; US Philly Fed Manufacturing Index; US unemployment claims.
AUD/USD:
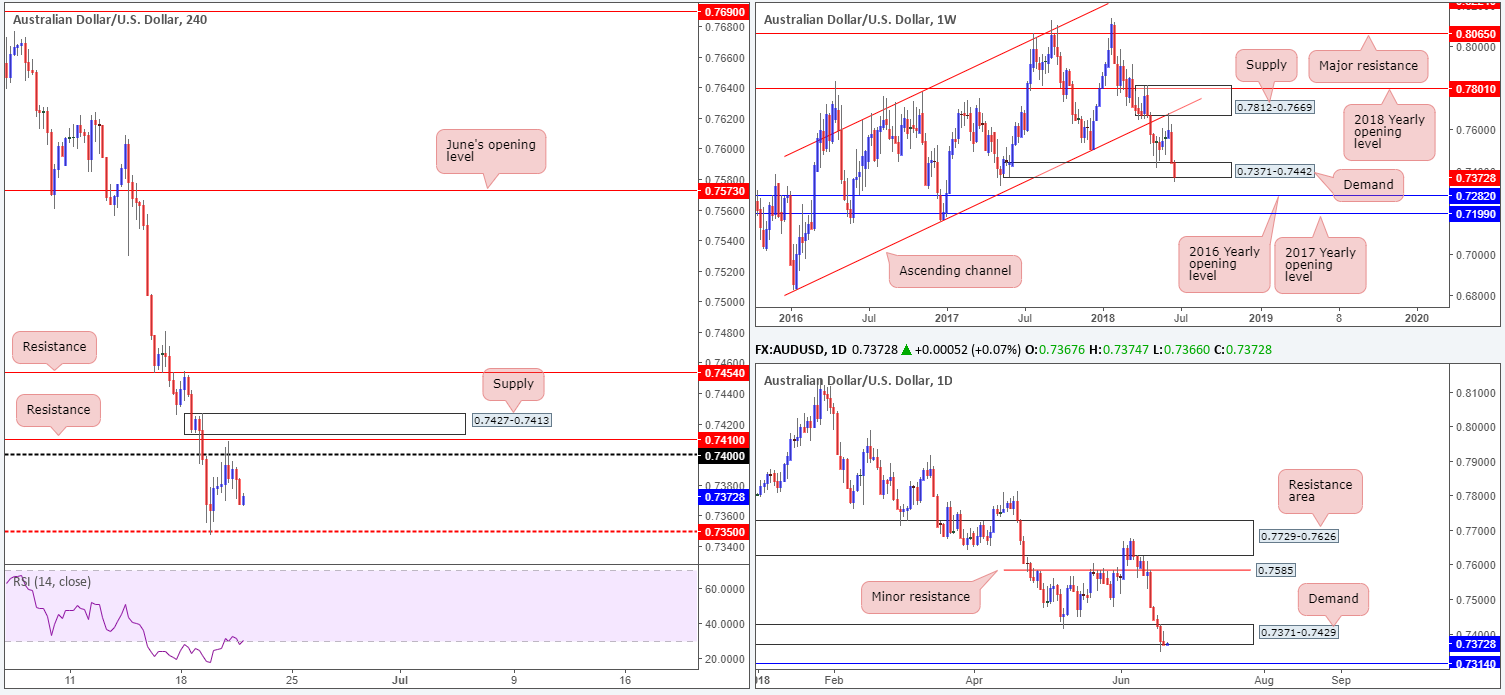
In recent trade, H4 price attempted to breach the 0.74 handle and shake hands with nearby H4 resistance at 0.7410 and H4 supply drawn from 0.7427-0.7413. The commodity-linked currency, as you can see, peaked at highs of 0.7408 during early Europe and proceeded to chisel its way lower throughout the remainder of the day.
With H4 price now seen hovering mid-range between the 0.74 region and nearby H4 mid-level support at 0.7350, where do we stand on the bigger picture? Higher-timeframe movement shows price action chewing on the lower edge of a weekly demand at 0.7371-0.7442, and its partner demand on the daily timeframe at 0.7371-0.7429. Given a large portion of long-term buyers’ stop-loss orders have likely been triggered as a result of this, there’s a chance further downside could be on the cards.
Areas of consideration:
A H4 candle close beyond the 0.7350 point on the H4 scale would be interesting, since we see little support until reaching the 0.73 neighborhood. Disappointingly, however, the higher timeframes highlight nearby support on the daily scale at 0.7314, and weekly price has its eyes on support coming in at 0.7282. Therefore, there’s not much wiggle room to execute shorts beyond 0.7350.
The only other area of interest can be seen at the H4 supply zone at 0.7427-0.7413. Underlined in yesterday’s briefing, we noted this area due to the zone boasting strong momentum to the downside, and owing to it being located just above the 0.74 handle and H4 resistance at 0.7410. Fakeouts are a common occurrence around psychological numbers (as we witnessed in recent trade), so another whipsaw above the 0.74 handle into our aforementioned H4 supply, is certainly a possibility today. An ideal sell signal, as far as we can see, would be for H4 price to print a bearish pin-bar formation that pierces through 0.74 (and the aforesaid H4 resistance) into the noted H4 supply zone (sells on the close of the candle pattern should be targeted with an initial take-profit zone set at 0.7350).
Today’s data points: US Philly Fed Manufacturing Index; US unemployment claims.
USD/JPY:
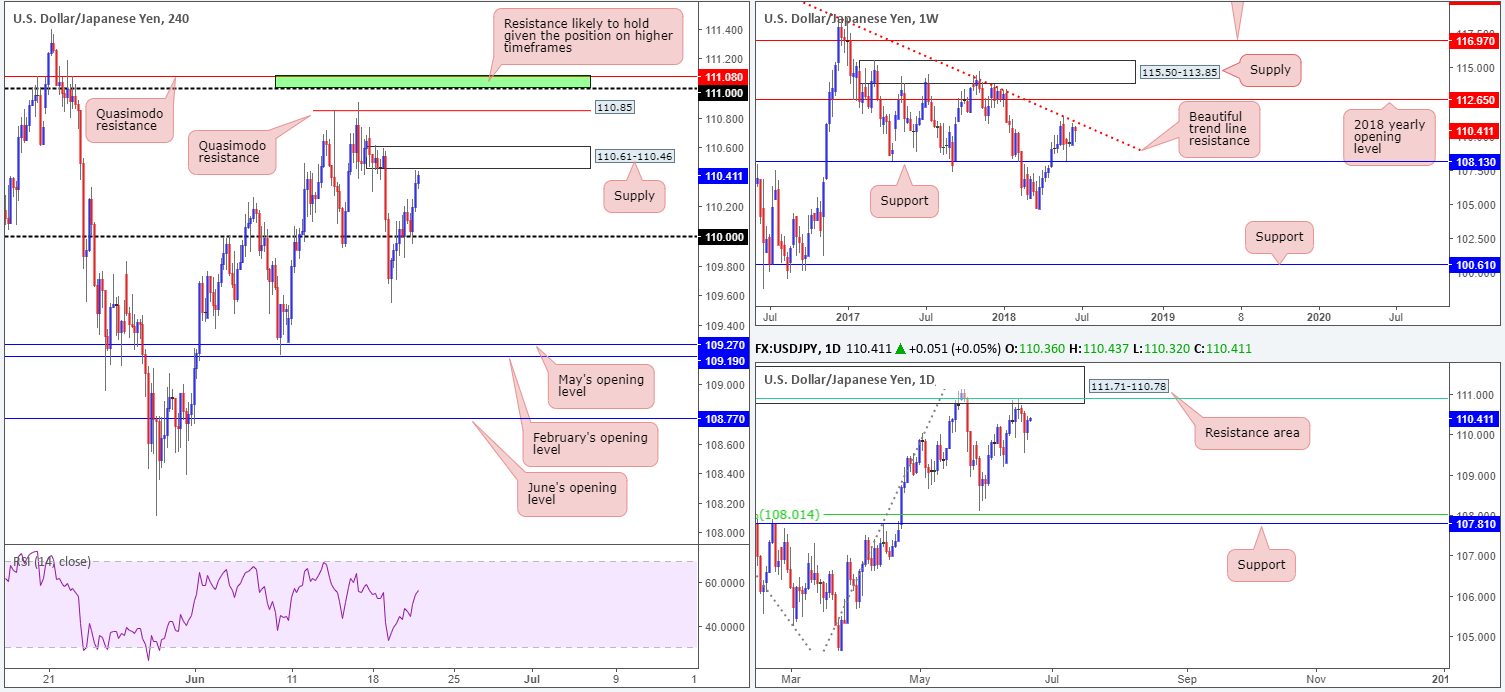
Following a text book retest off of the 110 handle seen on the H4 timeframe, USD/JPY bulls went on the offensive amid US hours on Wednesday. H4 candles, as you can see, gravitated up to within shouting distance of H4 supply posted at 110.61-110.46. The move was bolstered by healthy bid on the USD across the board (note the US dollar index is holding ground above the 95.00 mark) and a strong advance seen in US Treasury yields, clearly reflecting a risk-on mood.
Although the current H4 supply is appealing for shorts owing to its move lower from the base, traders might want to exercise caution here. We say this simply due to higher-timeframe structure. Weekly price action is seen trading just south of a trend line resistance taken from the high 123.67, and daily movement is currently eyeing a retest of the daily resistance zone seen at 111.71-110.78. This is an area that not only fuses with the aforementioned weekly trend line resistance, it also converges with a 61.8% daily Fib resistance value at 110.91 (green line) and has reasonably significant history dating back to August 2017.
Areas of consideration:
On account of the above, the team has noted the H4 Quasimodo resistance level at 110.85 as a potential sell zone, due to its convergence with the aforementioned higher-timeframe structure. In the event that shorts fail to hold down this level, the 111 handle and nearby H4 Quasimodo resistance level at 111.08 is also of interest for shorts for the same reasons.
Today’s data points: US Philly Fed Manufacturing Index; US unemployment claims.
USD/CAD:
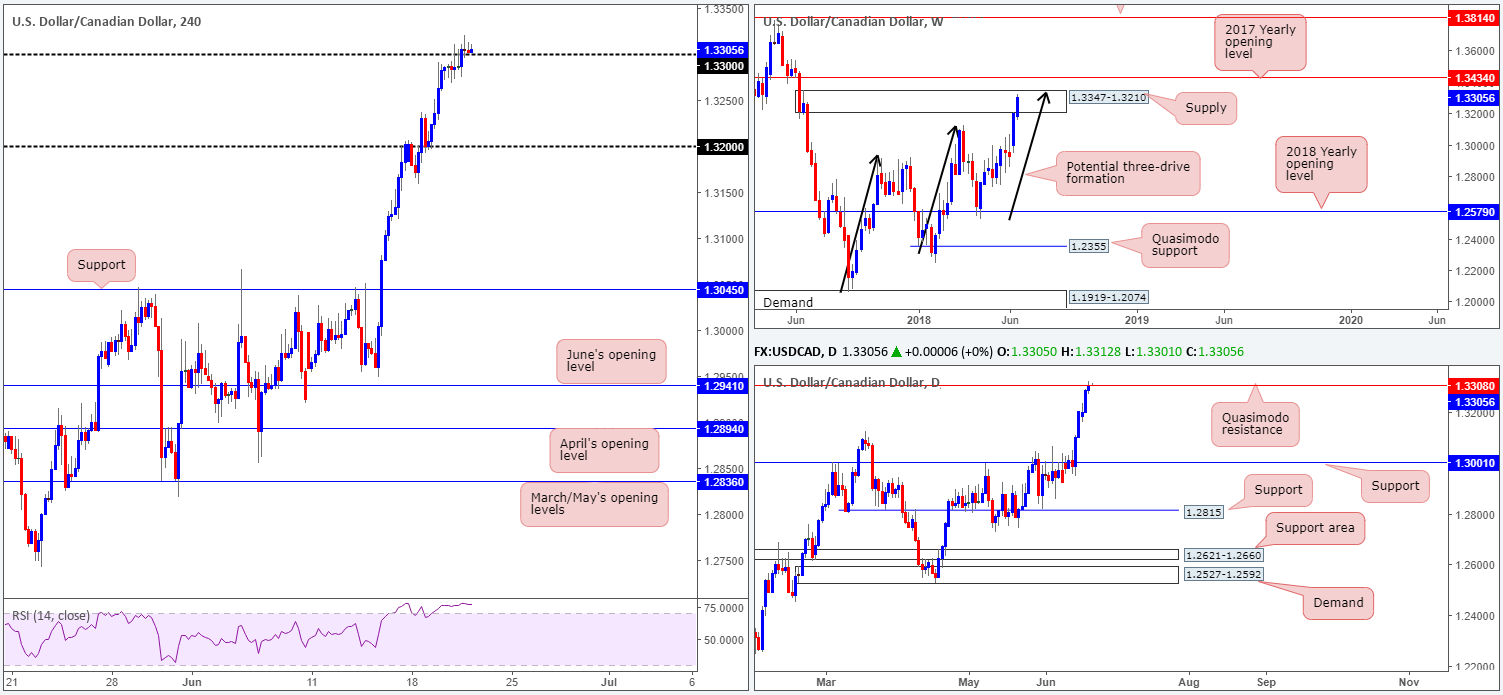
Combined with a robust USD seen across the board and WTI finding resistance off the $65.90 mark, the USD/CAD eventually conquered the 1.33 handle. As you can see, though, breakout buying is lackluster. This is likely due to where price is positioned on the higher timeframes.
A few pips above 1.33 is a daily Quasimodo resistance level marked at 1.3308. Further adding to this, it may also be worth taking into account that weekly price is in process of completing a three-drive formation (see black arrows) that terminates within the upper limit of a weekly supply (1.3347-1.3210) at 1.3340ish.
Areas of consideration:
In light of recent movement, patience remains the order of the day!
Should H4 price respect 1.33 as support, looking for shorting opportunities around the 1.3340 mark is certainly a possibility, with stops tightly pinned above the current weekly supply.
Alternately, a H4 close back beneath 1.33 right now would likely indicate bearish strength from the current daily Quasimodo resistance level, and possibly set the stage for a continuation move south to the 1.32 handle.
Today’s data points: US Philly Fed Manufacturing Index; US unemployment claims.
USD/CHF:
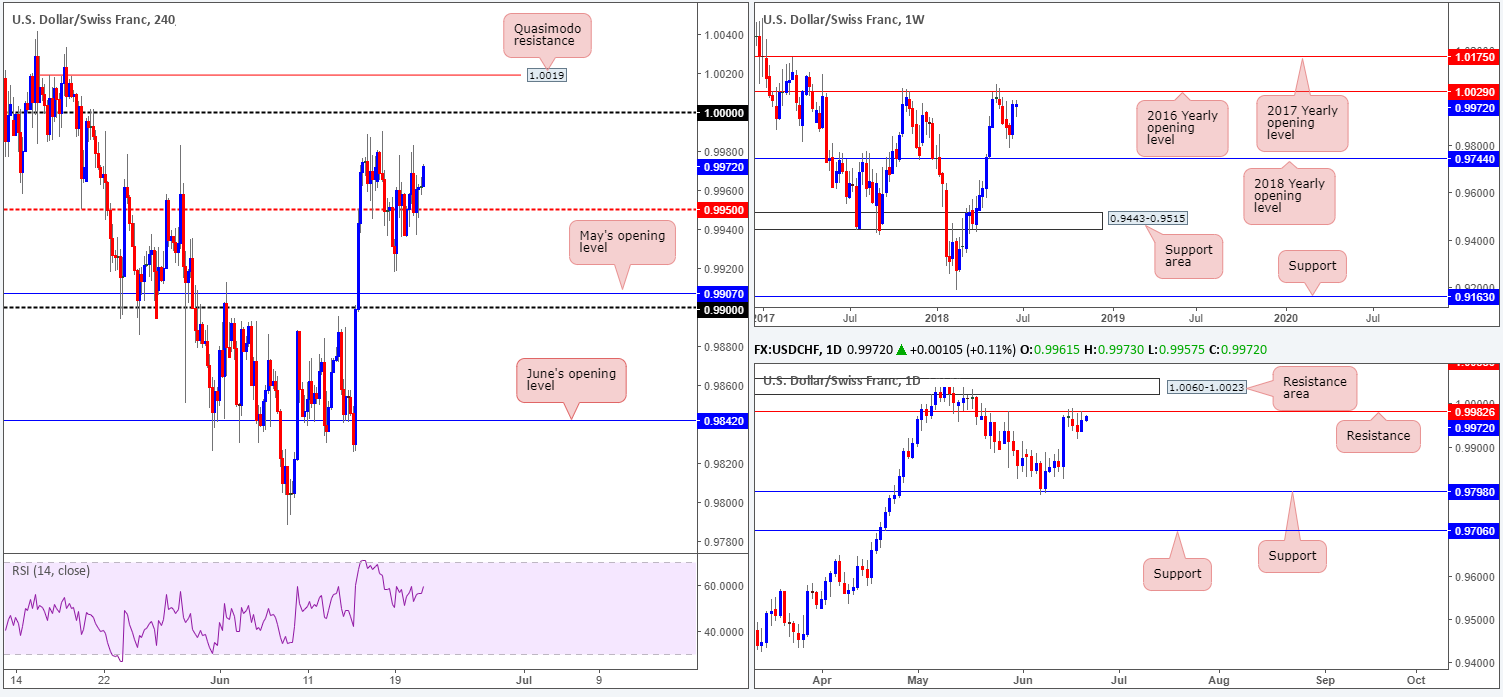
Once again, the USD/CHF found it difficult to pin down a direction during trade on Wednesday, with the H4 candles spending the majority of the day fluctuating around the H4 mid-level number 0.9950. Recent movement, however, has led the bulls to a better space, now potentially poised to test 1.0000 (parity). Before H4 action can reach this point, though, daily price will need to overcome resistance plotted at 0.9982.
On the other side of the spectrum, weekly price still shows room to probe higher and reconnect with the 2016 yearly opening level at 1.0029: a barrier which held price lower in early May of this year and in late October in 2017.
Areas of consideration:
In response to the above, we see significant resistance on all three timeframes:
- The 2016 yearly opening level on the weekly timeframe at 1.0029.
- The daily resistance level at 0.9982, followed closely by a daily resistance area at 1.0060-1.0023 (houses the 2016 yearly opening level within).
- The key figure 1.0000 seen on the H4 timeframe, along with nearby H4 Quasimodo resistance level at 1.0019.
Selling from the aforementioned H4 Quasimodo resistance level may be of interest to some traders. We would, however, advise placing stops above the daily resistance zone at around the 1.0062ish mark. Yes, this may seem like a large stop-loss distance, but when one takes into consideration that we’re trading from higher-timeframe areas, the move lower from here could be extremely large (and profitable).
Today’s data points: US Philly Fed Manufacturing Index; US unemployment claims; SNB monetary policy assessment and SNB press conference.
Dow Jones Industrial Average:
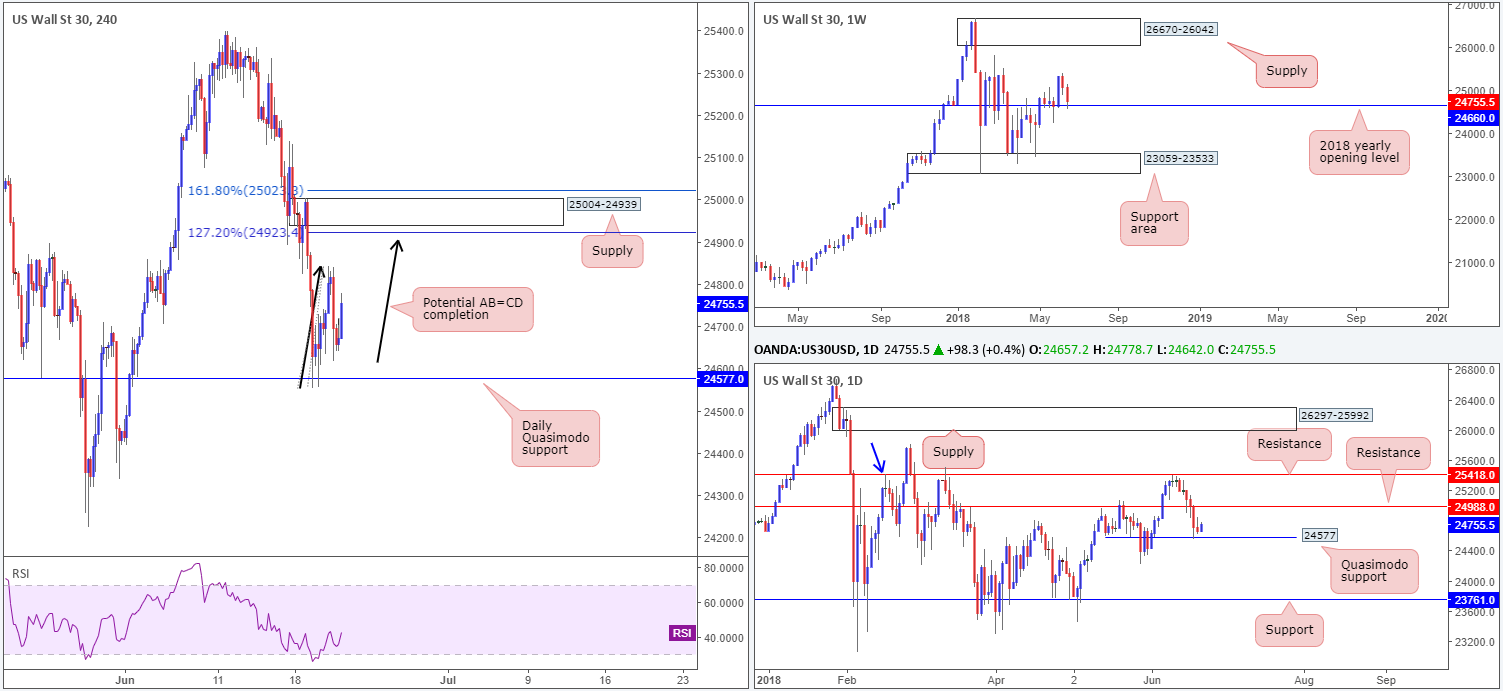
Using a top-down approach this morning, we can clearly see weekly price engaging with the 2018 yearly opening level priced in at 24666. These levels tend to hold, at least for a bounce, so it is not a barrier one should overlook. Supporting the yearly opening level, there’s also a daily Quasimodo support line notched at 24577 in play at the moment. Further upside from this angle may bring daily resistance at 24988 into the fray.
What’s also notable from a technical perspective is H4 price can be seen chalking up a potential AB=CD correction that terminates (127.2% Fib ext. at 24923) just south of a H4 supply zone at 25004-24939. Also note that within the walls of this H4 zone is the daily resistance level mentioned above at 24988.
Areas of consideration:
While we remain cognizant of where weekly price is trading from, the H4 supply highlighted above at 25004-24939 houses attractive confluence (see above in bold). To that end, we feel that should H4 price challenge this area today, a reaction to the downside will likely be observed. In terms of stop-loss placement, there’s two options:
- Beyond the H4 supply zone.
- Above the 161.8% H4 Fib ext. point at 25023.
With regards to take-profit targets, the 38.2% and 61.8% Fib support values off the completion point of the AB=CD (yet to complete) from 24556, is an option.
Today’s data points: US Philly Fed Manufacturing Index; US unemployment claims.
XAUUSD (GOLD):
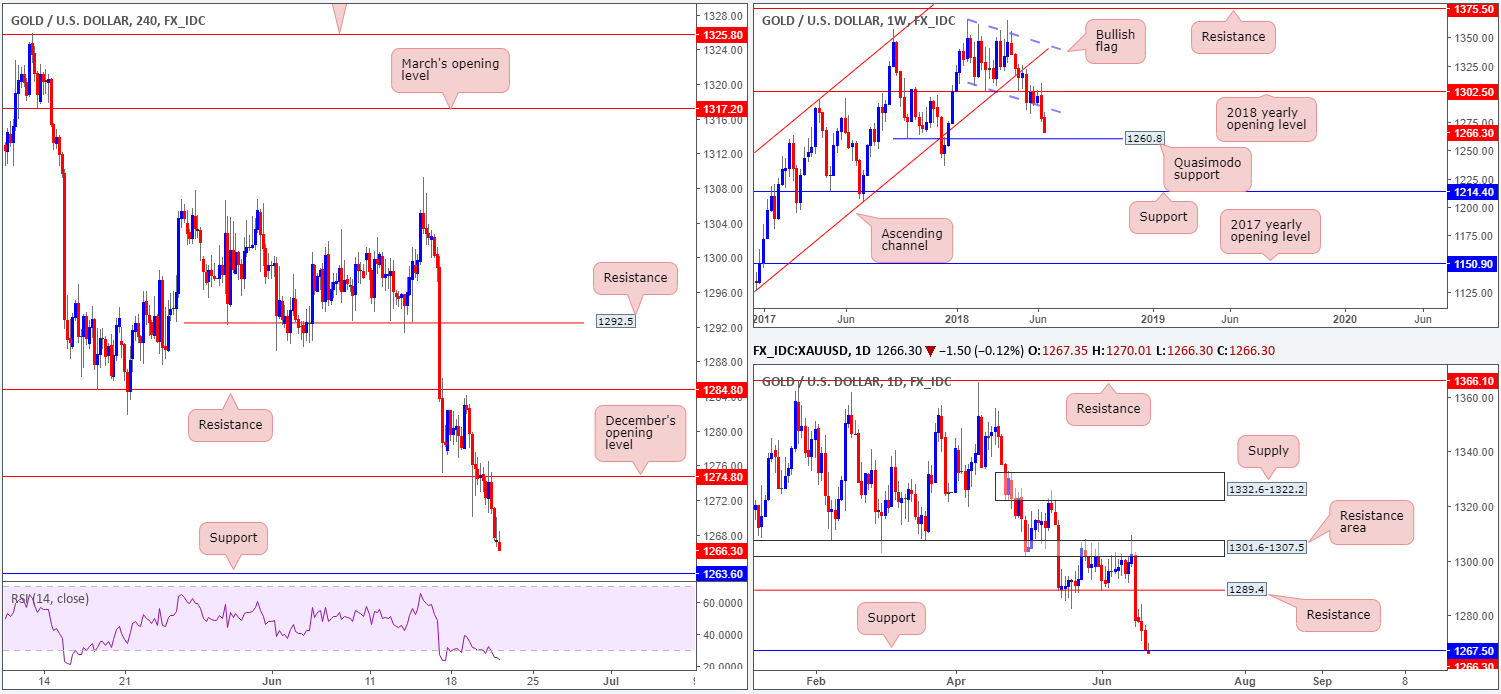
Having seen the USD build on recent gains, this placed the yellow metal under pressure on Wednesday. Registering its fourth consecutive daily loss, H4 price is now poised to approach support located at 1263.6 after firmly taking out December’s opening level at 1274.8 and retesting it as resistance.
The story over on the bigger picture shows weekly price heading towards a weekly Quasimodo support positioned at 1260.8. While a little lower on the curve, we can see that daily price is currently interacting with support priced in at 1267.5.
Areas of consideration:
Downside momentum is clearly building at the moment, which could potentially call for a break of daily support at 1267.5 and a test of nearby H4 support mentioned above at 1263.6. Both areas are difficult buys, considering how close we are to testing the weekly Quasimodo support at 1260.8.
In view of the above, we feel this market is a chancy long at the moment. Only once (or indeed if) H4 price connects with the current weekly Quasimodo support and forms a full or near-full-bodied bull candle, will we believe that this market may be ready to print a recovery. Therefore, for now at least, opting to remain on the sidelines may be the better path to take.
The use of the site is agreement that the site is for informational and educational purposes only and does not constitute advice in any form in the furtherance of any trade or trading decisions.
The accuracy, completeness and timeliness of the information contained on this site cannot be guaranteed. IC Markets does not warranty, guarantee or make any representations, or assume any liability with regard to financial results based on the use of the information in the site.
News, views, opinions, recommendations and other information obtained from sources outside of www.icmarkets.com.au, used in this site are believed to be reliable, but we cannot guarantee their accuracy or completeness. All such information is subject to change at any time without notice. IC Markets assumes no responsibility for the content of any linked site. The fact that such links may exist does not indicate approval or endorsement of any material contained on any linked site.
IC Markets is not liable for any harm caused by the transmission, through accessing the services or information on this site, of a computer virus, or other computer code or programming device that might be used to access, delete, damage, disable, disrupt or otherwise impede in any manner, the operation of the site or of any user’s software, hardware, data or property.


