A note on lower timeframe confirming price action…
Waiting for lower timeframe confirmation is our main tool to confirm strength within higher timeframe zones, and has really been the key to our trading success. It takes a little time to understand the subtle nuances, however, as each trade is never the same, but once you master the rhythm so to speak, you will be saved from countless unnecessary losing trades. The following is a list of what we look for:
- A break/retest of supply or demand dependent on which way you’re trading.
- A trendline break/retest.
- Buying/selling tails/wicks – essentially we look for a cluster of very obvious spikes off of lower timeframe support and resistance levels within the higher timeframe zone.
- Candlestick patterns. We tend to only stick with pin bars and engulfing bars as these have proven to be the most effective.
We search for lower timeframe confirmation between the M15 the H1 timeframes, since most of our higher-timeframe areas begin with the H4. Stops are usually placed 5-10 pips beyond confirming structures.
EUR/USD:
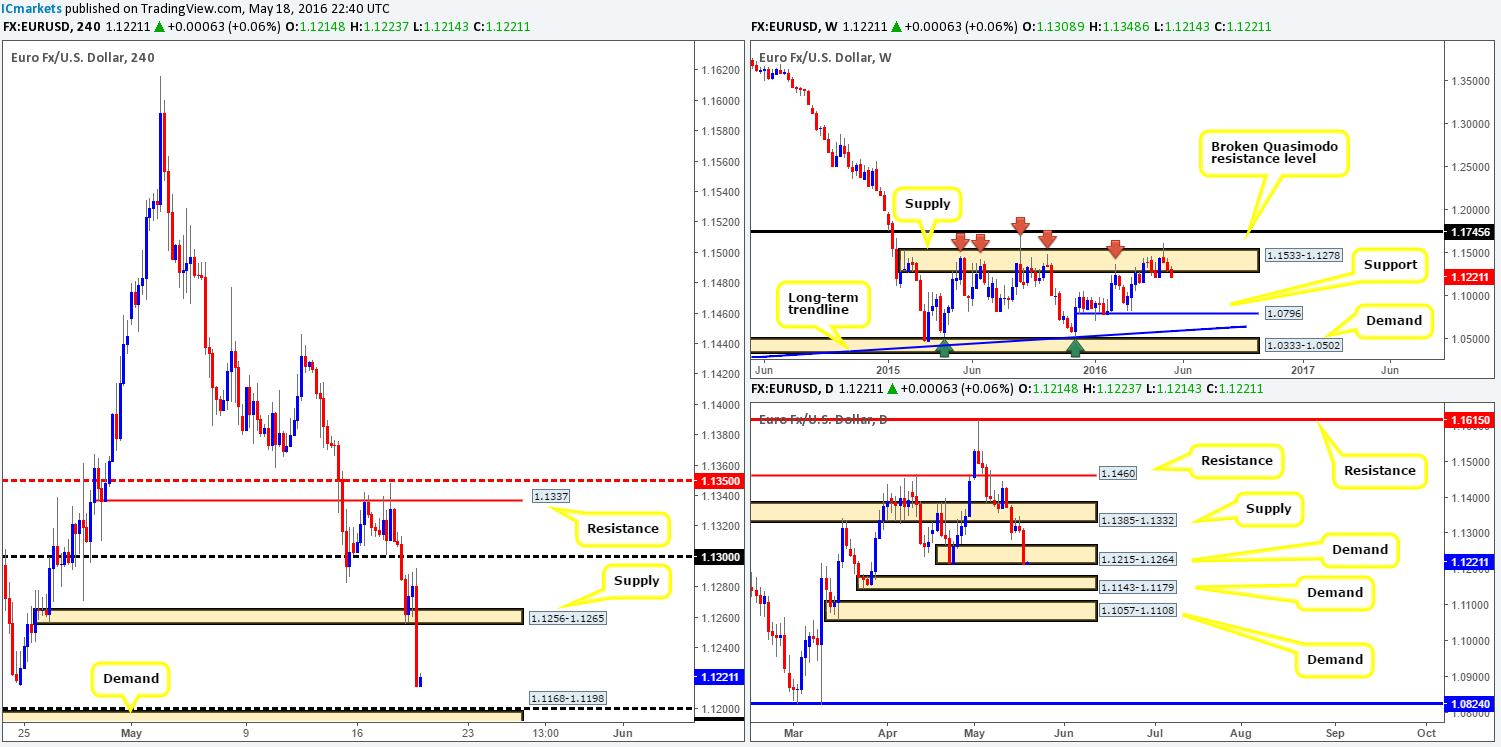
Although the EUR found a pocket of active bids around the small H4 demand zone at 1.1256-1.1265, the rally from here was, as you can see, short lived! Weighed on heavily by comments from yesterday’s FOMC meeting, the single currency plummeted to lows of 1.1214 going into the close. Technically, this has placed H4 price just ahead of a nice-looking H4 demand area coming in at 1.1168-1.1198, which, if you look over the USD/CHF H4 chart, also shows price nearing H4 supply at 0.9913-0.9885.
From the weekly chart, a sell-off should not really have come as much of a surprise since this pair remains trading from a major weekly supply base seen at 1.1533-1.1278. What this recent surge in selling also accomplished, however, was a slight breach beyond the daily demand at 1.1215-1.1264. This may, as far as we see things, tempt traders to target the fresh daily demand area below carved from 1.1143-1.1179.
Our suggestions: A long from the H4 demand at 1.1168-1.1198 could very well be a possibility today. Given that this area also boasts a psychological support at 1.12, sits on top of a daily demand mentioned above at 1.1143-1.1179 coupled with the inverse correlation confluence seen over on the USD/CHF, price has a fair chance to bounce from here! Nevertheless, let’s remember that the weekly chart is trading from a major area of supply (see above) and shows room to continue lower all the way down to weekly support at 1.0796, so entering on the touch (pending order) is not something we’d be comfortable doing. Waiting for lower timeframe confirmation is, in our opinion, the safer route to take here.
Levels to watch/live orders:
- Buys: 1.1168-1.1198 [Tentative – confirmation required] (Stop loss: dependent on where one confirms this area).
- Sells: Flat (Stop loss: N/A).
GBP/USD:
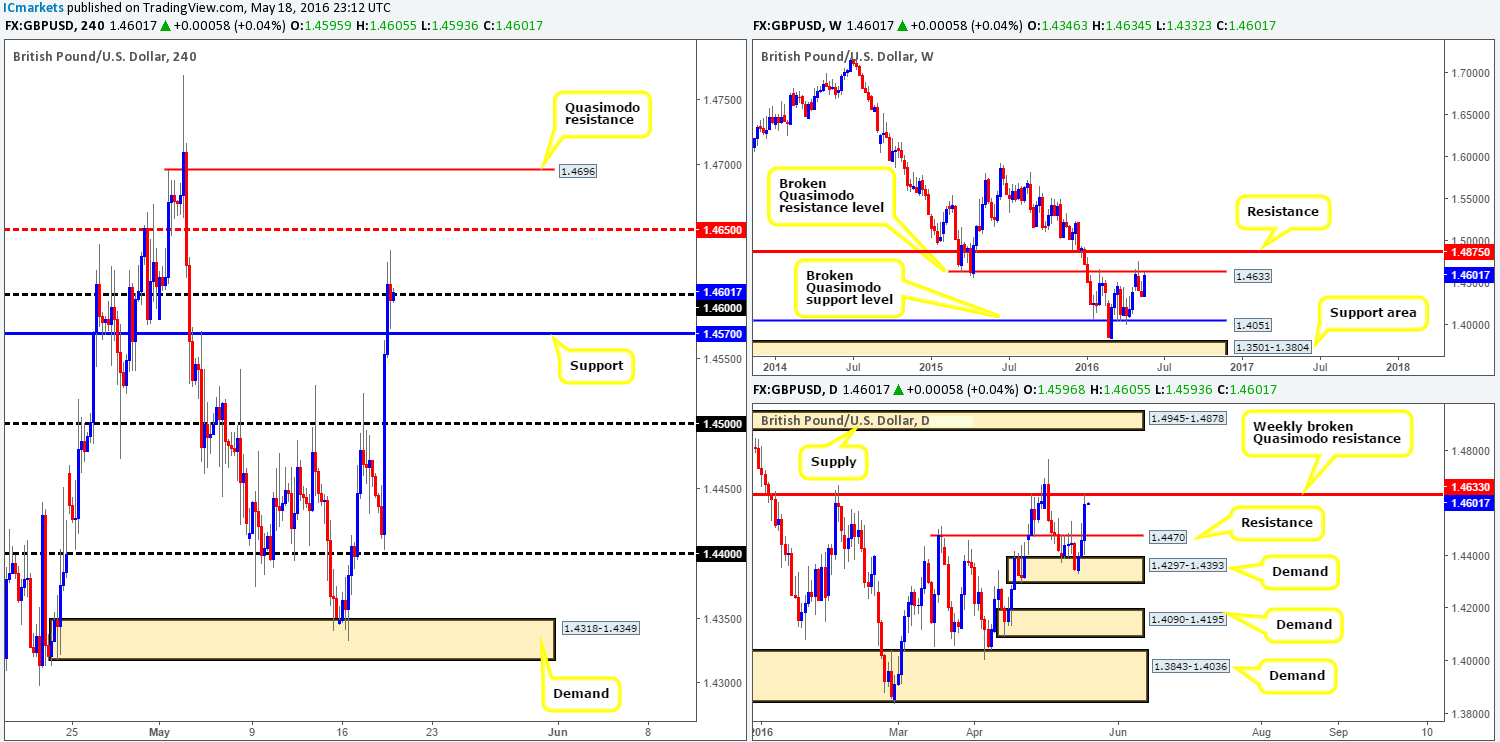
GBP rallied for a third consecutive day yesterday, managing to clock highs of 1.4634 by the day’s end. This advance in price was, as far as we can see, fuelled by recent Brexit polls hitting the wire. Consequent to this, H4 price is now seen flirting with the underside of the 1.46 handle. So, where do we see this market heading today? Well, both the weekly and daily charts show the unit has reconnected with the weekly broken Quasimodo resistance at 1.4633. In addition to this, over on the weekly chart on silver (a highly correlating market with the pound) we can see price has already rebounded from weekly supply at 18.480-17.769 and shows room to continue lower down to weekly support coming in at 16029. Nevertheless, with the H4 chart here on the GBP showing support at 1.4570, as well as the H4 chart on silver also showing support drawn from 16.773, selling may be difficult.
Our suggestions: Given the H4 support 1.4570, selling right now, despite what the higher-timeframe structure suggests (see above), is not something our team is willing to risk. Assuming that price closes below this H4 support line, however, this will likely attract further selling down to the 1.45 handle. To take advantage of this potential move south one could either sell at market – effectively selling the breakout, or conservatively wait to see if price retests the broken level as resistance and sell with lower timeframe confirmation. For confirmation techniques, please see the top of this report.
Levels to watch/live orders:
- Buys: Flat (Stop loss: N/A).
- Sells: Watch for price to close below 1.4570 and look to trade any retest seen thereafter (lower timeframe confirmation required).
AUD/USD:
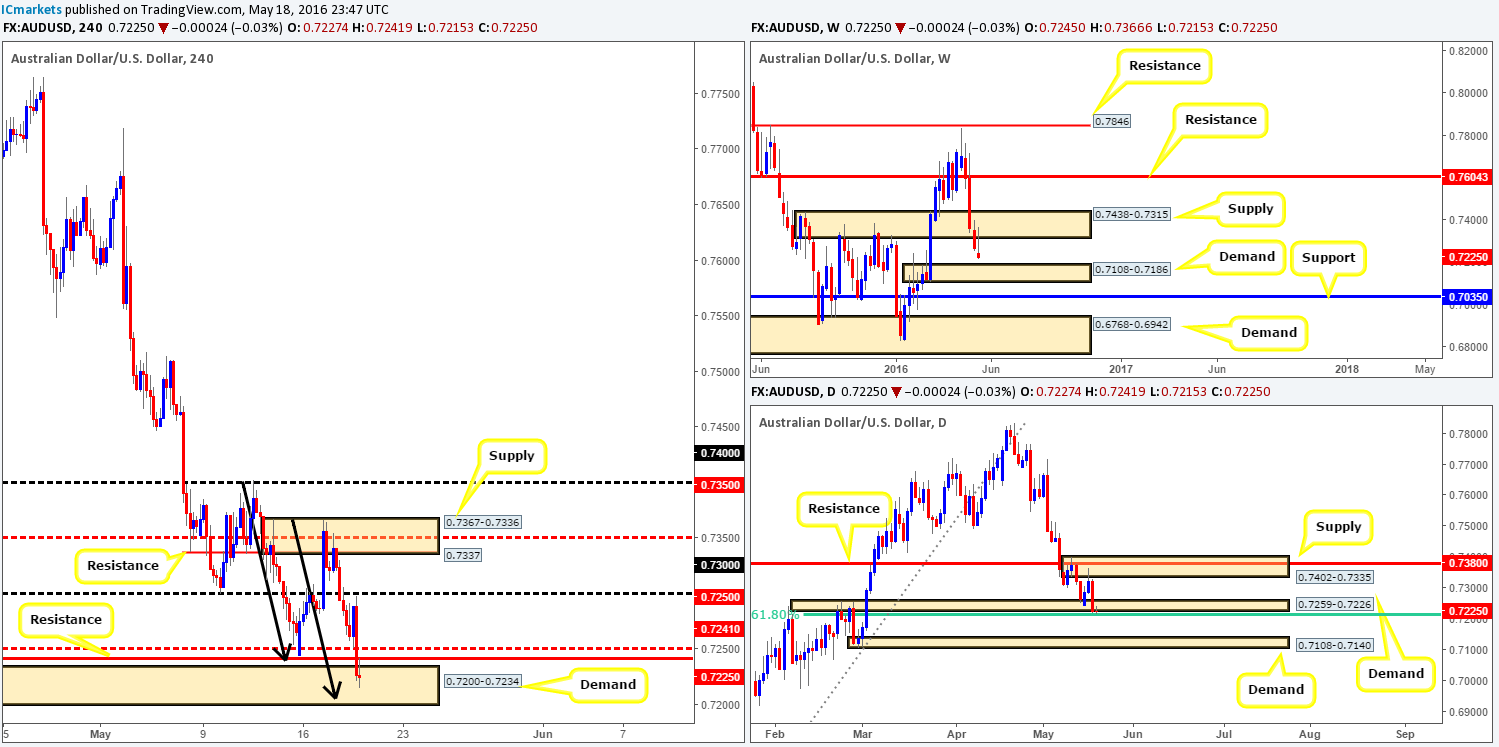
This morning’s analysis will kick-off with a look at the weekly chart, which shows that price beautifully retested the underside of the recently broken weekly demand at 0.7438-0.7315 as supply. In the event that the bears continuing punishing the bulls here, it’s likely this pair will be shaking hands with weekly demand at 0.7108-0.7186 sometime soon. Moving down to the daily chart, nevertheless, support is being seen from just below daily demand at 0.7259-0.7226 around a 61.8% Fibonacci support at 0.7210. Now, with the recently breached daily demand and pressure from weekly sellers, it is unlikely this Fib level is going to hold. The next downside target beyond this line can be seen around daily demand at 0.7108-0.7140 which sits within the extremes of the above said weekly demand.
Stepping across to the H4 chart, price dived lower on the back of comments from the FOMC yesterday, bringing this market through H4 support at 0.7241 and into the jaws of H4 demand at 0.7200-0.7234.
Our suggestions: In favor of buying from the current H4 demand, traders have the daily 61.8% fib support at 0.7210 backing this area. In addition to this, there is a H4 AB=CD bullish approach that completes around the 0.7204 mark (see black arrows). However, our team has come to a general consensus that buying from here is not a high-probability move due to the following reasons:
- Weekly action chalking up a bearish position (see above).
- H4 resistance lurking within the H4 demand at 0.7241 alongside the mid-way H4 resistance just above it at 0.7250.
Therefore, shorts could be considered on the break of the current H4 demand but remain aware that the top side of the aforementioned weekly demand sits fourteen pips below! As much as we’d like to short below here since daily price shows potential to move lower, we just cannot condone a sell into weekly demand. As such, we have decided to remain flat going into today’s trade.
Levels to watch/live orders:
- Buys: Flat (Stop loss: N/A).
- Sells: Flat (Stop loss: N/A).
USD/JPY:
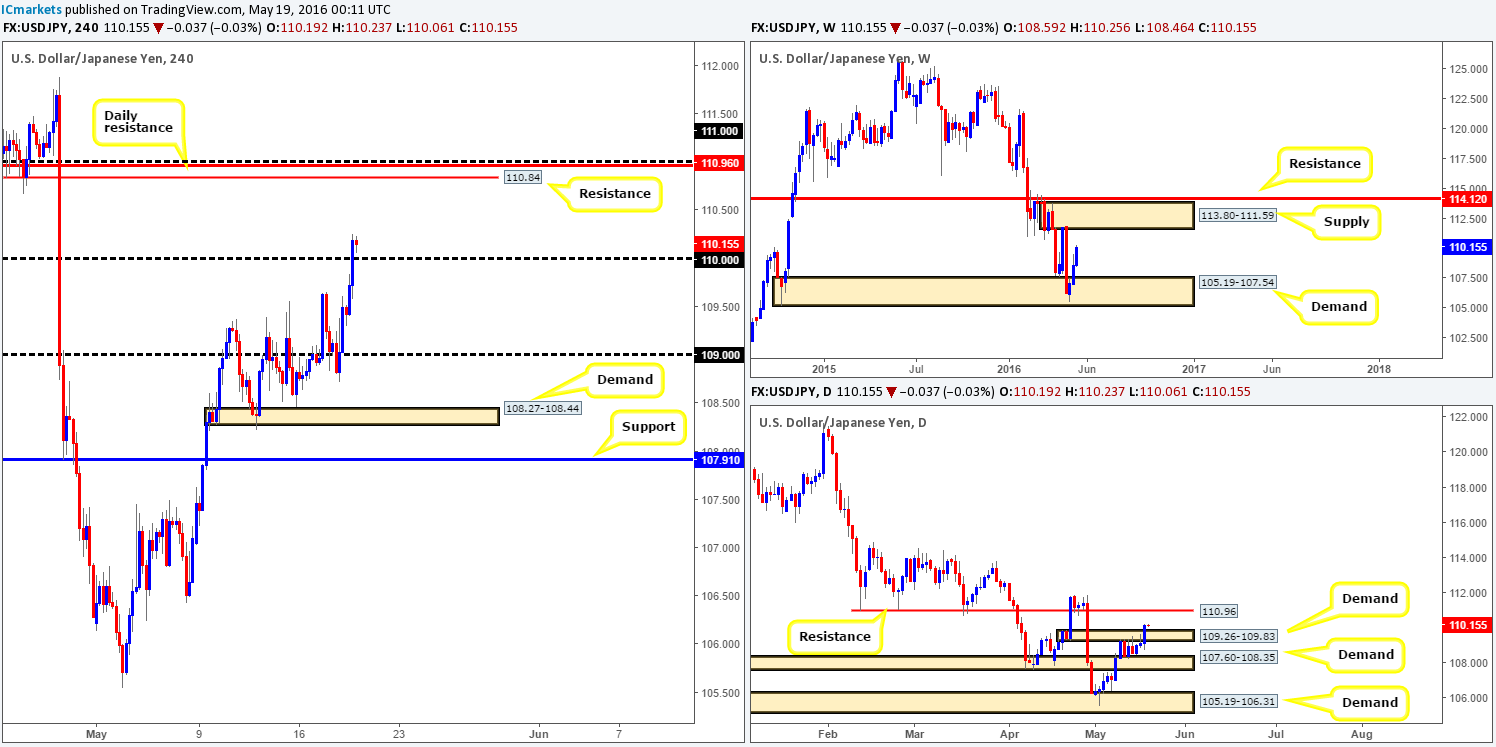
The USD/JPY remained well-bid during most of yesterday’s sessions, even more so after the FOMC release which pushed this pair above the 110 handle into the close. In light of this recent move, we see little reason on the H4 chart for price not to continue rallying up to the 111.00/110.84 area today (formed by a H4 resistance at 110.84, a daily resistance at 110.96 and the 111.00 resistance handle).
In support of this move, weekly buyers continue to bid this pair north from weekly demand at 105.19-107.54 with the upside clear until weekly supply at 113.80-111.59. Daily action has also just closed beyond daily supply at 109.26-109.83 (now acting demand), potentially clearing the path north up to daily resistance mentioned above at 110.96.
Our suggestions: Watch for price to retest the 110.00 handle and look for a lower timeframe buy entry, targeting 110.84. For ideas regarding possible entry techniques, here is what we use:
- A break/retest of supply.
- A trendline break/retest.
- Buying tails – essentially we look for a cluster of very obvious spikes off of lower timeframe support levels.
We search for lower timeframe confirmation between the M15 the H1 timeframes, since most of our higher-timeframe areas begin with the H4. Stops are usually placed 5-10 pips beyond confirming structures.
Levels to watch/live orders:
- Buys: 110 region [Tentative – confirmation required] (Stop loss: dependent on where one confirms this area).
- Sells: Flat (Stop loss: N/A).
USD/CAD:
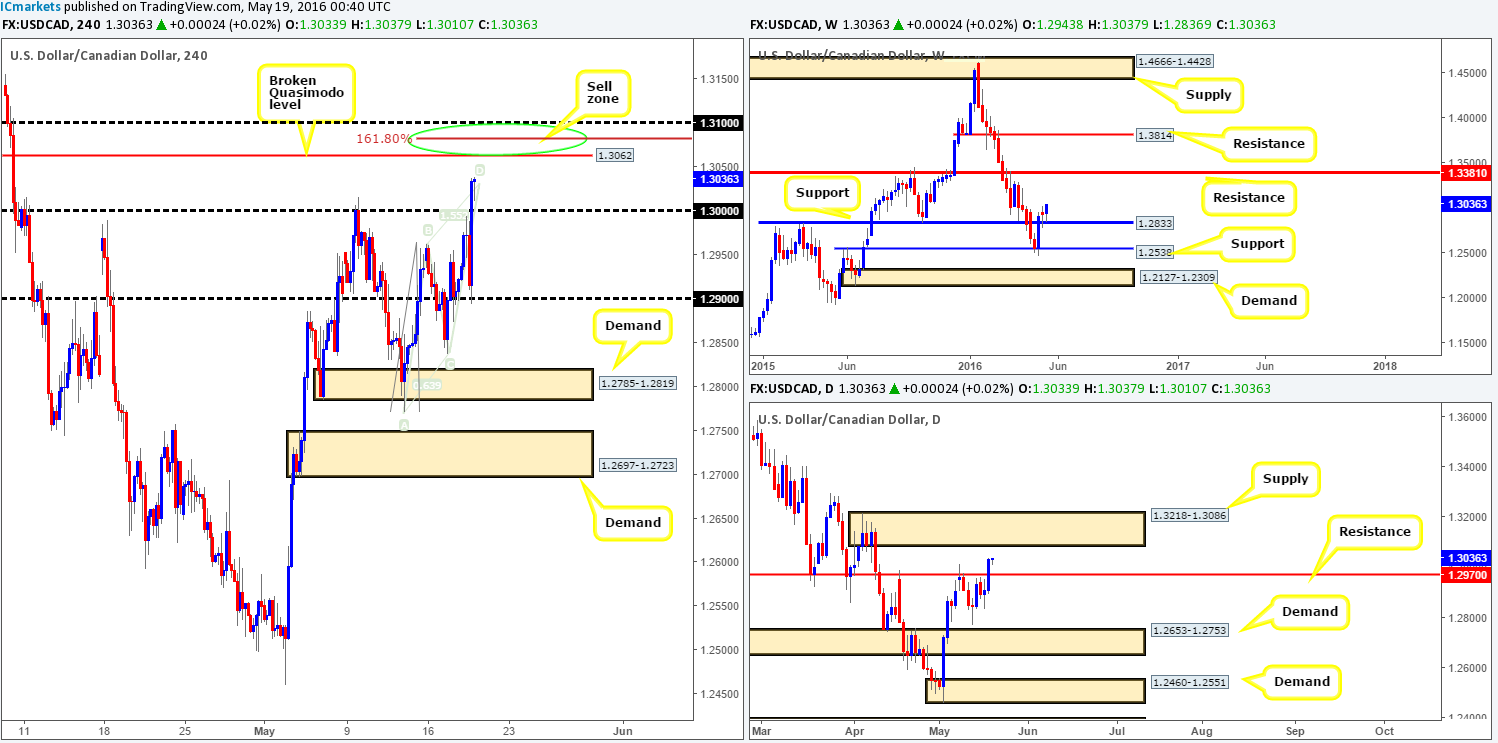
Thanks to yesterday’s FOMC-induced rally, H4 action is currently trading just ahead of a nice-looking H4 sell zone. A broken H4 Quasimodo level at 1.3062, a psychological resistance at 1.31 and also a 161.8% Fib extension at 1.3080 (green circle) taken from the base of the H4 AB=CD bearish pattern collectively form a tight resistance zone. What is more, this H4 sell zone is bolstered by a daily supply seen at 1.3218-1.3086 adding extra weight to a bearish move being seen from here. However, the only grumble we have is the fact that weekly action is bouncing from support at 1.2833 right now and could possibly drive this pair much higher!
Our suggestions: We would not be comfortable placing a pending sell order at the 1.31/1.3062 region due to weekly price. Waiting for the lower timeframes to prove selling interest resides here is, at least in our opinion, the safer route to take. Of course it is down to the individual trader what method he/she utilizes to confirm such zones. We, nevertheless, are satisfied with the following: a break/retest of demand, a trendline break/retest or simply a collection of clear selling tails formed around a lower timeframe resistance line.
Levels to watch/live orders:
- Buys: Flat (Stop loss: N/A).
- Sells: 1.3100/1.3062 [Tentative – confirmation required] (Stop loss: dependent on where one confirms this area).
USD/CHF:
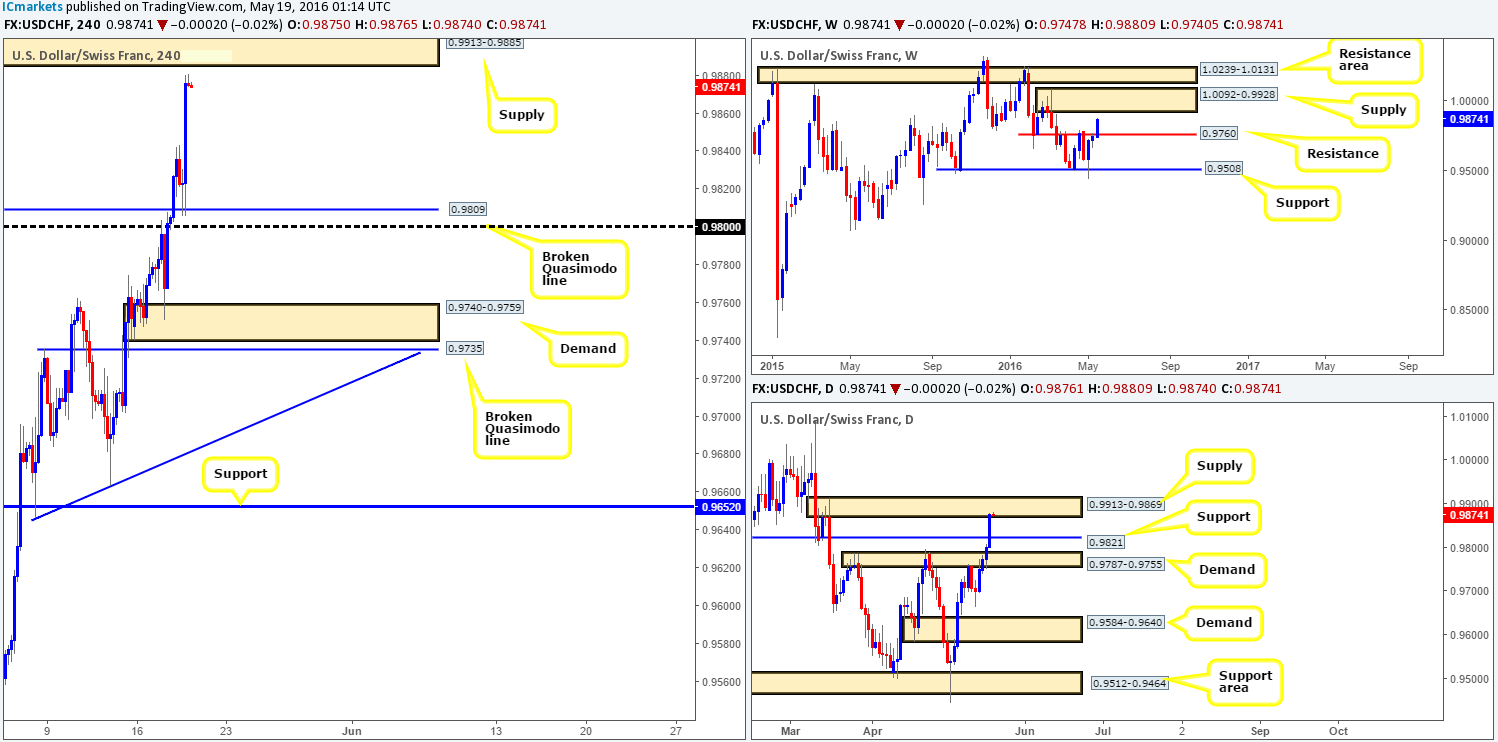
The pair rose more than seventy pips off the back of the latest FOMC comments. Price rebounded beautifully from a broken H4 Quasimodo level at 0.9809, which, as you can see, brought prices up to within shouting distance of H4 supply at 0.9913-0.9885. With daily supply at 0.9913-0.9869 also now in view, and taking into account that this base sits directly below a weekly supply area at 1.0092-0.9928, lower prices could be on the cards!
In our analysis on the EUR/USD (a pair that is inversely correlated with the USD/CHF), we mentioned that price is lingering just above H4 demand at 1.1168-1.1198. This – coupled with the aforementioned supply areas seen on the Swissy are, at least from a technical standpoint, enough to consider shorting this market we feel.
Our suggestions: Sell from the H4 supply zone at 0.9913-0.9885. Considering that it is housed within the extremes of daily supply, which by extension lurks just below weekly supply (see above), we believe it is good enough to justify a pending order. That being the case, our team has placed a sell order at 0.9883 with a stop above the daily supply zone at 0.9917. If our order fills today, we’d be looking to target the 0.98 region as a first take-profit zone.
Levels to watch/live orders:
- Buys: Flat (Stop loss: N/A).
- Sells: 0.9883 [Pending order] (Stop loss: 0.9917).
DOW 30:
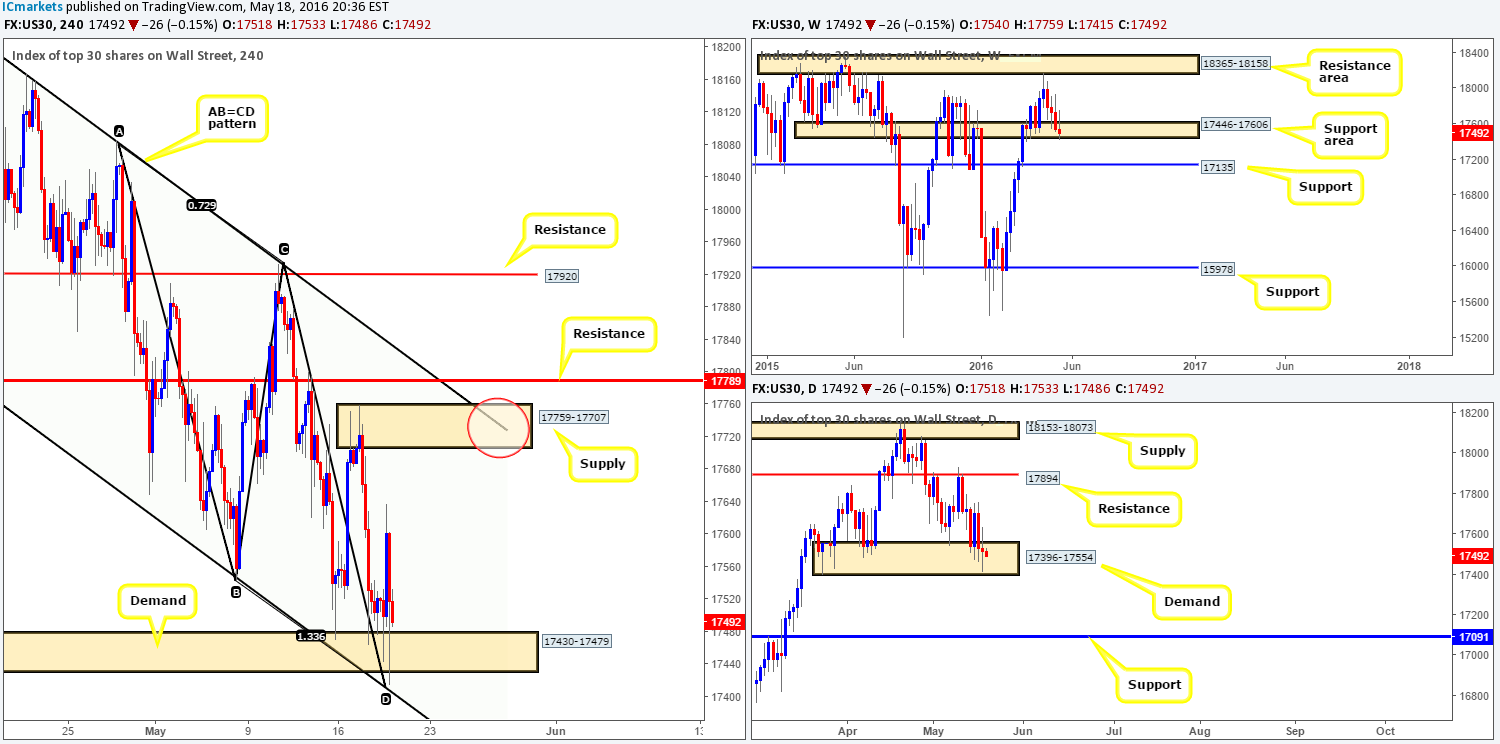
The DOW index ended the day pretty much unchanged at the close yesterday despite the FOMC’s meeting hitting the wire, consequently forming a daily indecision candle within daily demand at 17396-17554. On the H4 chart, the unit remains trading from a H4 demand at 17430-17479, which is not only bolstered by a H4 channel support line taken from the low 17776, but also sports a H4 AB=CD bullish completion point at 17416. We would love nothing more than to buy this market from here, but we have serious doubt in the higher-timeframe structures at the moment. Over on the weekly chart, the support area at 17446-17606 has registered little bullish interest over the past couple of weeks. Meanwhile, the aforementioned daily demand is, as we mentioned above, currently showing uncertainty.
Our suggestions: Longs from current price could still be a possibility, targeting the H4 supply zone at 17759-17707. Nevertheless, know that the higher-timeframe structure is showing weakness and could possibly see a drive lower in the near future. We are taking the side of caution here and leaving this market on the sidelines today.
Levels to watch/live orders:
- Buys: Flat (Stop loss: N/A).
- Sells: Flat (Stop loss: N/A).
Gold:
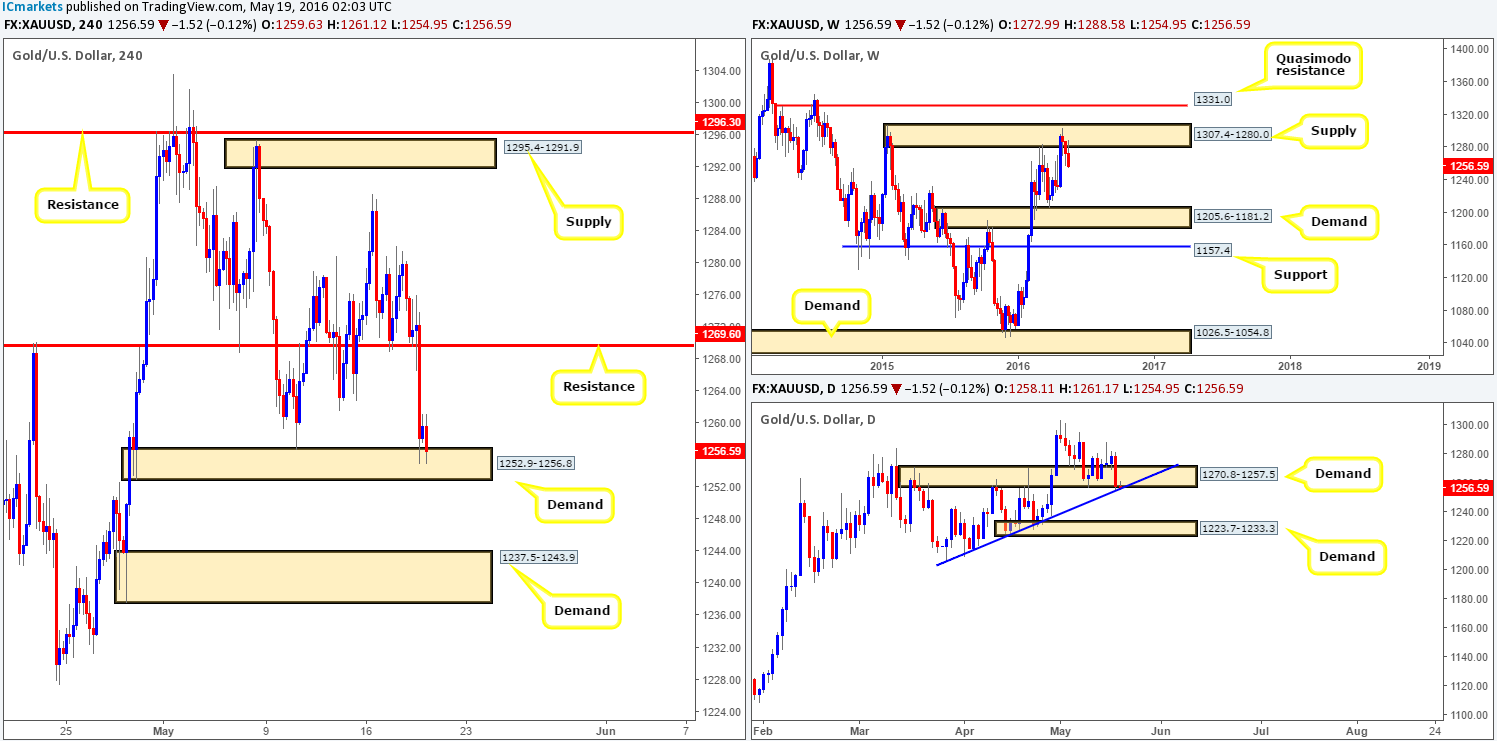
Using a top-down approach this morning, the yellow metal continues to drive lower from weekly supply at 1307.4-1280.0. This coupled with oil also trading from weekly supply at 50.91-47.22 certainly paints a particularly bearish picture at the moment. On the other side of the field, gold is seen trading around the lower edge of a daily demand area drawn from 1270.8-1257.5. Bids look incredibly weak around this zone (despite added support from the daily trendline extended from the low 1205.4) which may force this market lower to test daily demand penciled in at 1223.7-1233.3.
Jumping across to the H4 chart, current action, thanks to a strong dollar on the back of yesterday’s FOMC meeting, is now seen shaking hands with H4 demand at 1252.9-1256.8. The response from this barrier so far has not really been anything to get excited about in our opinion. Due to where price is positioned on the higher-timeframe picture (see above), we feel bids are likely going to continue weakening here.
Our suggestions: The best, and in our view, most logical path to take today would be to wait for a CLOSE below the current H4 demand base. This would likely achieve two things. Firstly, we believe it would set the stage for a continuation move down to H4 demand at 1237.5-1243.9 (sits just above daily demand at 1223.7-1233.3). Secondly, it may provide an opportunity to trade short should price retest the broken base as supply (lower timeframe confirmation would be required here – for confirming techniques please see the top of this report).
Levels to watch/live orders:
- Buys: Flat (Stop loss: N/A).
- Sells: Watch for price to close below 1252.9-1256.8 and look to trade any retest seen thereafter (lower timeframe confirmation required).