A note on lower timeframe confirming price action…
Waiting for lower timeframe confirmation is our main tool to confirm strength within higher timeframe zones, and has really been the key to our trading success. It takes a little time to understand the subtle nuances, however, as each trade is never the same, but once you master the rhythm so to speak, you will be saved from countless unnecessary losing trades. The following is a list of what we look for:
- A break/retest of supply or demand dependent on which way you’re trading.
- A trendline break/retest.
- Buying/selling tails/wicks – essentially we look for a cluster of very obvious spikes off of lower timeframe support and resistance levels within the higher timeframe zone.
- Candlestick patterns. We tend to stick with pin bars and engulfing bars as these have proven to be the most effective.
We search for lower timeframe confirmation between the M15 and H1 timeframes, since most of our higher-timeframe areas begin with the H4. Stops are usually placed 3-5 pips beyond confirming structures.
EUR/USD:
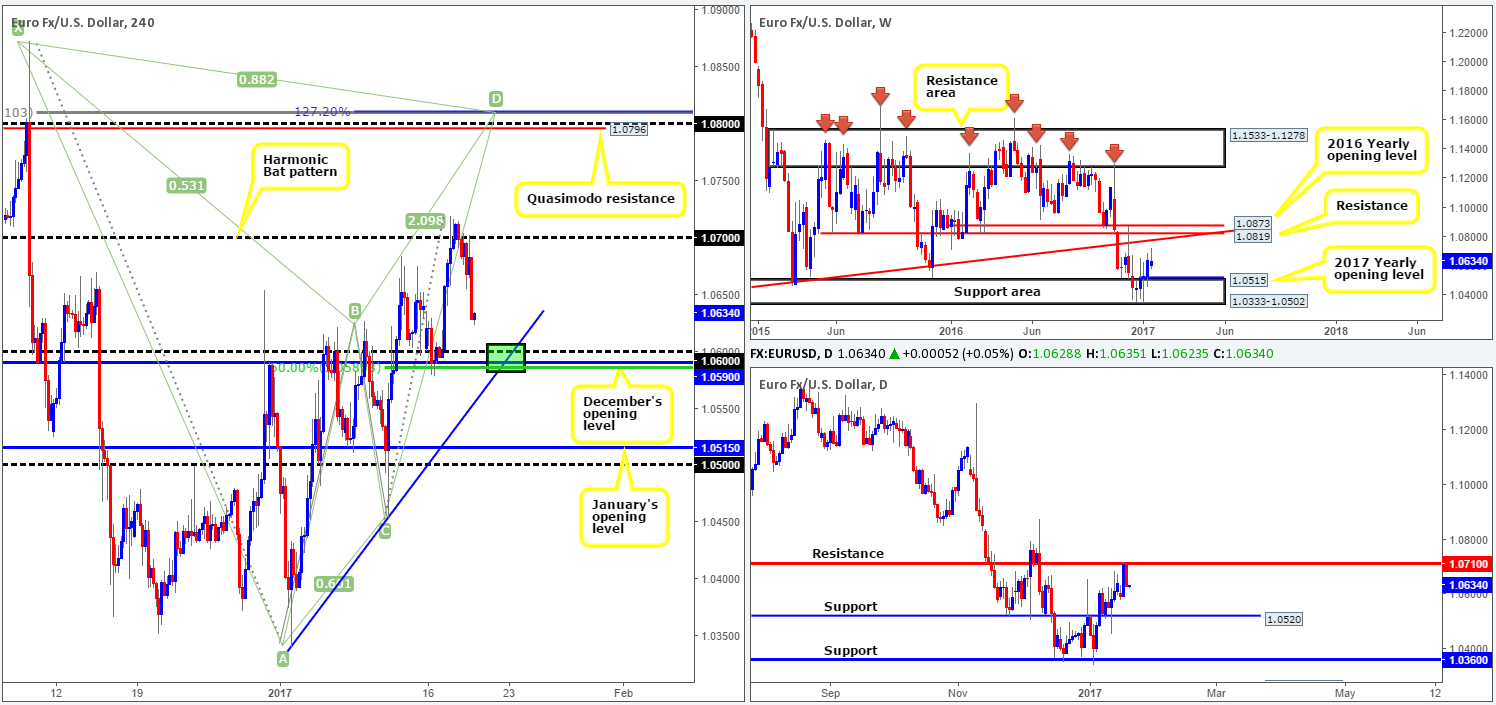
Despite the H4 candles closing above the 1.07 psychological boundary late Tuesday, which to many, was considered a bullish signal, daily resistance hovering just above this hurdle at 1.0710 managed to cap upside amid yesterday’s trading. The move was also fueled on the slightly hawkish words of Fed Chair Janet Yellen, after she signaled that if the US economy strengthens, as anticipated, the central bank stands ready to raise interest rates.
Looking at the H4 chart, we hold the opinion that price looks to be on track to tap the round number 1.06 sometime today. This level, as we hope is demonstrated on the chart, is bolstered by December’s opening level at 1.0590, a H4 50.0% Fib support at 1.0584 and a H4 trendline support extended from the low 1.0340. Technically, this is enough confluence to trade from, in our opinion. Unfortunately however, there’s very little supporting confluence coming in from the higher-timeframe structures. Weekly price is now seen trading in no-man’s-land between a long-term weekly trendline resistance extended from the low 0.8231 and the weekly support area at 1.0333-1.0502. Meanwhile, the next obvious support on the daily timeframe falls in around 1.0520.
Our suggestions: While the 1.06 region on the H4 chart is technically sound, we cannot justify placing a pending order here owing to the lack of higher-timeframe confluence. With that being said, we would still trade long from this neighborhood if, and only if, a strong lower-timeframe buying signal takes shape from here (see the top of this report for ideas on how to enter using lower-timeframe structure).
Data points to consider: EUR rate decision at 12.45pm, ECB press conference at 1.30pm. US housing data, the Philly Fed manufacturing index report and Jobless claims are all set to be released at 1.30pm GMT.
Levels to watch/live orders:
- Buys: 1.06 region ([lower-timeframe confirmation is required here before a trade can be executed] stop loss: depends on where one confirms the zone).
- Sells: Flat (stop loss: N/A).
GBP/USD:
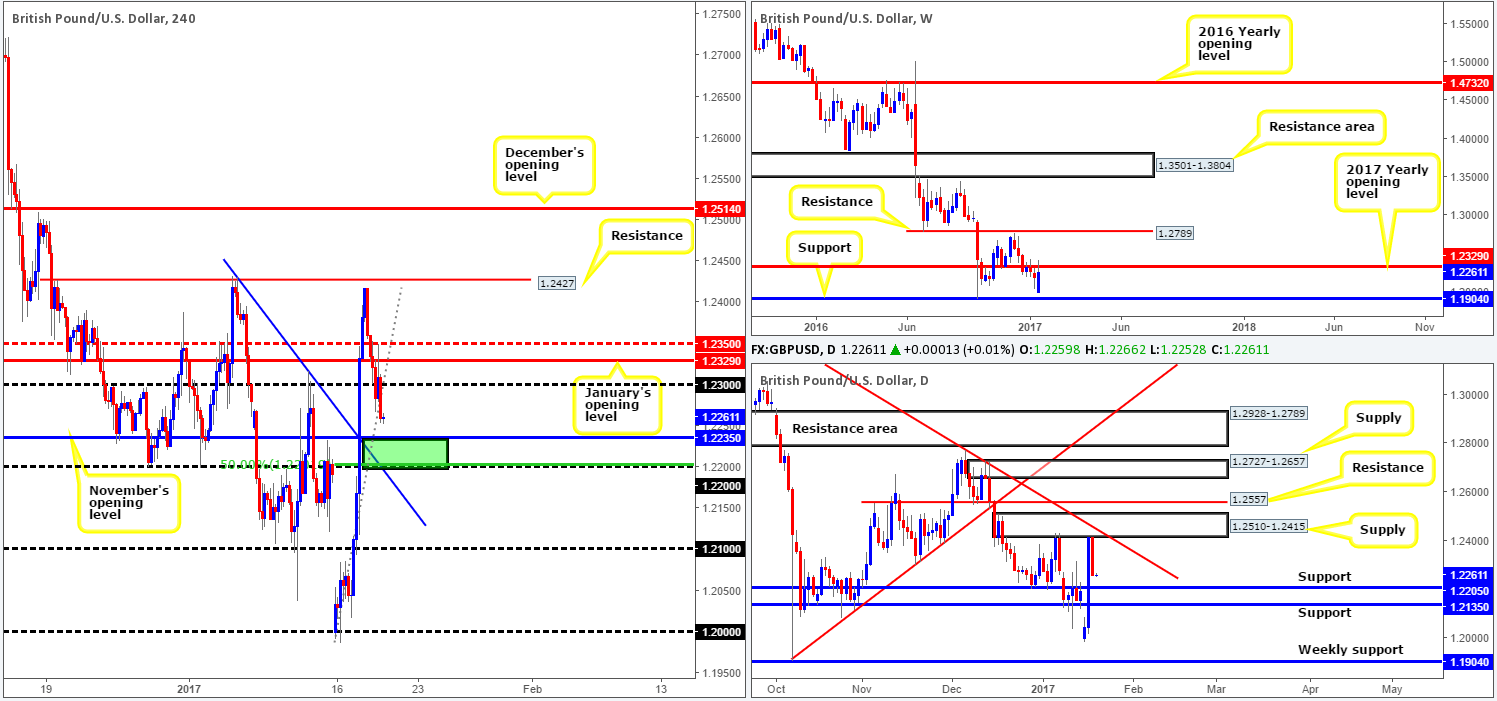
Following Tuesday’s 350-pip advance, enthusiasm waned somewhat during the course of yesterday’s sessions. A moderate bounce was, however, seen from the 1.23 region after the UK reported better-than-expected employment figures. Several H4 tech supports were taken out amid yesterday’s downside correction (helped by the fact that daily action also recently connected with daily supply at 1.2510-1.2415), including the aforementioned round number. The market settled for the day at lows of 1.2253, with market participants now likely eyeing an area of H4 support (marked in green) comprised of the following: November’s opening level at 1.2235, the 1.22 handle, H4 50.0% Fib support at 1.2204 and a H4 trendline support drawn from the high 1.2426. Further adding weight to this zone is the fact that a daily support level sits within at 1.2205.
Our suggestions: The collective confluence seen on the H4 and daily timeframe at the moment is, at least in our book, worthy of consideration. While a bounce from the above noted H4 area is likely, it may be worth noting that the 1.22 handle may attract a possible fakeout. To that end, waiting for lower-timeframe confirming price action to form (see the top of this report for ideas on how to enter using lower-timeframe structure) within the H4 barrier would be the safer route to take.
Data points to consider: US housing data, the Philly Fed manufacturing index report and Jobless claims are all set to be released at 1.30pm GMT.
Levels to watch/live orders:
- Buys: 1.22/1.2235 ([lower-timeframe confirmation is required here before a trade can be executed] stop loss: depends on where one confirms the zone).
- Sells: Flat (stop loss: N/A).
AUD/USD:
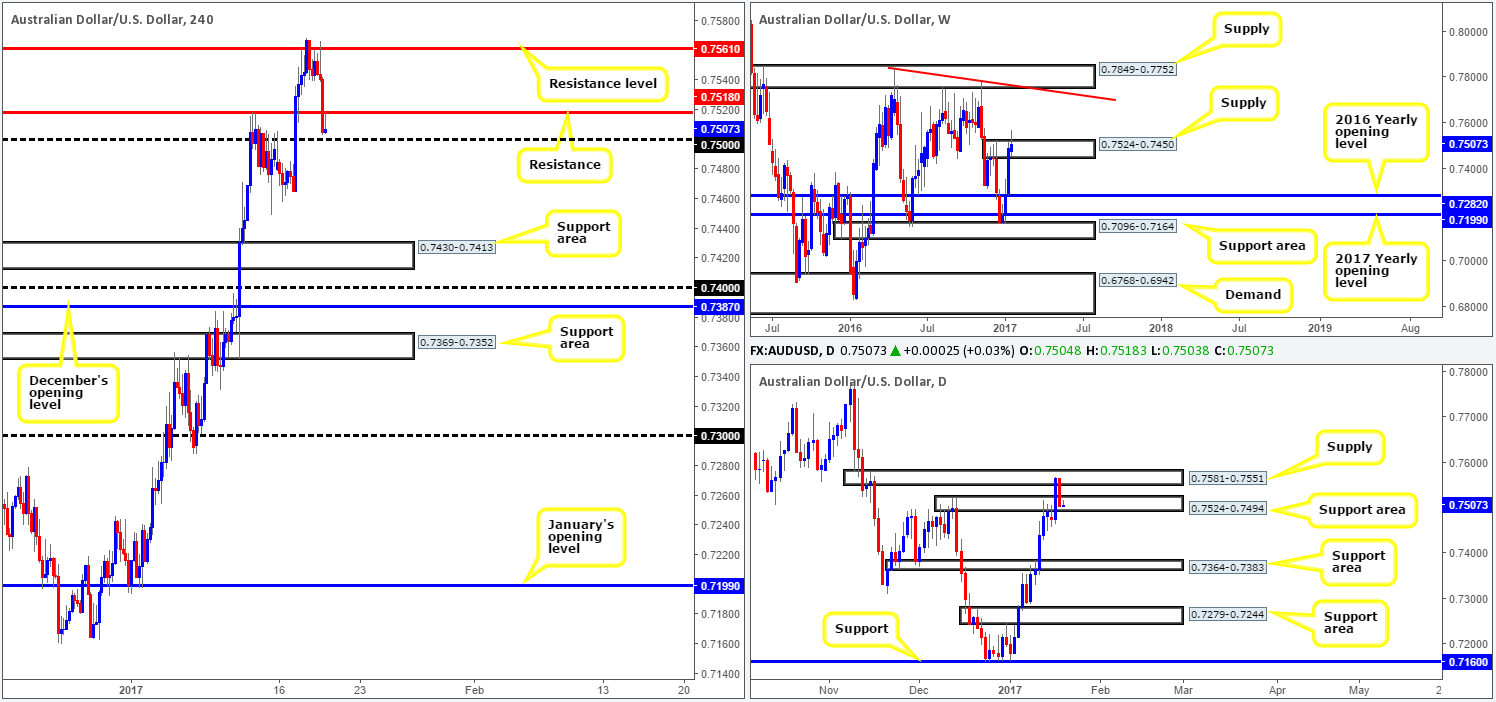
The commodity currency came under pressure yesterday after the H4 candles failed to muster enough strength to conquer the H4 resistance level drawn in at 0.7561. The move was exacerbated by both the slightly hawkish words of Fed Chair Janet Yellen, and the fact that daily supply at 0.7581-0.7551 encapsulated the above noted H4 resistance.
As we write, weekly price is seen trading back within the confines of weekly supply at 0.7524-0.7450, and daily movement recently checked in with a small daily support area formed by 0.7524-0.7494. By and of itself, this places traders in an awkward position: a buy puts one against weekly sellers and a sell puts one against daily buyers!
Looking at the H4 picture, H4 resistance at 0.7518 is being retested right now, but given that the 0.75 handle lurks only a few pips below, one would need to exercise caution selling from here.
Our suggestions: Owing to the conflicting signals coming in from the higher-timeframe charts, and very little space seen for the H4 candles to move, we’ve decided to remain on the sidelines for now and will look to reassess the situation going into tomorrow’s open.
Data points to consider: Aussie employment report at 12.30am. US housing data, the Philly Fed manufacturing index report and Jobless claims are all set to be released at 1.30pm GMT.
Levels to watch/live orders:
- Buys: Flat (stop loss: N/A).
- Sells: Flat (stop loss: N/A).
USD/JPY:
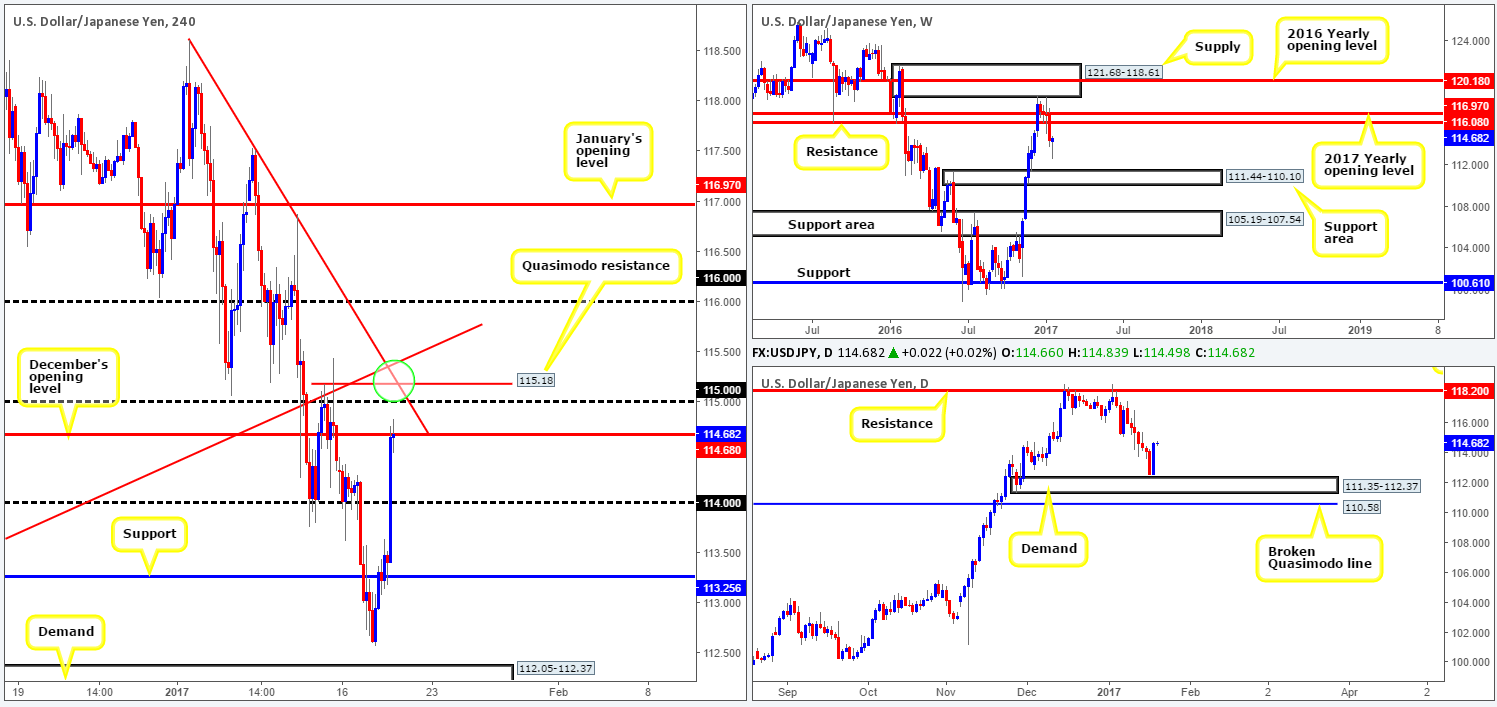
USD/JPY bulls went on the offensive yesterday after the Fed Chair Janet Yellen signaled that if the US economy strengthens, as expected, the central bank stands ready to raise interest rates. The psychological level 114 was wiped out during the course of yesterday’s advance, leaving price action free to challenge December’s opening level at 114.68. While monthly levels are high-probability reversal zones, the more attractive area (see green circle) is seen just above between 115.18 (a H4 Quasimodo resistance) and the round number 115, as it converges beautifully with two H4 trendline resistances (118.61/112.86). As tempting as this area may be, nevertheless, one has to take into account that there is little converging higher-timeframe structure, thus making it difficult to justify placing a pending order here.
Our suggestions: In light of the above points, our desk is advising not to place pending orders at the above said H4 sell zone. Instead, maybe consider opting to wait for a lower-timeframe sell signal to form (see the top of this report for ideas on how to enter using lower-timeframe structure) before pressing the execute button.
Data points to consider: US housing data, the Philly Fed manufacturing index report and Jobless claims are all set to be released at 1.30pm GMT.
Levels to watch/live orders:
- Buys: Flat (stop loss: N/A).
- Sells: 115.18/115 ([lower-timeframe confirmation is required here before a trade can be executed] stop loss: depends on where one confirms the zone).
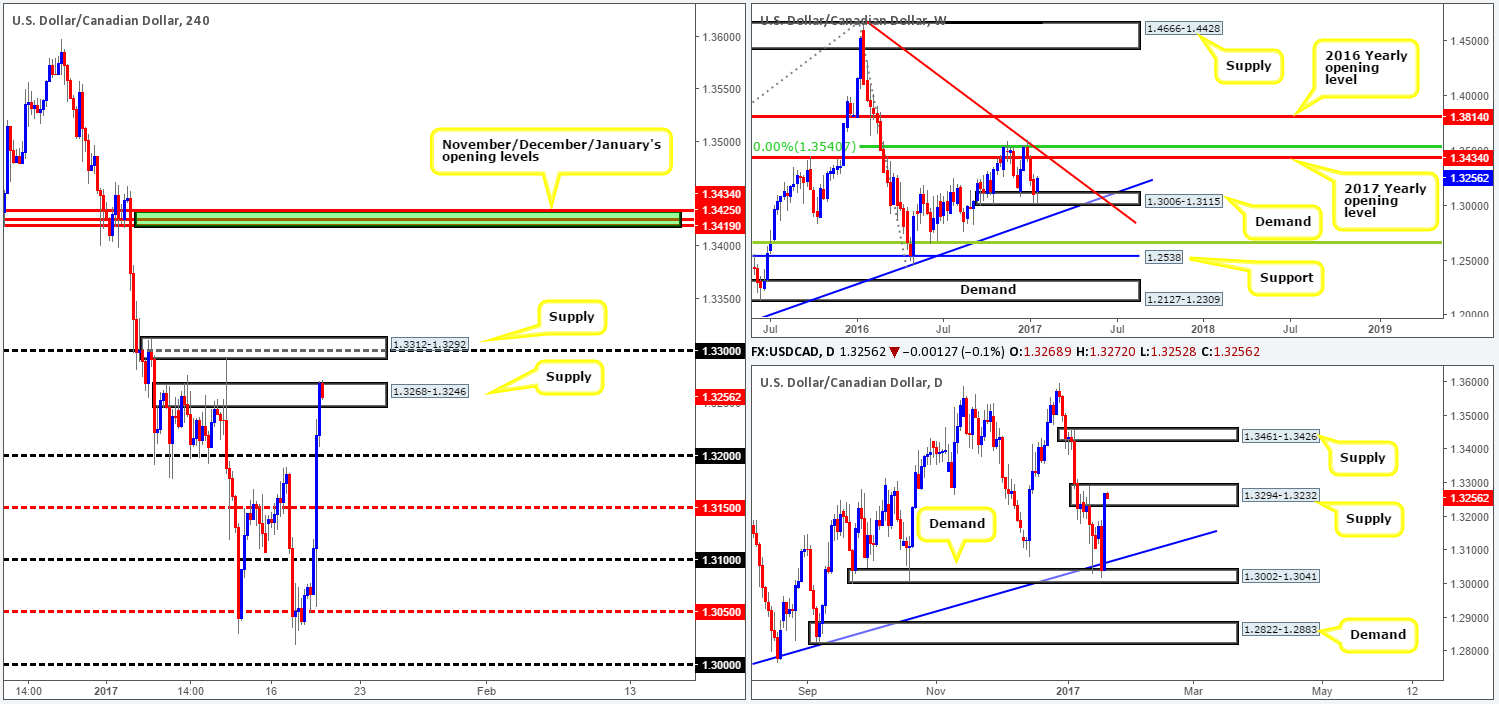
USD/CAD:
Weighed on heavily by the BoC leaving interest rates unchanged, as well as comments made by BoC Gov. Poloz regarding further rate cuts still being an option, helped send the US dollar screaming higher against the Canadian dollar! The move was, however, intensified going into the later stages of the rally, as Fed Chair Janet Yellen signaled the possibility of further rate hikes.
Multiple H4 tech resistances were engulfed yesterday, eventually forcing price to test, and slightly surpass, H4 supply at 1.3268-1.3246. From a technical standpoint, yesterday’s rally should not have come as too much of a surprise. Both weekly and daily price action was seen trading from demand (1.3006-1.3115/ 1.3002-1.3041).
With daily flow now seen flirting with daily supply coming in at 1.3294-1.3232, there’s a chance that price could selloff from the current H4 supply zone. Be that as it may though, one may want to make allowance for that fact that the weekly candles show room to continue rallying north until the 2017 yearly opening level drawn from 1.3434.
Our suggestions: Given the above points, our team will not be looking to buy this market until a H4 close is seen above the H4 supply marked at 1.3312-1.3292. As for shorts, one could look to take advantage of price currently residing within daily supply. However, a short from the current H4 supply or the one above it at 1.3312-1.3292 is considered risky given weekly price (see above). Therefore, waiting for at least a H4 bear candle to form before pulling the trigger would be the more logical approach here we feel.
Data points to consider: Canadian manufacturing sales at 1.30pm, Crude oil inventories at 4pm. US housing data, the Philly Fed manufacturing index report and Jobless claims are all set to be released at 1.30pm GMT.
Levels to watch/live orders:
- Buys: Flat (stop loss: N/A).
- Sells: 1.3268-1.3246/ 1.3312-1.3292 ([a H4 bear candle is required here before a trade can be executed] stop loss: ideally beyond the trigger candle).
USD/CHF:
Fueled by the recent comments made by Fed Chair Janet Yellen on the possibility of future rate hikes, the Swissy extended Tuesday’s bounce from parity (1.0000) yesterday to highs of 1.0075. The next H4 upside objective in view is the psychological boundary 1.01, shadowed closely by H4 supply at 1.0120-1.0107. Before achieving this target, nevertheless, one needs to be prepared for the possibility of a retest around H4 support coming in at 1.0061.
Over on the bigger picture, we can see that weekly price recently bounced off the 2016 yearly opening level at 1.0029, supported further by a daily trendline support extended from the high 0.9956. While this is typically considered a bullish signal, daily price is now seen trading within reaching distance of daily supply fixed at 1.0136-1.0107, which happens to smother the aforementioned H4 supply zone.
Our suggestions: Should price retest the above noted H4 support level, we would be inclined to take an intraday long position from this neighborhood (preferably with lower-timeframe confirmation [see the top of this report]), targeting 1.01. As for selling, we imagine a reaction will be seen from the aforementioned H4 supply base, given its connection to daily supply. However, there’s a solid chance that price may ignore this zone altogether and head for the 2017 yearly opening level at 1.0175, as the weekly timeframe suggests. Therefore, we would exercise caution here and only enter short if you’re able to pin down some form of confirmation, be it a H4 bear candle, or a lower-timeframe sell signal.
Data points to consider: US housing data, the Philly Fed manufacturing index report and Jobless claims are all set to be released at 1.30pm GMT.

Levels to watch/live orders:
- Buys: 1.0061 region ([lower-timeframe confirmation is required here before a trade can be executed] stop loss: depends on where one confirms the zone).
- Sells: 1.0120-1.0107 ([confirmation is required here before a trade can be executed] stop loss: depends on where one confirms the zone).
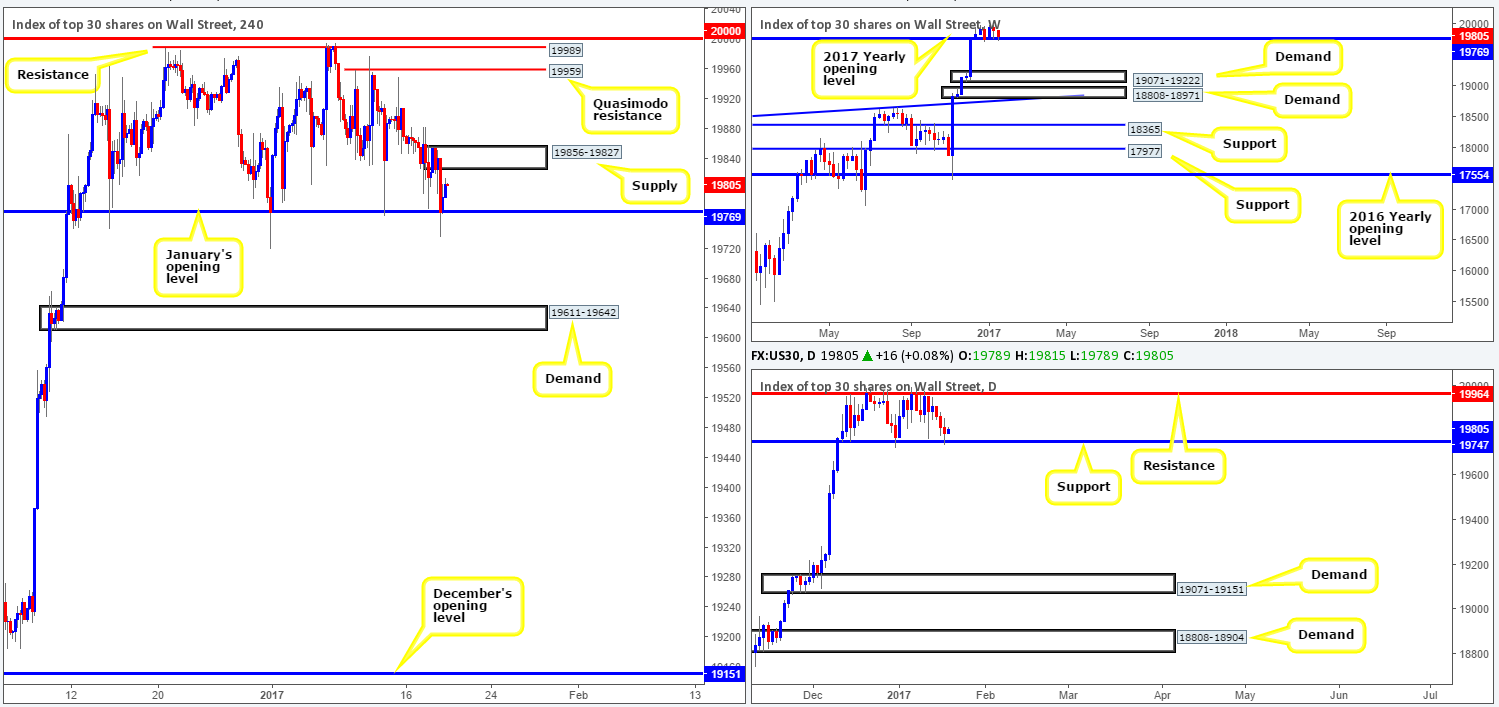
DOW 30:
Yellen’s recent comments, as you can see, helped provide support around January’s opening level at 19769 during yesterday’s American session, with the help of daily support seen a little lower on the curve at 19747. Despite this, the US equity market registered its third consecutive losing day yesterday. To our way of seeing things, a H4 close above the H4 supply at 19856-19827 is required, before our team would consider becoming buyers as the path north would then likely be clear up to the H4 Quasimodo resistance at 19959 (sitting nearby a daily resistance at 19964 – the next upside target on the daily scale).
Our suggestions: Put simply, a H4 close above the current H4 supply zone, followed up with a strong retest as demand would, in our humble opinion, be enough to permit a long in this market up to the aforementioned H4 Quasimodo resistance.
Data points to consider: US housing data, the Philly Fed manufacturing index report and Jobless claims are all set to be released at 1.30pm GMT.
Levels to watch/live orders:
- Buys: Watch for a H4 close above H4 supply at 19856-19827 and then look to trade the retest of this area as demand (stop loss: ideally beyond the trigger candle).
- Sells: Flat (stop loss: N/A).
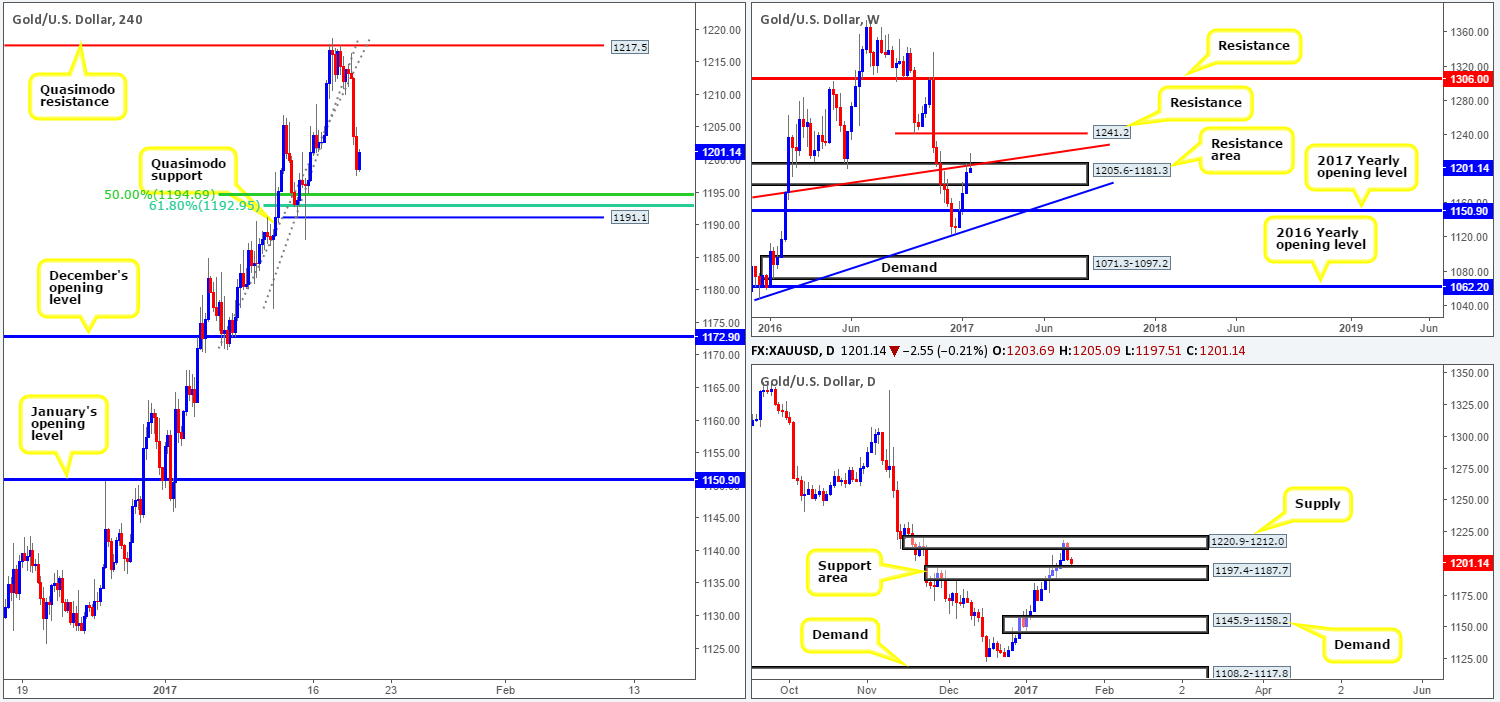
GOLD:
Bolstered by not only the H4 Quasimodo resistance level at 1217.5 holding firm on Tuesday (as well as being positioned within daily supply at 1220.9-1212.0), but also the recent advance in the dollar (sparked by Yellen’s recent comments), the yellow metal experienced a rather significant downside move yesterday.
While H4 structure indicates that further selling could be on the cards today, over on the daily timeframe price has already struck the top edge of a daily support area coming in at 1197.4-1187.7. In support of the H4 candles, however, weekly price is seen trading back within the walls of a weekly resistance area at 1205.6-1181.3, which happens to be fused together with a weekly trendline resistance extended from the low 1130.1.
Our suggestions: Shorting this market at current price is not something our team would feel comfortable taking part in, owing to daily structure. Buying from the mid-range H4 Quasimodo support level at 1191.1, nonetheless, could be an option. This level is encased within the daily support area mentioned above and boasts a relatively nice-looking cluster of H4 Fib supports (50%/61.8%) just above it at 1194.6/1192.9, thus a bounce from here is likely. We say: ‘bounce’ simply because weekly sellers will, in our view, eventually force price beyond this region.
Levels to watch/live orders:
- Buys: 1191.1 ([a H4 bull candle is required here before a trade can be executed] stop loss: ideally beyond the trigger candle).
- Sells: Flat (stop loss: N/A).


