Waiting for lower timeframe confirmation is our main tool to confirm strength within higher timeframe zones, and has really been the key to our trading success. It takes a little time to understand the subtle nuances, however, as each trade is never the same, but once you master the rhythm so to speak, you will be saved from countless unnecessary losing trades. The following is a list of what we look for:
- A break/retest of supply or demand dependent on which way you’re trading.
- A trendline break/retest.
- Buying/selling tails/wicks – essentially we look for a cluster of very obvious spikes off of lower timeframe support and resistance levels within the higher timeframe zone.
- Candlestick patterns. We tend to stick with pin bars and engulfing bars as these have proven to be the most effective.
We typically search for lower-timeframe confirmation between the M15 and H1 timeframes, since most of our higher-timeframe areas begin with the H4. Stops are usually placed 1-3 pips beyond confirming structures.
EUR/USD:
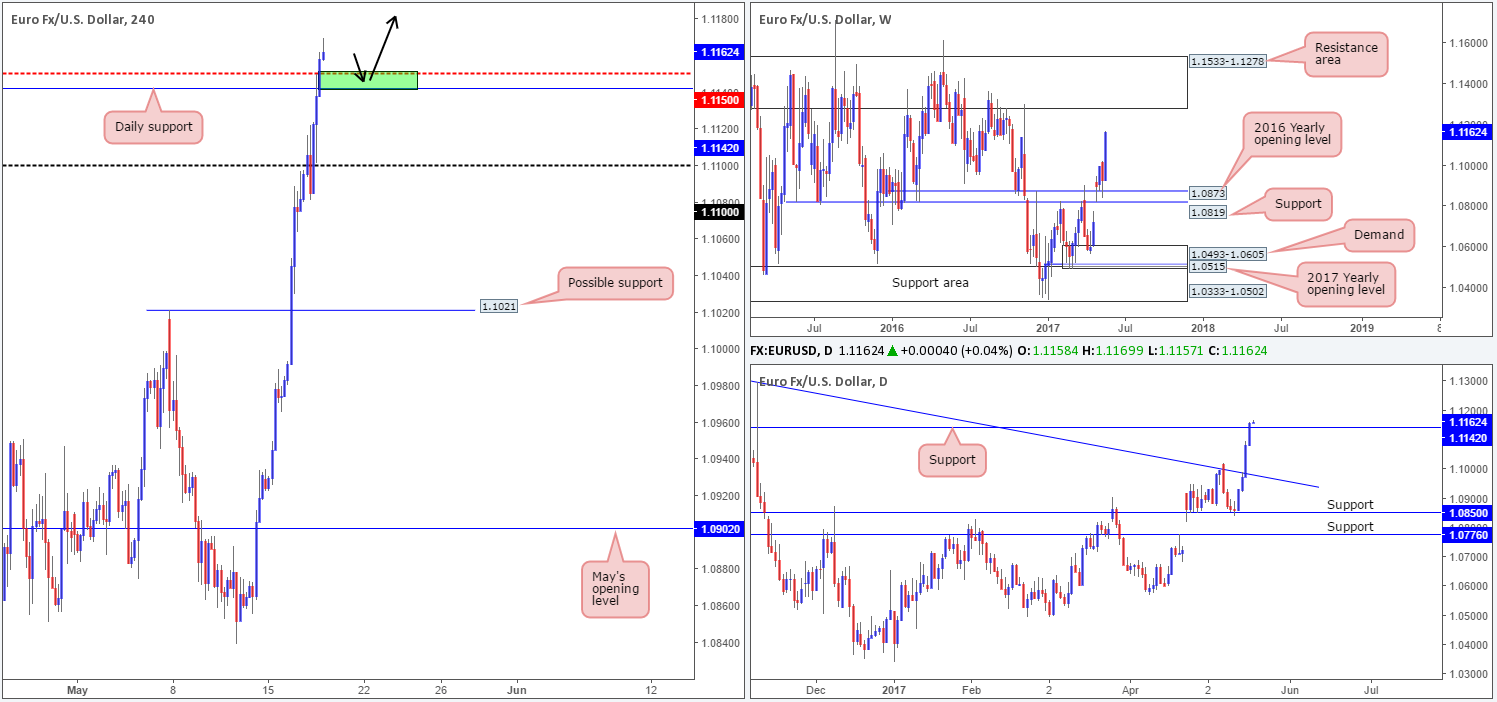
The single currency rallied for a fourth consecutive day on Wednesday, resulting in price closing beyond a daily resistance level coming in at 1.1142. With the US dollar index showing little support until we reach the 97.00ish neighborhood, and the EUR without stable resistance until the weekly resistance area at 1.1533-1.1278, we feel further upside will continue to be seen. To take advantage of this potential advance, we’re watching for H4 price to retest 1.1142/1.1150: the daily support and a H4 mid-level barrier at 1.1150.
Our suggestions: Following a retest of 1.1142/1.1150, we’d be looking for a reasonably sized H4 bullish candle to take shape, preferably a full-bodied candle. This, for us, indicates buyer interest at a high-probability buy zone. The first take-profit target from here would be the 1.12 handle. Nevertheless, the ultimate take-profit zone for this trade is likely to be set around the underside of the weekly resistance area coming in at 1.1278.
Data points to consider: ECB President Draghi speaks at 6pm. US unemployment claims at 1.30pm GMT+1.
Levels to watch/live orders:
- Buys: 1.1142/1.1150 ([waiting for a reasonably sized H4 bull candle, preferably a full-bodied candle, to form before pulling the trigger is advised] stop loss: ideally beyond the candle’s tail).
- Sells: Flat (stop loss: N/A).
GBP/USD:
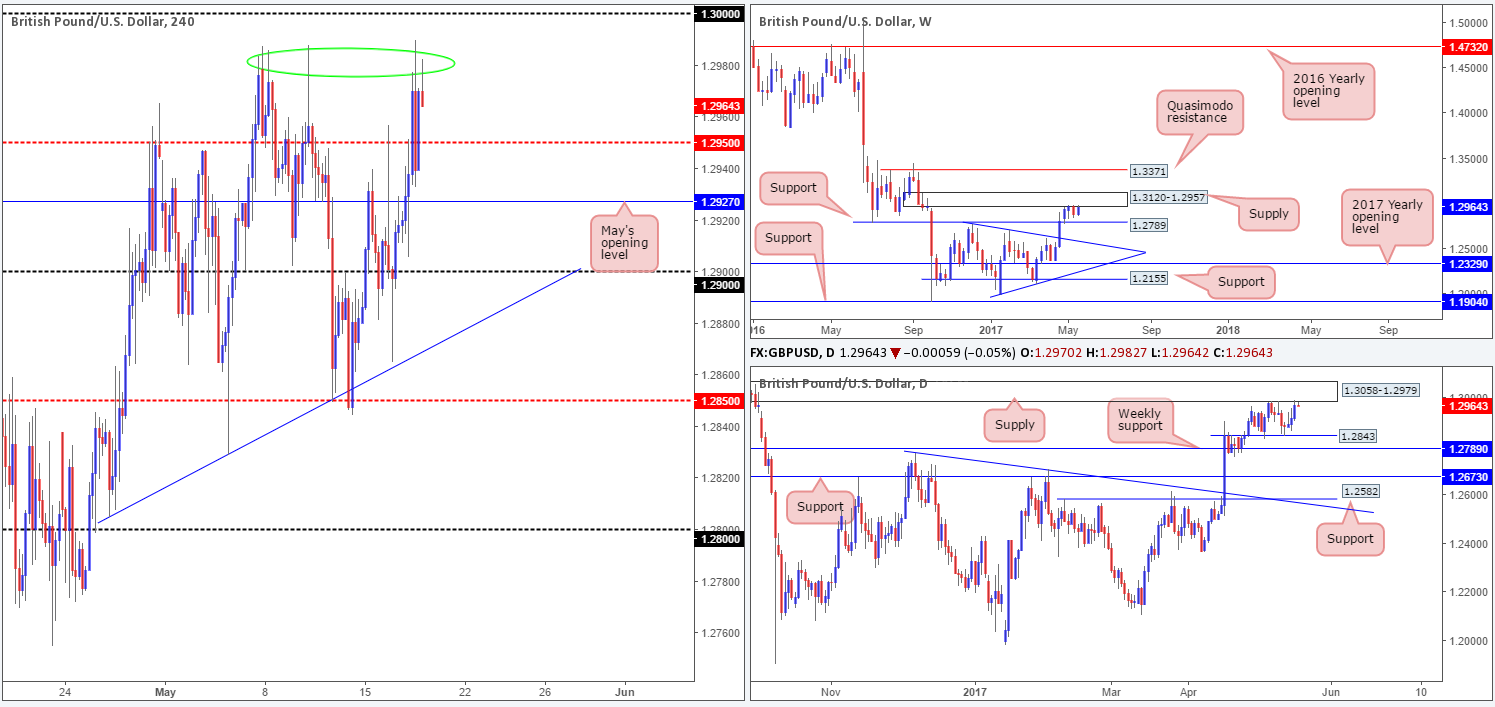
Weighed on heavily by, what seems to be, never-ending selling pressure on the dollar, the GBP advanced higher on Wednesday. This, as you can see on the bigger picture, has lifted the unit up to both a weekly supply area at 1.3120-1.2957, as well as a daily supply zone drawn from within the weekly base at 1.3058-1.2979.
Swinging over to the H4 chart, recent action has formed a rather eye-catching triple top around the 1.2980 vicinity (see the green circle). Although offers seem to be developing here, let’s be mindful to the fact that there’s a humongous psychological level sitting a mere 20 pips above this resistance at 1.30!
Our suggestions: On account of the above, we believe that the odds of H4 price breaking above the triple-top formation is high. There’s likely a truckload of buy stops planted just above these highs, and if we know that, so do smart money. These stops will highly likely provide enough liquidity to fake price to the 1.30 level for a reasonable selling opportunity. Couple all of this with where the instrument is presently trading on the higher-timeframe structure; we believe 1.30 to be a high-probability sell zone.
Because the fakeout will likely be quick and offer little time to secure additional confirmation at 1.30, we would consider entering at market here and targeting the H4 mid-level support at 1.2950 as an initial take-profit zone.
Data points to consider: UK retail sales at 9.30am. US unemployment claims at 1.30pm GMT+1.
Levels to watch/live orders:
- Buys: Flat (stop loss: N/A).
- Sells: 1.30 region (aggressive stops: 1.3015, conservative stops at 1.3060 [above the current daily supply]).
AUD/USD:
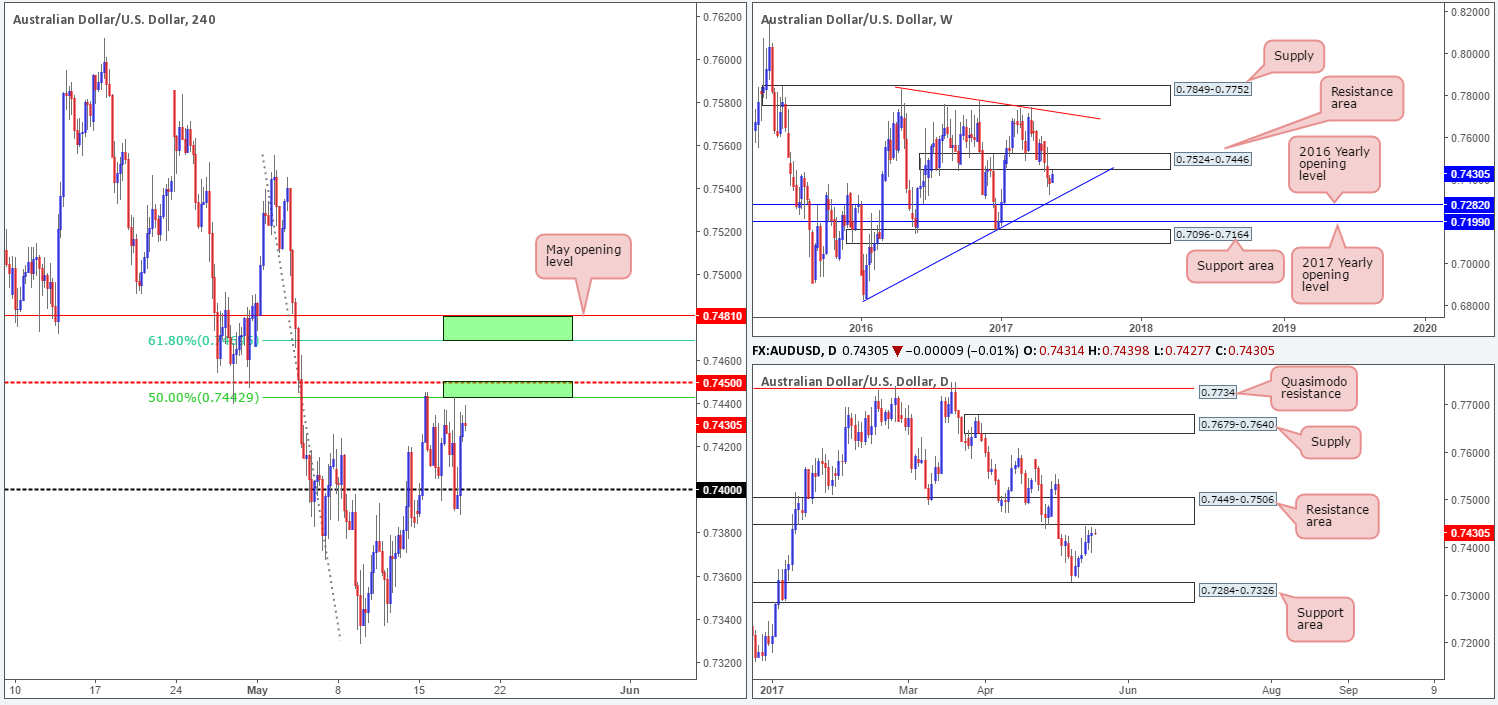
Going into the early hours of London yesterday, the pair aggressively tested the underside of the H4 mid-level resistance at 0.7450/50.0% retracement at 0.7442 taken from the high 0.7556 (lower green zone). This was a noted area to watch, so well done to any of our readers who managed to net some green pips here.
Through the simple lens of a technical trader, the AUD/USD H4 action is currently sandwiched amid the above noted H4 sell zone and the 0.74 handle. The bigger picture on the other hand shows weekly price recently touched base with the underside of a resistance area at 0.7524-0.7446, which has been in motion since mid-2016. In addition to this, the daily timeframe also reveals that price came within touching distance of a resistance area at 0.7449-0.7506.
Our suggestions: In light of the above, our team remains firmly positioned within the sellers’ camp for the time being. Apart from the aforementioned H4 sell zone, which is still useable as a potential area for shorts (this small area represents the underside of both the aforementioned daily and weekly resistance areas), we’re also still watching May’s opening level at 0.7481/H4 61.8% Fib resistance at 0.7470 (upper green zone) for shorts, as this area is actually planted within the above said higher-timeframe barriers.
To take advantage of these H4 areas, we would strongly recommend waiting for price action to confirm seller interest beforehand. Waiting for a reasonably sized H4 bearish candle to form, preferably a full-bodied candle, would be ideal.
Data points to consider: Australian employment figures at 2.30am. US unemployment claims at 1.30pm GMT+1.
Levels to watch/live orders:
- Buys: Flat (stop loss: N/A).
- Sells: 0.7450/0.7442 ([waiting for a reasonably sized H4 bear candle, preferably a full-bodied candle, to form before pulling the trigger is advised] stop loss: ideally beyond the candle’s wick). 0.7481/0.7470 ([waiting for a reasonably sized H4 bear candle, preferably a full-bodied candle, to form before pulling the trigger is advised] stop loss: ideally beyond the candle’s wick).
USD/JPY:
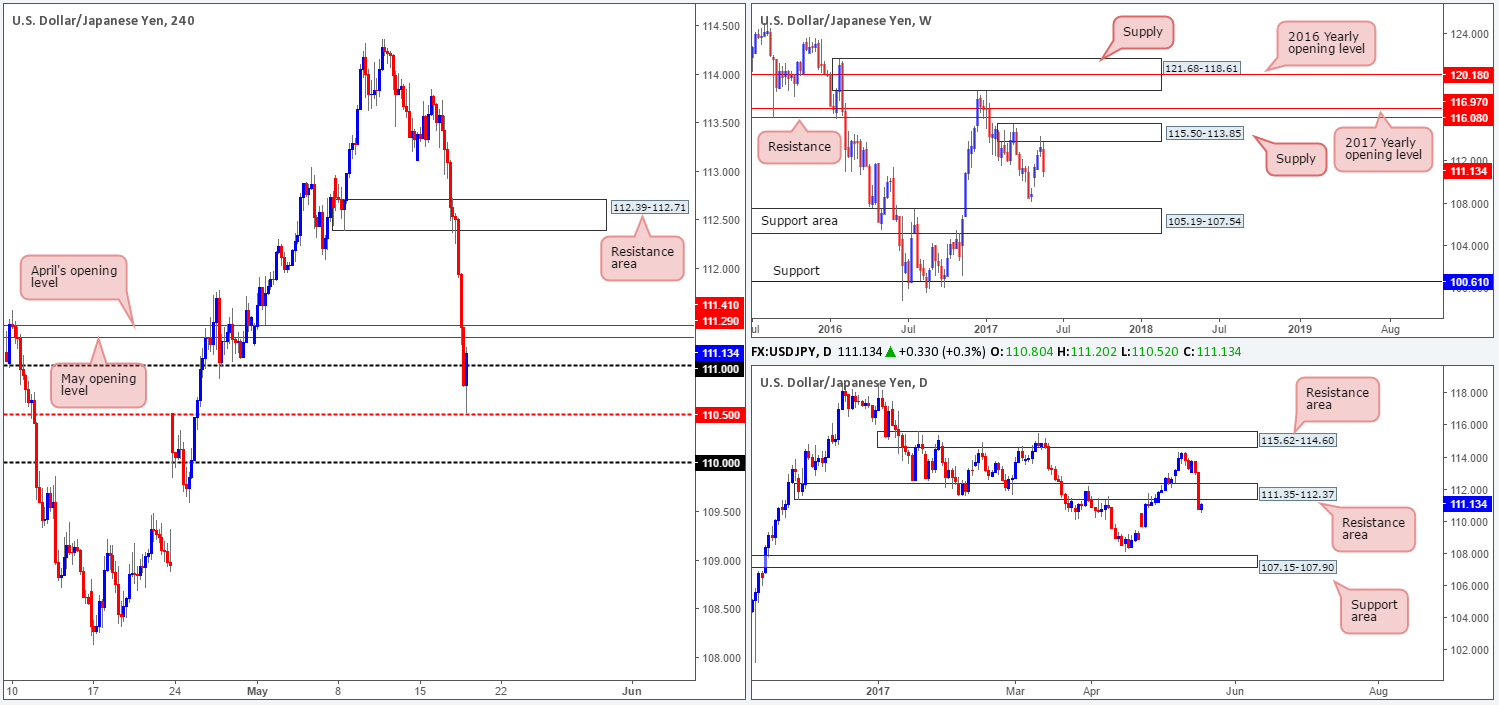
The USD/JPY, as well as US equities, underwent a serious downside correction yesterday. Several H4 tech supports were taken out during the assault, with price recently stabilizing only after reaching the H4 mid-level support at 110.50. As we write, price is seen hovering back above the 111 handle, looking poised to challenge April/May’s opening levels at 111.41/111.29.
With weekly flow indicating that the next downside target, apart from the weekly low of 108.13, is the support area at 105.19-107.54, and daily action looking as though it is going to retest the underside of a resistance area at 111.35-112.37, sell trades are favored.
Our suggestions: In view of the two H4 monthly levels converging nicely with the underside of the said daily resistance area, we feel this would be an ideal base for a short today. The only grumble we have is the 111 handle seen below which could act as support and halt selling. Therefore, what we’d like to see is a H4 bearish rotation candle form from 111.41/111.29 that CLOSES below 111. This, for our team, would be a superb signal to short, targeting 110.50 as an initial take-profit area.
Data points to consider: US unemployment claims at 1.30pm GMT+1.
Levels to watch/live orders:
- Buys: Flat (stop loss: N/A).
- Sells: 111.41/111.29 region ([waiting for a reasonably sized H4 bear candle, preferably a full-bodied candle, to form that closes beyond 111 is advised] stop loss: ideally beyond the candle’s wick).
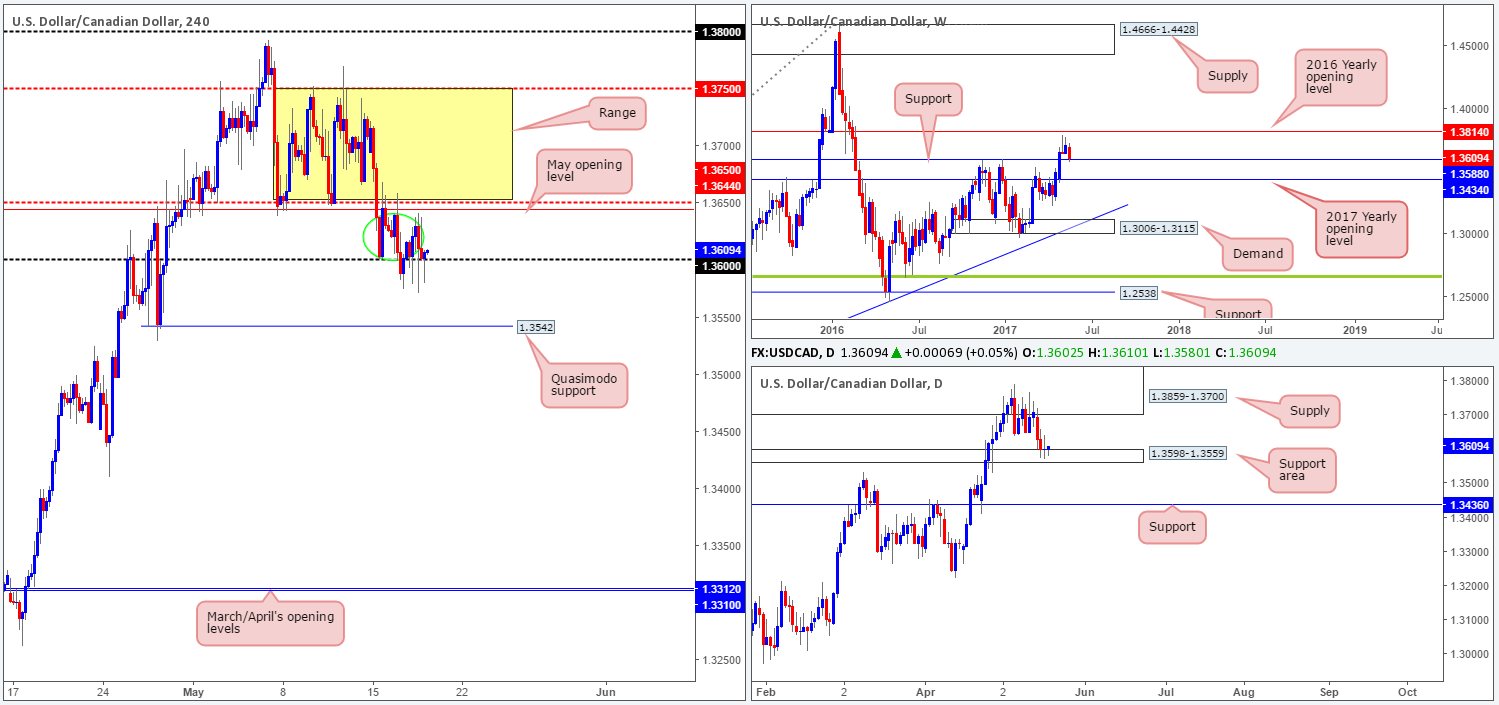
USD/CAD:
The 1.36 handle, as you can see, has been a bit of a support magnet of late, despite multiple attempts to break lower. This could have something to do with that fact that the USD/CAD is also seen testing a daily support area coming in at 1.3598-1.3559 that holds a weekly support level at 1.3588 within.
To our way of seeing things, trading long at current prices is risky. Not only is there a lot of nearby H4 traffic seen circled in green, but there’s also May’s opening level at 1.3644, followed closely by the lower edge of the recent H4 range at 1.3650 to contend with.
Our suggestions: The next best option we have, in our opinion, is waiting for a decisive H4 close above 1.3650 to confirm higher prices may be in order. Should this come to fruition and follow up with a retest of this number and a reasonably sized H4 bull candle, preferably a full-bodied candle, we’d look to long this market, targeting the upper edge of the H4 consolidation sited at 1.3750.
Data points to consider: US unemployment claims at 1.30pm GMT+1.
Levels to watch/live orders:
- Buys: Watch for a H4 close above 1.3650 and then look to trade any retest of this number thereafter ([waiting for a reasonably sized H4 bull candle, preferably a full-bodied candle, to form following the retest before pulling the trigger is advised] stop loss: ideally beyond the candle’s tail).
- Sells: Flat (stop loss: N/A).
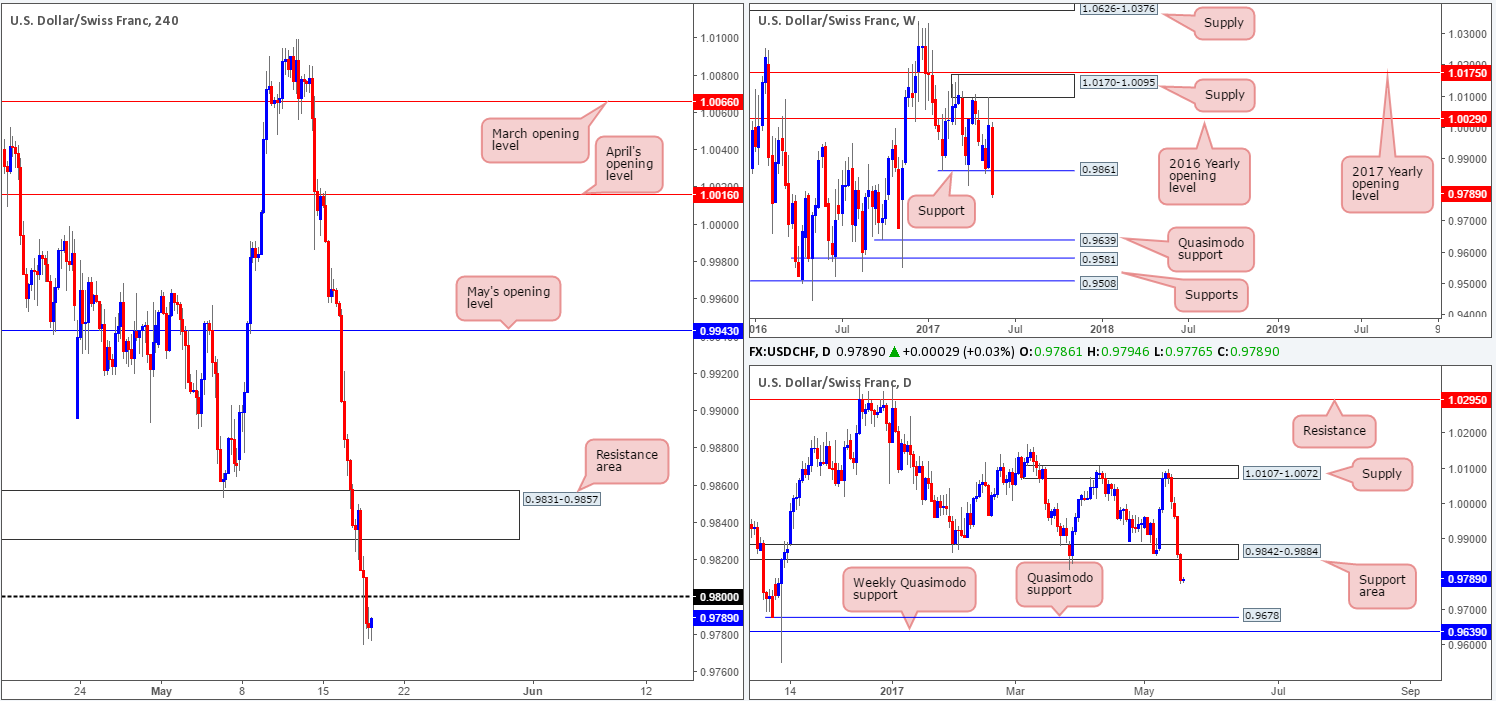
USD/CHF:
H4 demand at 0.9831-0.9857, as you can see, failed to provide support yesterday, forcing the Swissy lower. Following this, price went on to attack the 0.98 handle, which also happened to give way during the later hours of the US segment. This break lower – coupled with higher-timeframe structure could imply further downside is on the cards today. The daily support area at 0.9842-0.9884, which happens to hold the weekly support level at 0.9861 within, was taken out yesterday in strong fashion. In our estimation, this has placed the daily Quasimodo support at 0.9678 in view, followed closely by a weekly Quasimodo support penciled in at 0.9639.
Our suggestions: Given that downside is clearly favored at the moment, we have our eye on trading any retest seen at 0.98. A reasonably sized H4 bearish candle printed from this number (preferably a full-bodied candle) would be enough evidence to short, targeting the 0.97 handle, which sits just above the said daily/weekly Quasimodo support levels.
Data points to consider: US unemployment claims at 1.30pm GMT+1.
Levels to watch/live orders:
- Buys: Flat (stop loss: N/A).
- Sells: 0.98 region ([waiting for a reasonably sized H4 bear candle, preferably a full-bodied candle, to form before pulling the trigger is advised] stop loss: ideally beyond the candle’s wick).
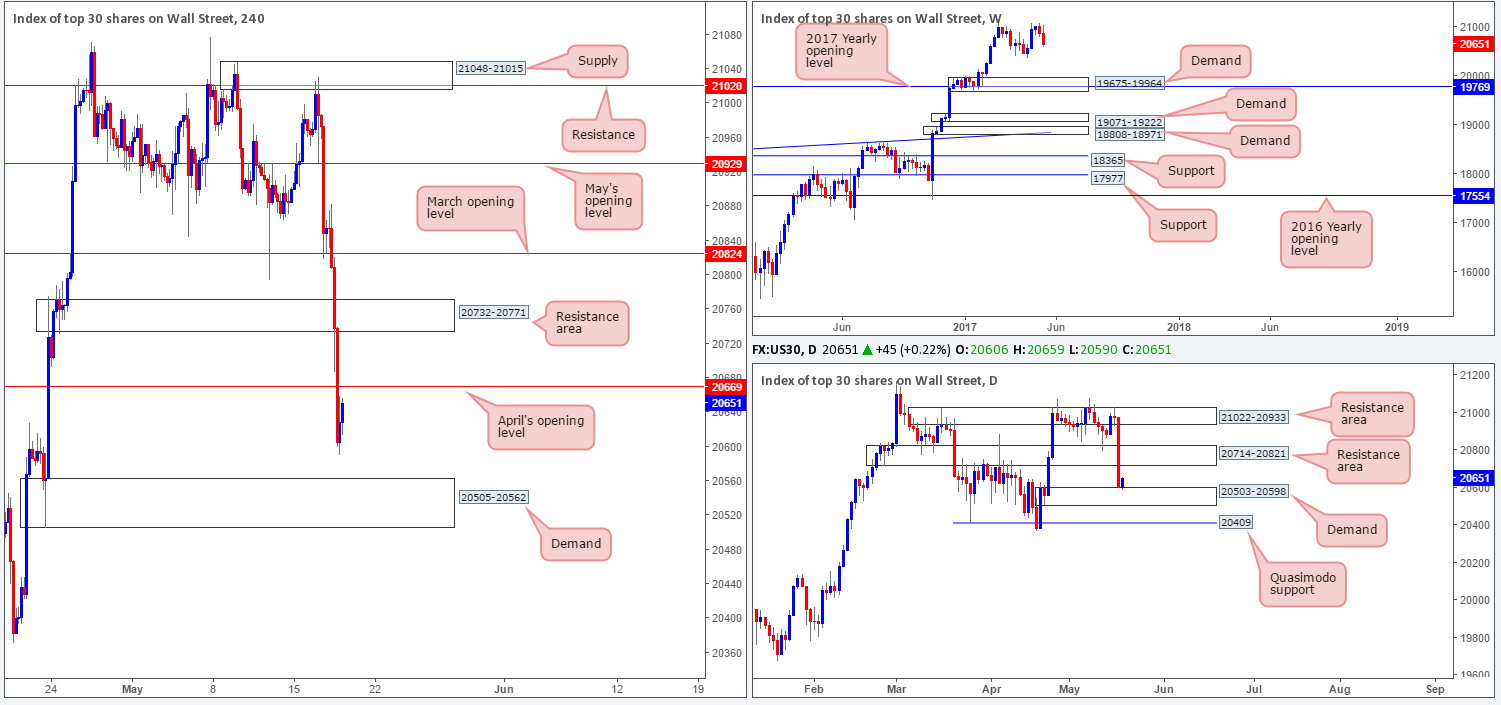
DOW 30:
(Trade update: Took a loss at 20710).
US equities aggressively tumbled lower on Wednesday, as mayhem surrounding the Trump administration shook global markets. H4 price took out several tech supports and ended bottoming just ahead of demand coming in at 20505-20562. As we write, the market is bid and looks poised to challenge the underside of April’s opening level at 20669. However, on the other side of the field, daily demand at 20503-20598 was recently brought into the action, which could potentially force the index up to a resistance area drawn from 20714-20821.
Our suggestions: From our perspective, neither a long nor short seems attractive at this time. Buying into a monthly opening level from the daily demand base would not be something we’d look to accommodate. By the same token, selling from this monthly line would be just as risky given the daily demand currently in motion. With that in mind, we’ll remain on the sidelines for now and wait for further developments.
Data points to consider: US unemployment claims at 1.30pm GMT+1.
Levels to watch/live orders:
- Buys: Flat (stop loss: N/A).
- Sells: Flat (stop loss: N/A).
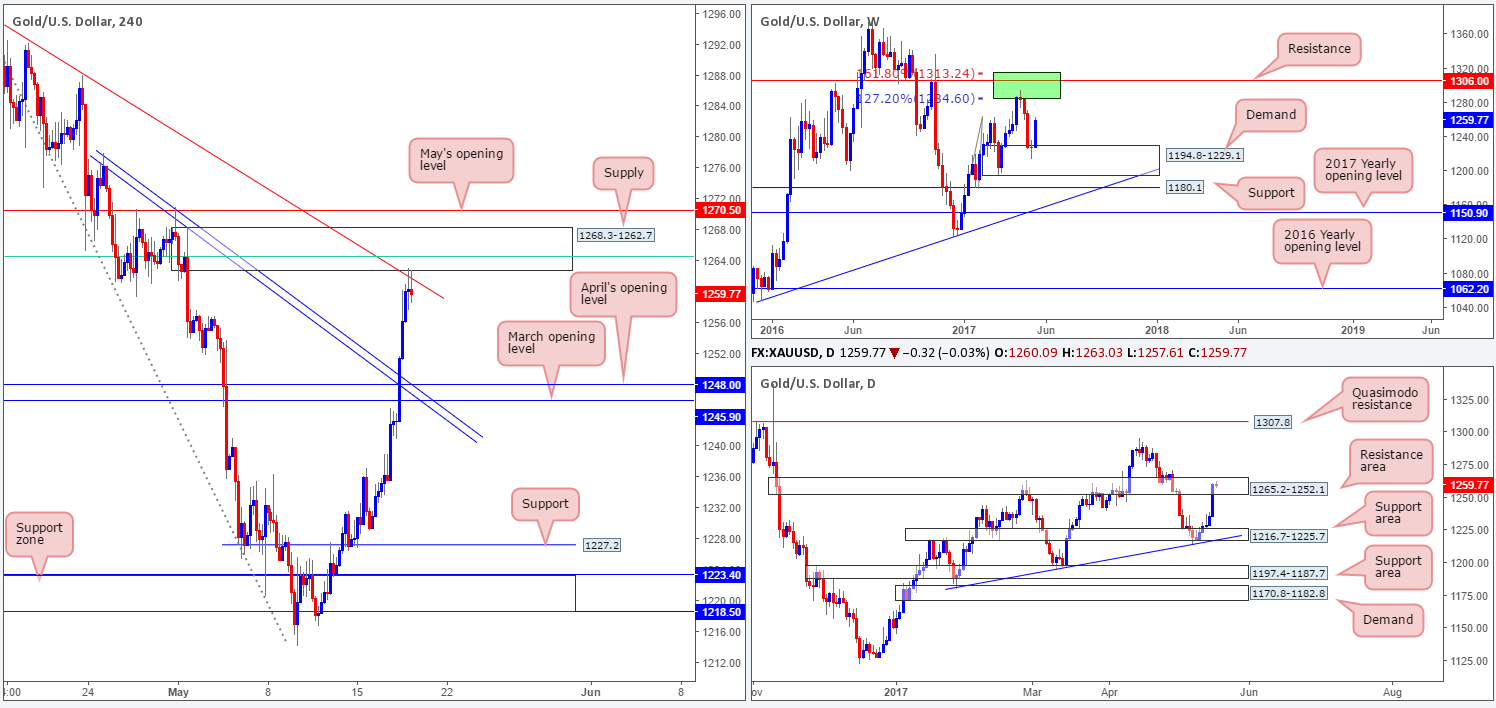
GOLD:
US dollar weakness has provided a strong bid of safe-haven buying in the gold market in recent days. Yesterday’s session saw multiple H4 resistances taken out, which led to price testing a H4 supply barrier coming in at 1268.3-1262.7. This area also brings together a collection of noteworthy resistances: a H4 61.8% Fib resistance at 1264.5 (green line) extended from the high 1295.4 and a H4 trendline resistance (again) taken from the high 1295.4.
This – coupled with the H4 selling wicks beginning to form around the said H4 supply, and the fact that daily price is currently trading within the walls of a resistance area drawn from 1265.2-1252.1, sellers may make an appearance today. However, there’s one rather large cautionary point to consider here, traders. Price recently bounced strongly from weekly demand at 1194.8-1229.1 and shows room to extend higher!
Our suggestions: Selling from the current H4 supply zone is, of course, a risky play given the weekly picture. With that being said though, we still feel a short from here is high probability should the current H4 candle close on or very near its lows. In the event that a sell from here comes to fruition, we’d be eyeing March/April’s opening levels at 1245.9/1248.0 as our take-profit target.
Levels to watch/live orders:
- Buys: Flat (stop loss: N/A).
- Sells: 1268.3-1262.7 ([possible shorts from here if the current H4 candle closes on or very near its lows] stop loss: ideally beyond the candle’s wick).


