EUR/USD:
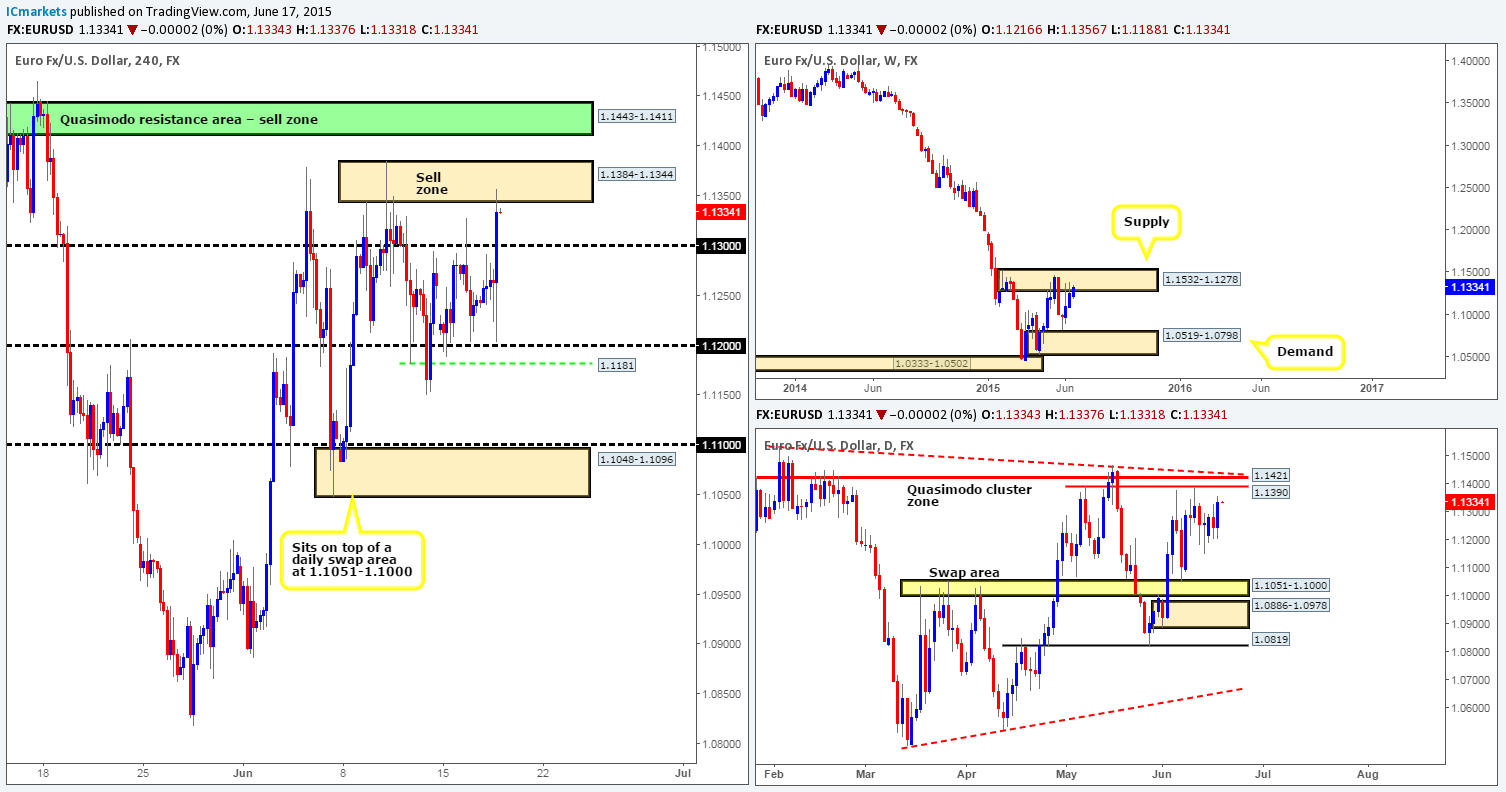
Weekly view: The weekly timeframe shows that price is trading within a weekly supply area coming in at 1.1532-1.1278.This supply zone is a very significant hurdle in our opinion (held price lower since the 11th May) since if there’s a sustained break above this area, our long-term bias (currently short) on this pair will very likely shift north.
Daily view: Thanks to yesterday’s advance, price is now lingering only sixty or so pips below a daily Quasimodo cluster zone at 1.1390/1.1421 (located relatively deep within the aforementioned weekly supply area), so for anyone who is considering longs on this pair may want to take a note of this.
4hr view: The latest coming in from the 4hr timeframe reveals price has just recently taken out the round number 1.1300, and slam dunked itself into the jaws of a 4hr Quasimodo resistance base at 1.1384-1.1344. Given that the weekly timeframe shows price in supply (see above) at the moment, we are going to be keeping a close eye on price action around this 4hr zone today. Should we see a confirmed lower timeframe setup here, our first potential trouble area will likely be around the recently consumed 1.1300 number.
Nevertheless, as we can see from the daily timeframe there is still room for price to move further north yet. Therefore, in the event that further upside is seen, our attention will shift towards the 4hr Quasimodo resistance base in green just above at 1.1443-1.1411 (encapsulates the aforementioned daily Quasimodo cluster zone) for possible shorting opportunities.
Levels to watch/live orders:
- Buys: Flat (Stop loss: N/A).
- Sells: 1.1384-1.1344 [Tentative – confirmation required] (Stop loss: dependent on where one confirms this area) 1.1443-1.1411 [Tentative – confirmation required] (Stop loss: dependent on where one confirms this area).
GBP/USD:
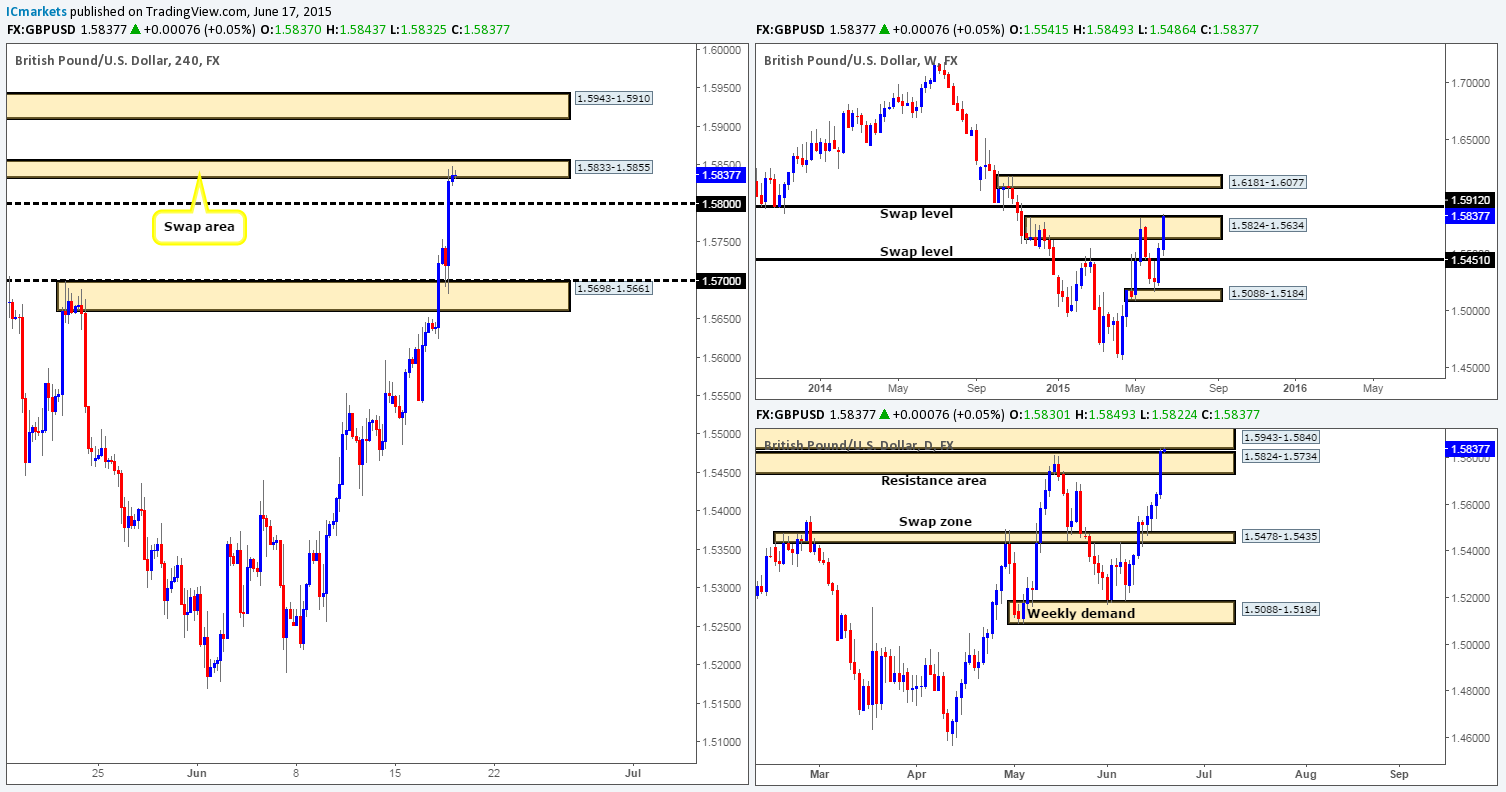
Weekly view – The weekly timeframe shows that price recently spiked above a weekly supply barrier seen at 1.5824-1.5634. Assuming that this move has taken out the majority of sellers around this zone, the path north could potentially be free now up to a weekly swap level coming in at 1 5912.
Daily view: Yesterday’s action saw price break above a daily resistance area (located deep within the weekly supply area mentioned above at 1.5824-1.5634) at 1.5824-1.5734, which immediately forced the GBP shake hands with a daily supply area sitting just above it at 1.5943-1.5840.
4hr view: From this angle, we can see that the recent advance on this pair took out several 4hr technical barriers, which consequently saw price connect with a 4hr swap area coming in at 1.5833-1.5855. Shorting from this 4hr zone today is certainly a possibility, since price is still trading within supply on both the weekly and daily charts (see above). Ultimately though, we’re a little concerned about the potential 4hr support lingering just below at 1.5800. If we see this number consumed, and price retrace, we’d more than likely take the plunge and short this market. For now though, we’re going to simply watch and see how things develop.
In the event that this market continues to rally going into today’s sessions, nonetheless, it is likely we’ll see price touch gloves with a 4hr supply area at 1.5943-1.5910 (located deep within the daily supply area mentioned above at 1.5943-1.5840).
Levels to watch/ live orders:
- Buys: Flat (Stop loss: N/A).
- Sells: Flat (Stop loss: N/A).
AUD/USD:
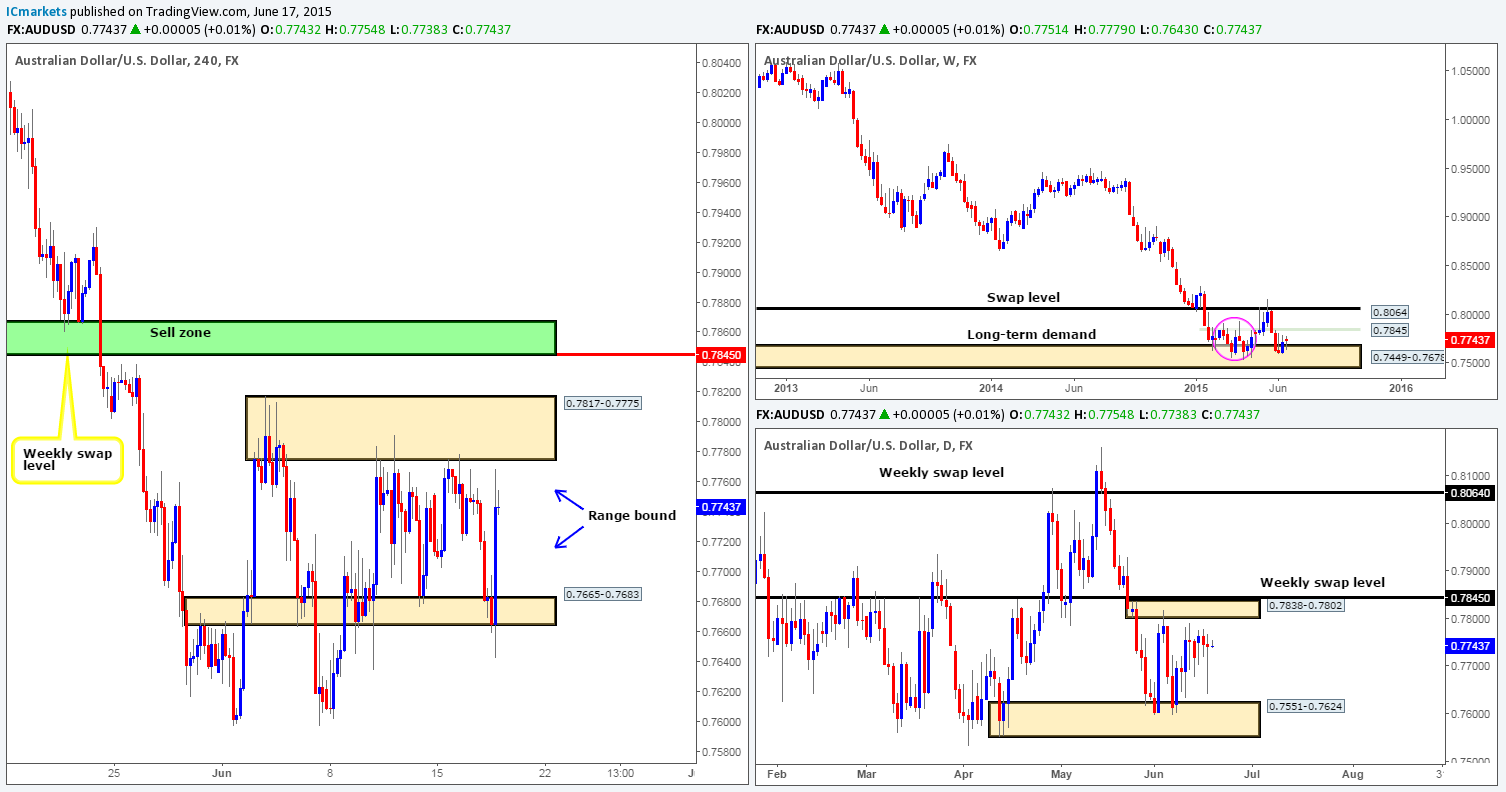
Weekly view – Last week saw buying interest come into the market from within the weekly demand area at 0.7449-0.7678. In the event that the buyers can continue with this intensity going into the rest of this week, we see very little stopping price from connecting with the minor weekly swap level at 0.7845. However, judging by the sloppy reaction seen (pink circle – 02/02/15-06/04/15) between these two aforementioned weekly areas a few months earlier, things could potentially get messy here again before we see any decisive move take place. From a long-term perspective, nonetheless, the trend direction on this pair is still very much south in our opinion, and will remain this way until we see a convincing break above 0.8064.
Daily view: From the pits of the daily scale, it appears that price has begun to chisel out a consolidation zone between a small daily supply area at 0.7838-0.7802 (positioned just below a minor weekly swap level at 0.7845), and a daily demand area coming in at 0.7551-0.7624. As you can probably see though, price remains trading quite close to the upper limits of this range, so if you’re considering longs today, you may want to take a note of this.
4hr view: The 4hr consolidation area has expanded as of yesterday due to the recent volatility seen on this pair. The upper limit remains the same – a 4hr supply area at 0.7817-0.7775 – the new lower limit comes in at 0.7665-0.7683 – a 4hr swap zone.
Even though our 4hr range has widened, much of our previous analysis still holds. Trading in between this 150-pip range is certainly a possibility today (potential buys: 0.7686 sells: 0.7770). Nonetheless, we would strongly advise only doing so once you see some sort of confirmation signal from the lower timeframes, since fakeouts are common within ranging environments such as this.
Considering where price is located on the higher timeframe picture (we’re mainly referring to the weekly timeframe here) at the moment; we feel that the market will eventually break out north from this consolidation. This, as you can see on the 4hr timeframe, would likely force price to collide with the weekly swap level 0.7845 – a perfect sell zone (green area: 0.7867/0.7845). We firmly believe that this area will at the very least likely see a bounce, and in preparation for this, our team has placed a pending sell order just below this zone at 0.7842 with a stop set above at 0.7875.
Levels to watch/ live orders:
- Buys: 0.7686 [Tentative – confirmation required] (Stop loss: 0.7660).
- Sells: 0.7770 [Tentative – confirmation required] (Stop loss: 0.7821) 0.7842 (Stop loss: 0.7875).
USD/JPY:
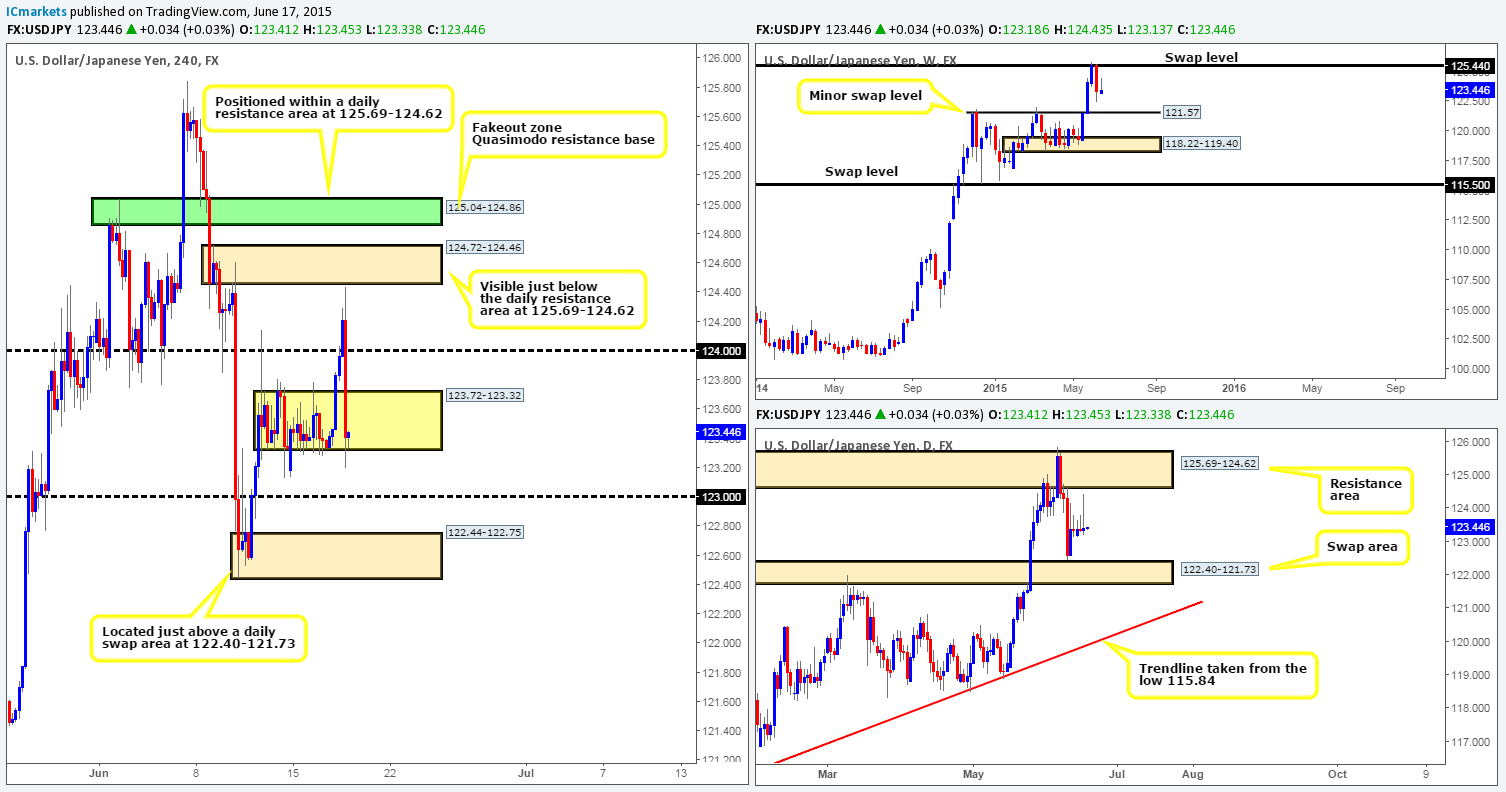
Weekly view – Last week’s activity saw the USD/JPY sell off from a weekly swap level at 125.44, consequently wiping out any gains accumulated in the week before last. On the assumption that the sellers can continue with this tempo going into the rest of this week, we believe there’s a very good chance that price will greet the minor weekly swap level seen at 121.57. Despite this recent decline in value, however, the long-term uptrend on this pair is still very much intact, and will remain that way in our opinion until the weekly swap level 115.50 is consumed.
Daily view: The daily timeframe on the other hand, shows that price is now trading mid-range in between a daily resistance area at 125.69-124.62 and a long-term daily swap zone coming in at 122.40-121.73 (sits just above the minor weekly swap level just mentioned at 121.57).
4hr view: Throughout the course of yesterday’s sessions, price broke out of the yellow 4hr consolidation (123.72-123.32) area, which as you can see, took out 124.00 and came within touching distance of connecting with a 4hr supply area at 124.72-124.46. Following this, price sold off back into the lower limits of the 4hr range. Therefore, although we have seen volatility on this pair, there has not been much change from a technical standpoint. As a result, we’re going to continue watching the levels we mentioned in our previous analysis today for potential (lower timeframe confirmed) trading opportunities:
Buy zones we have on our watch list are as follows:
- The round number 123.00.
- The 4hr demand area at 122.44-122.75 (located just above the aforementioned daily swap area).
Sell zones we have on our watch list are as follows:
- The round number 124.00.
- The 4hr supply area coming in at 124.72-124.46 (located just below the daily resistance area at 125.69-124.62). Something to note regarding this 4hr supply zone is the 4hr Quasimodo resistance base seen just above it. Keep a close eye on this area as fakeouts above supply (in this case) into obvious Quasimodo base areas are very common.
Levels to watch/ live orders:
- Buys: 123.00 [Tentative – confirmation required] (Stop loss: dependent on where one confirms this level) 122.44-122.75 [Tentative – confirmation required] (Stop loss: 122.38).
- Sells: 124.00 [Tentative – confirmation required] (Stop loss: dependent on where one confirms this level) 124.72-124.46 [Tentative – confirmation required] (Stop loss: 125.08).
USD/CAD:
Weekly view – During last week’s trading, price sold off from a weekly swap level coming in at 1.2439. Provided that the sellers can continue with this tempo, we feel that there is a good chance that price will connect with the weekly swap area seen in yellow at 1.2034-1.1870. Despite the fact that this market is now in the red so to speak, our long-term bias on this pair remains long, and it will only be once/if we see a break below the aforementioned weekly swap area would our present bias likely shift.
Daily view: The daily timeframe on the other hand, shows that buyers begun defending a daily demand barrier at 1.2167-1.2255 from Thursday onwards last week. Nonetheless, until we see a clean break above the near-term daily swap level seen just above it at 1.2366, it is difficult for us to be bullish on this pair.
4hr view: The USD/CAD recently sold off from 4hr supply at 1.2351-1.2324, consequently taking out both 1.2300 and 1.2250. This move has very likely opened the gates for further downside today towards the 1.2200 number/ 4hr demand area at 1.2171-1.2191 (located deep within the aforementioned daily demand area). Buying from here is certainly not out of the question for us, since let’s not forget that price is also located within daily demand as well (see above). While this may be true, we still have to take into account that there is little support coming in from the weekly timeframe until price connects with the aforementioned weekly swap area. Therefore, should we buy from 1.2200 or the 4hr demand area at 1.2171-1.2191, it will be done so only with very attractive lower timeframe confirmation.
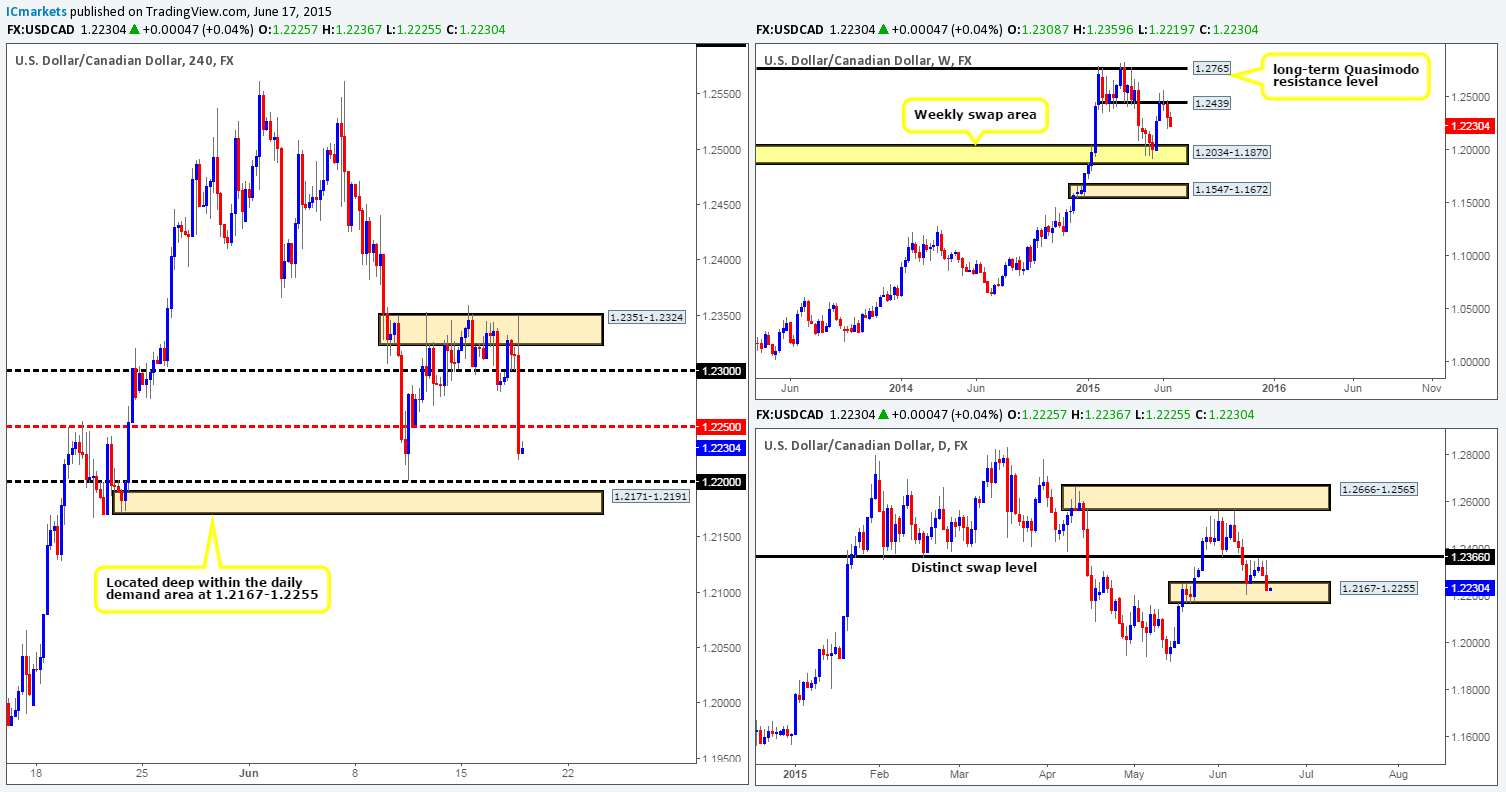
Levels to watch/ live orders:
- Buys: 1.2200 [Tentative – confirmation required] (Stop loss: dependent on where one confirms this level) 1.2171-1.2191 [Tentative – confirmation required] (Stop loss: 1.2165).
- Sells: Flat (Stop loss: N/A).
USD/CHF:
Weekly view – From the weekly timeframe, we can see that price has continued to spiral south from the initial rebound at 0.9512. Should the sellers be able to continue with this intensity, it is likely we’ll see price shake hands with the weekly swap area seen below at 0.9074-0.9000 either today or tomorrow.
Daily view: The buyers finally gave in yesterday as price crashed through the daily trendline taken from the low 0.8299. As per this timeframe, we see very little stopping price from continuing down towards the daily demand area at 0.9077-0.9147 (located just above the aforementioned weekly swap area).
4hr view: The recent fall on this pair forced price to break below the 4hr consolidation area between 0.9406-0.9367 and 0.9232-0.9266. This, as you can see resulted in price colliding with a 4hr demand area at 0.9164-0.9217, which sits a little above the aforementioned daily demand zone. We agree that this current 4hr demand zone is fresh, and may see a bounce, but we’re quite confident that it will be taken out later on today/ tomorrow. The reason for why simply comes from the following:
- Little to no support seen on the higher timeframe picture until price reaches the daily demand area at 0.9077-0.9147.
- A 4hr Harmonic Bat reversal zone seen in green at 0.9162-0.9131 is positioned just below the current 4hr demand zone, which if you look over to the daily chart, you’ll see is located just within the aforementioned daily demand area.
Therefore, since the current 4hr demand zone is positioned a little above the daily demand area, we can likely expect a fakeout below here into the aforementioned 4hr Harmonic reversal zone, which is where we intend to begin looking for buy trades.
In addition to the above, we’d also consider a short position should price retest the recently broken 4hr demand area at 0.9232-0.9266. Obviously the target for this trade would be around the upper limit of the 4hr Harmonic reversal zone.
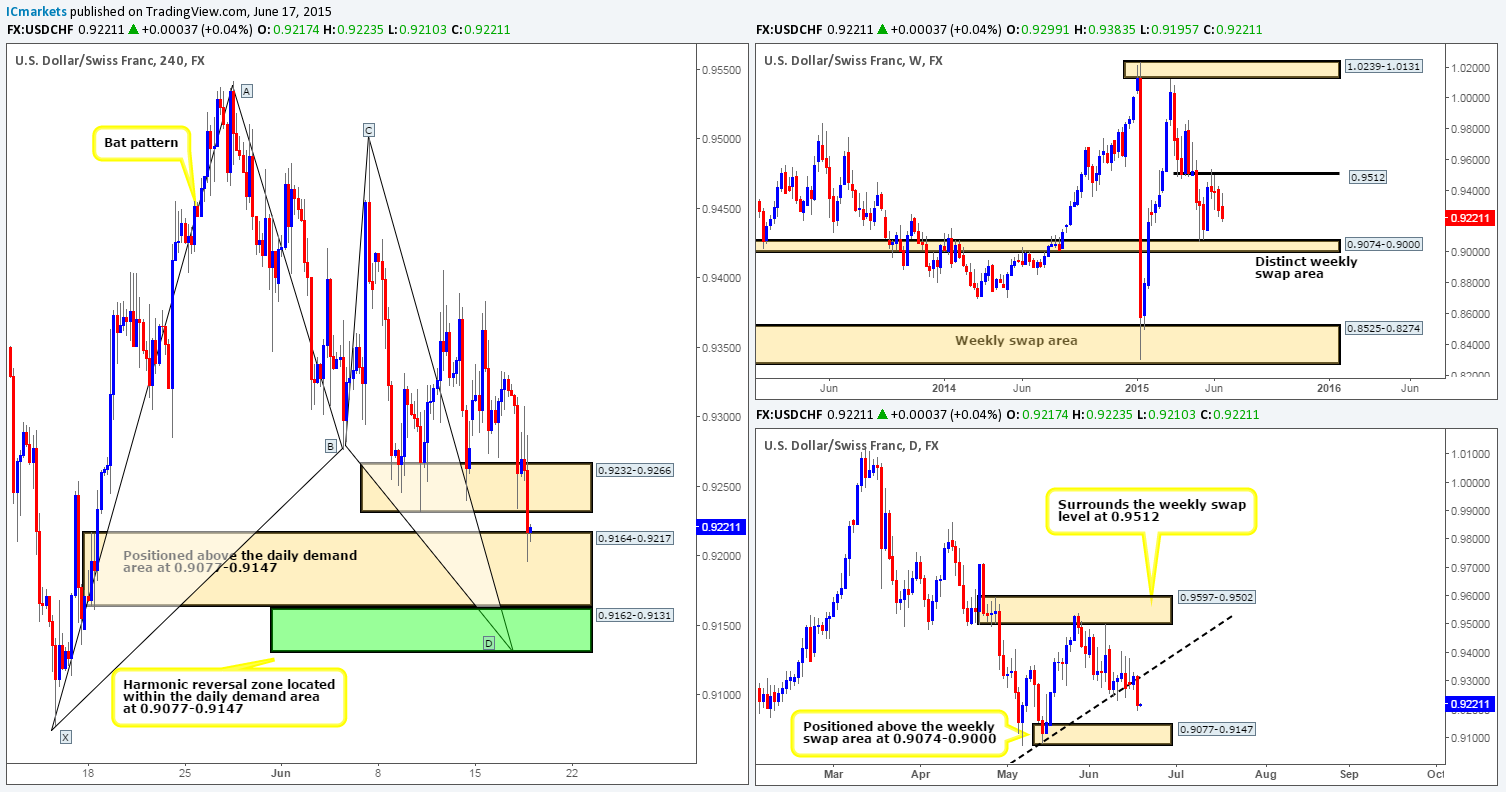
Levels to watch/ live orders:
- Buys: 0.9162-0.9131 [Tentative – confirmation required) (Stop loss: 0.9126).
- Sells: 0.9232-0.9266 [Tentative – confirmation required] (Stop loss: 0.9271).
US 30:
Weekly view – (Slightly revised) As far as we can see, price is currently range bound at the moment between 18279 and 17556. From a longer-term perspective, however, the overall uptrend on this index is still very strong, and will remain this way in our opinion until we see a convincing push below 16051.
Daily view: Similar to the weekly timeframe, price is also seen ranging on the daily timeframe between daily supply at 18168-18010 and a daily buy zone (in green) coming in at 17863-17973.
4hr view: Yesterday’s sessions saw the DOW break above the 4hr swap level 17920, which as you can see, saw price react to a small 4hr area of supply (circled) at 17987-17966. This was not an area we had marked on the chart as it did not look significant enough. Clearly we were wrong as the market aggressively sold off from here down to test 17859. From this level, a violent push north was seen tagging in 17992.
With no clear direction coming in from the higher timeframes (see above) at the moment. The best thing we believe we can do today is watch the following levels of interest for lower timeframe confirming price action, and trade them accordingly:
Buy zones we have on our watch list are as follows:
- The 4hr swap level 17859.
- The 4hr swap level 17803.
- The 4hr Quasimodo support area at 17765 (visible deep from within the aforementioned daily buy zone).
Sell zones we have on our watch list are as follows:
- The 4hr swap level 17920.
- The 4hr swap level 17992.
- The 4hr swap level 18025 (located just within the aforementioned daily supply area).
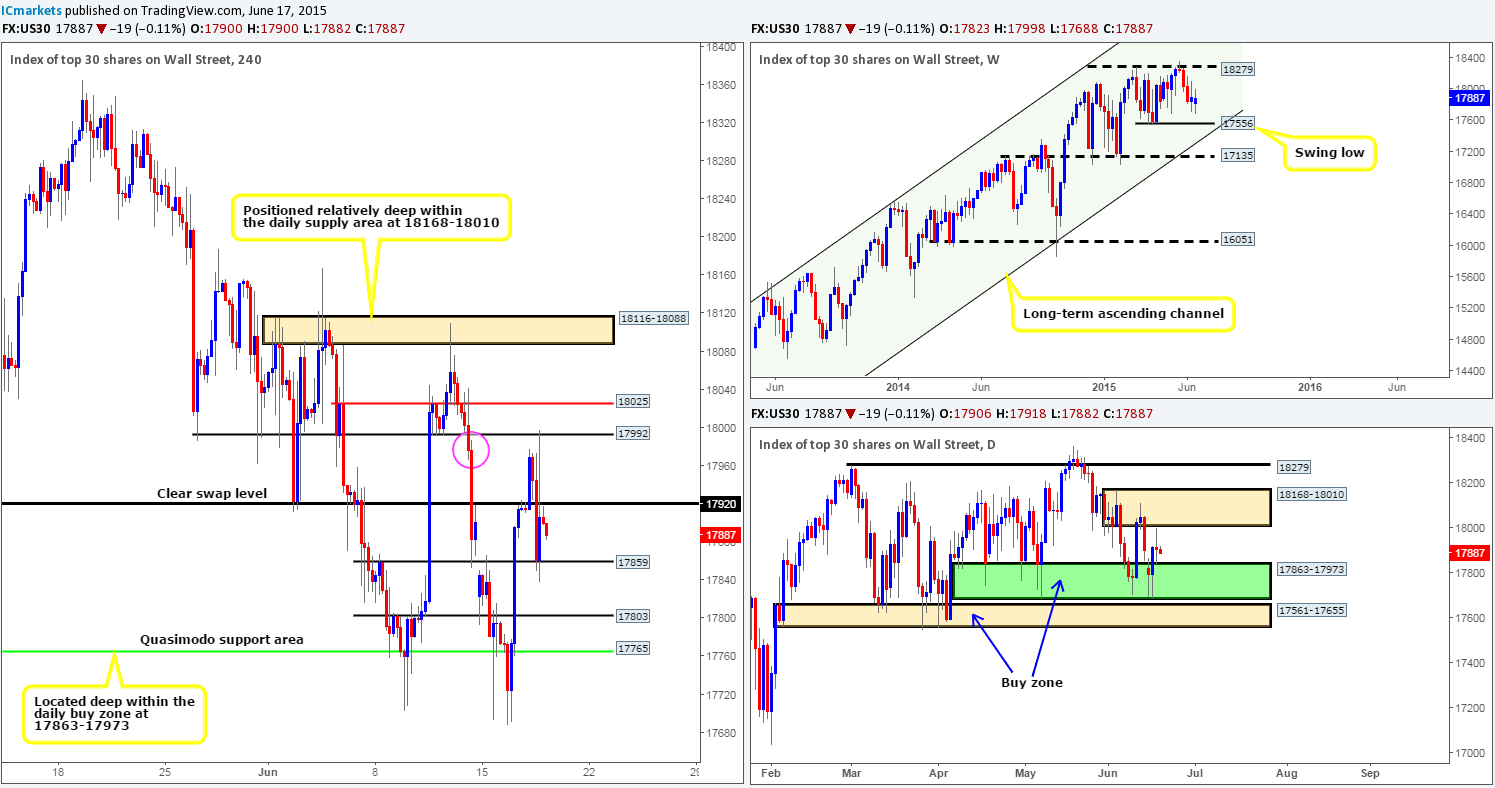
Levels to watch/ live orders:
- Buys: 17859 [Tentative – confirmation required] (Stop loss: dependent on where one confirms this level) 17803 [Tentative – confirmation required] (Stop loss: dependent on where one confirms this level) 17765 [Tentative – confirmation required] (Stop loss: 17677).
- Sells: 17920 [Tentative – confirmation required] (Stop loss: dependent on where one confirms this level) 17992 [Tentative – confirmation required] (Stop loss: dependent on where one confirms this level) 18025 [Tentative – confirmation required] (Stop loss: dependent on where one confirms this level).
XAU/USD (Gold)
Weekly view – Following last week’s rebound seen from the weekly demand area sitting at 1142.5-1167.3, the buyers have so far been able to hold this market higher. If strength continues to be shown here, we may see gold rally back up to the weekly supply area seen at 1223.1-1204.5. From a long-term perspective, however, gold is still trending south in our opinion. It will only be once/if we see a close above the weekly trendline extended from the high 1488.0 would we begin to feel that this market may be reversing.
Daily view: For the past week and a half the buyers and sellers have been seen battling for position between two compact daily areas – a daily buy zone at 1170.3-1184.0 and a small daily supply area at 1196.2-1188.9. Should we see a break below the aforementioned daily buy zone this week, the next objective to reach will likely be the daily demand area coming in at 1142.5-1154.5 (located deep within the aforementioned weekly demand area). On the other hand, if a break above the aforementioned daily supply area takes place (most likely to happen considering the position of price on the weekly timeframe – see above), the path north will likely be free up to a daily supply area seen at 1214.7-1205.5 (located within the aforementioned weekly supply area).
4hr view: From the 4hr timeframe, we can clearly see the daily timeframe’s ‘battle ground’ – a 4hr range formed from a 4hr supply at 1188.1-1185.7 and a 4hr demand zone coming in at 1175.1-1177.5. As such, trading within this 4hr consolidation is certainly something we’d consider today. However, we must emphasize that we would never trade any type of range until we saw some sort of lower timeframe confirming signal form, since, as most are already aware, consolidative environments such as this are prone to fakeouts, and there is nothing more annoying that having your stop taken out only to see price move in your originally anticipated direction!
With the above being said though, if you intend to short this range, one would need to be extra cautious here due to price currently trading from weekly demand at 1142.5-1167.3.
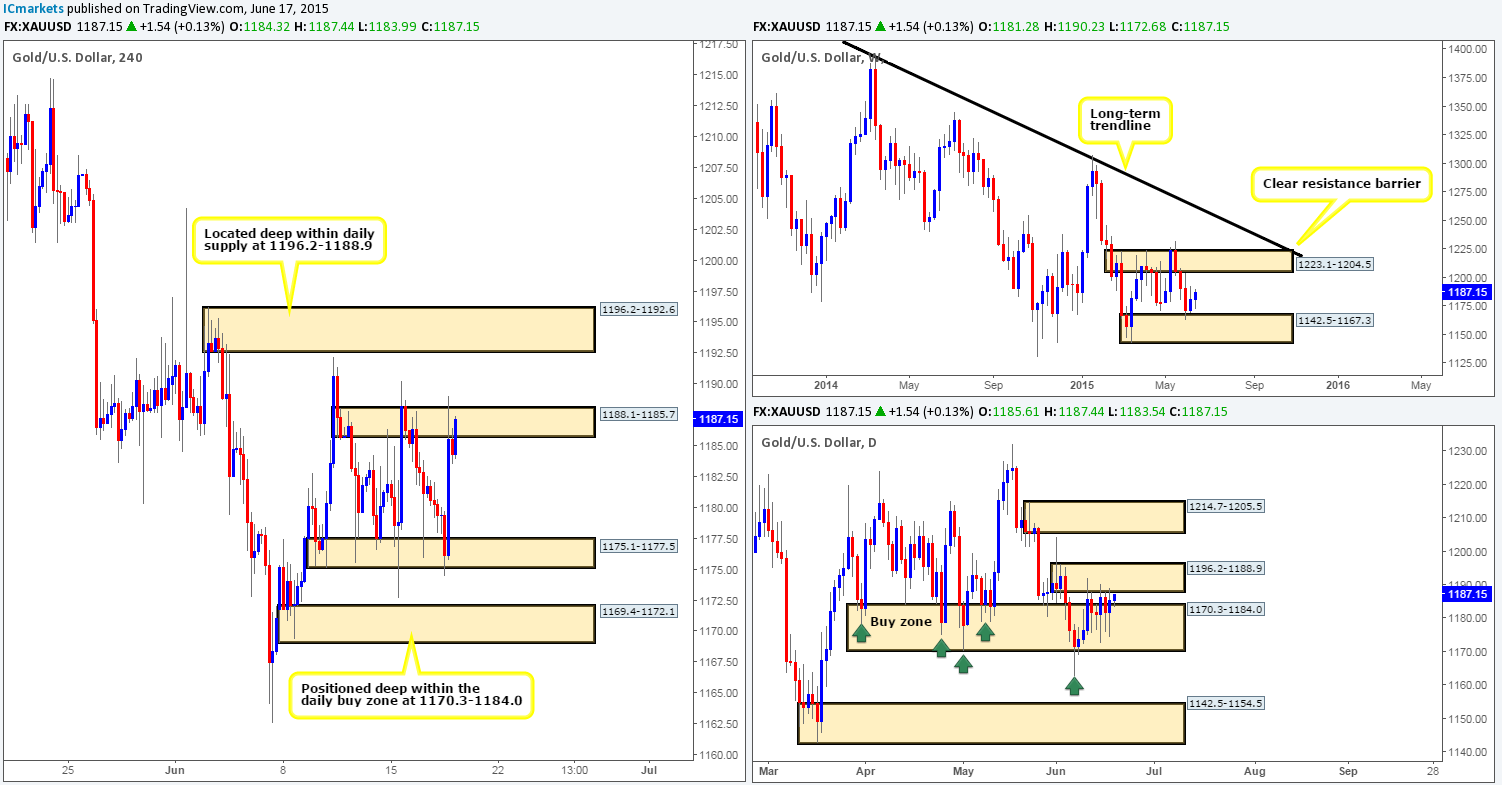
Levels to watch/ live orders:
- Buys: 1175.1-1177.5 [Tentative – confirmation required] (Stop loss: 1174.7).
- Sells: 1188.1-1185.7 [Tentative – confirmation required] (Stop loss: 1188.4).


