A note on lower timeframe confirming price action…
Waiting for lower timeframe confirmation is our main tool to confirm strength within higher timeframe zones, and has really been the key to our trading success. It takes a little time to understand the subtle nuances, however, as each trade is never the same, but once you master the rhythm so to speak, you will be saved from countless unnecessary losing trades. The following is a list of what we look for:
- A break/retest of supply or demand dependent on which way you’re trading.
- A trendline break/retest.
- Buying/selling tails/wicks – essentially we look for a cluster of very obvious spikes off of lower timeframe support and resistance levels within the higher timeframe zone.
- Candlestick patterns. We tend to only stick with pin bars and engulfing bars as these have proven to be the most effective.
We search for lower timeframe confirmation between the M15 and H1 timeframes, since most of our higher-timeframe areas begin with the H4. Stops are usually placed 5-10 pips beyond confirming structures.
EUR/USD:
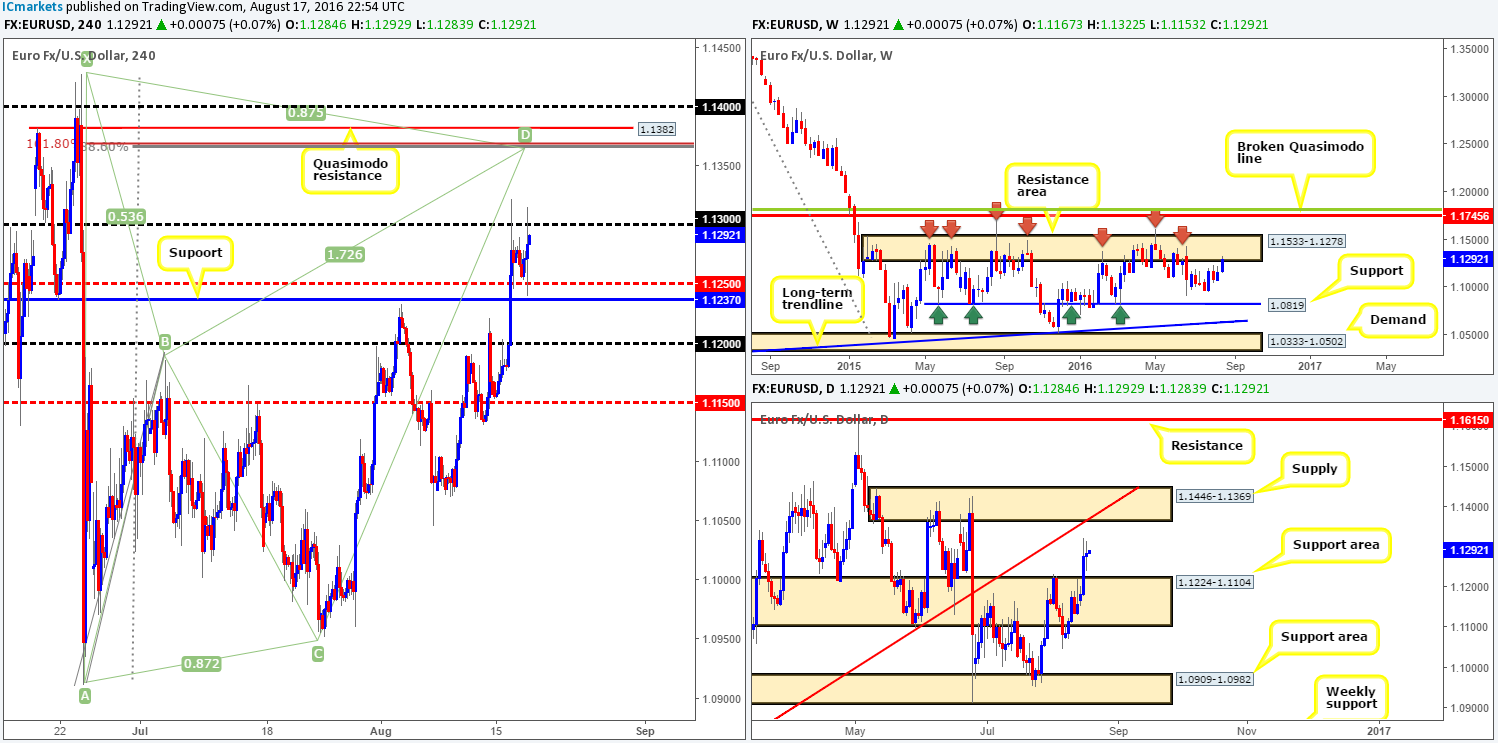
Despite the single currency reaching highs of 1.1315 yesterday, price remains locked between the 1.13 handle and the H4 mid-way support 1.1250 on the back of yesterday’s ‘mixed’ FOMC meeting. Consequent to this rather lackluster performance, much of the following report will echo similar thoughts put forward in Wednesday’s report.
With the buyers and sellers currently battling for position between 1.13/1.1250, where does our team stand regarding the higher-timeframe picture? Over on the weekly chart, price recently connected with a major area of weekly resistance coming in at 1.1533-1.1278. This zone has managed to cap upside in this market since May 2015, so the sellers could make an appearance here! Looking down to the daily chart, nevertheless, there appears to be room for the pair to extend higher towards daily supply drawn from 1.1446-1.1369, which merges with a daily trendline resistance extended from the low 1.0821.
Our suggestions: Despite weekly action now kissing the underside of a weekly resistance area, we feel the unit may want to pop higher before rotating south given the daily chart. Ultimately, we have set a pending sell order at 1.1362, with a stop above the high 1.1427 (the X point of the H4 harmonic pattern – see below). The reasons for this can be seen below:
- H4 Quasimodo resistance at 1.1382.
- Nice-looking H4 harmonic bearish Bat pattern which shows completion around the 1.1367ish range (H4 88.6% Fib resistance/H4 161.8% Fib extension).
- Psychological resistance at 1.14.
- Daily supply area at 1.1446-1.1369 which encapsulates the H4 Quasimodo sell line.
- Daily trendline resistance which fuses beautifully with the H4 Quasimodo sell line.
- And finally let’s not forget that all of the above is housed within the aforementioned weekly resistance area!
Levels to watch/live orders:
- Buys: Flat (Stop loss: N/A).
- Sells: 1.1362 [Pending order] (Stop loss: 1.1432).
GBP/USD:
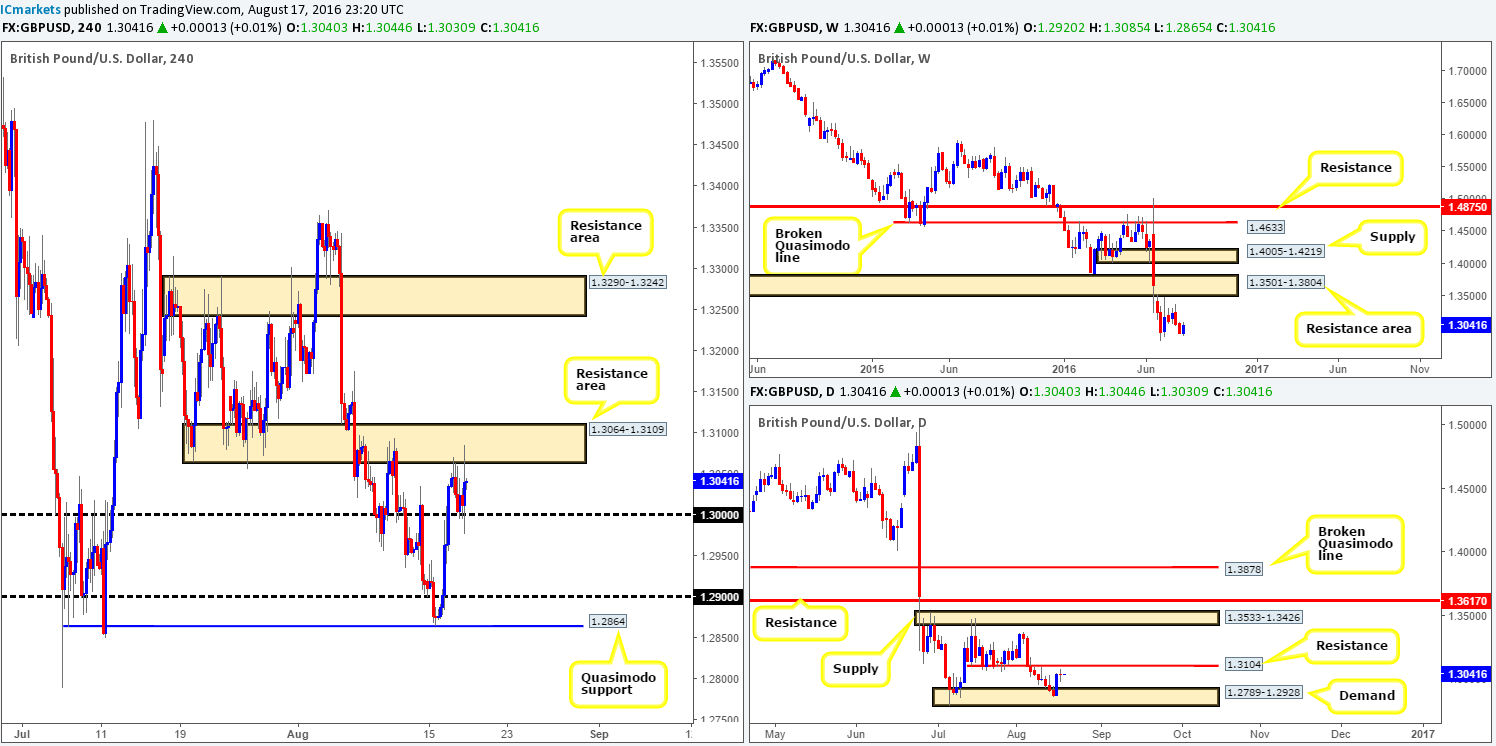
During the course of yesterday’s sessions, we can see that sterling entered into somewhat of a consolidation phase on the H4 chart between the key figure 1.30 and a H4 resistance area penciled in at 1.3064-1.3109. The market’s initial response to the latest FOMC meeting was volatile, with price briefly slipping below 1.30. However, as you can see, cable managed to recover relatively quickly with momentum then severely diminishing going into the close. From a technical standpoint, a break north of this H4 range could prompt further upside towards the H4 resistance area at 1.3290-1.3242, while a break lower may set the stage for a move down to the 1.29 handle.
Higher-timeframe technicals show price printed a daily indecision candle just ahead of a daily resistance line at 1.3104 yesterday. This pair is likely to find some resistance here with it having been a relatively strong barrier of support on a number of occasions for two weeks in July.
Our suggestions: Based on the above points, our team still remains in favor of a break lower. Therefore, the best approach today, in our opinion, will be to watch how price responds to 1.30. A break below here followed by a retest and a lower timeframe sell signal (see the top of this report) is enough to condone a short entry with an initial target objective set at 1.29.
Levels to watch/live orders:
- Buys: Flat (Stop loss: N/A).
- Sells: Watch for price to close below the 1.30 handle and look to trade any retest seen thereafter (lower timeframe confirmation required).
AUD/USD:
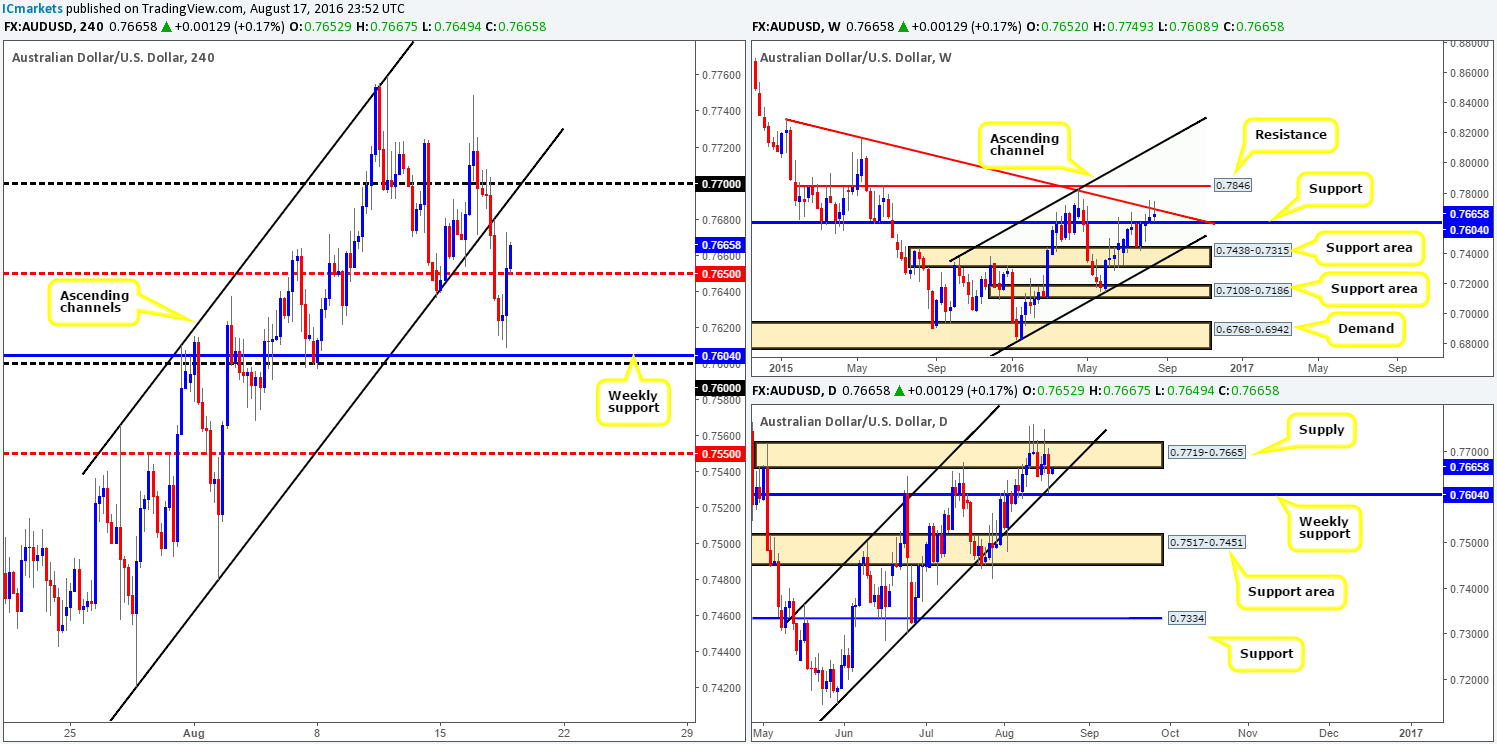
Technically speaking, the commodity-linked currency is in a particularly awkward spot right now. Over on the weekly chart, the weekly trendline resistance extended from the high 0.8895 continues to hold this market lower. However, with a long-term weekly support band seen at 0.7604 lurking just below, weekly action is restricted. By the same token, daily supply at 0.7719-0.7665 continues to hold prices lower, but given the above said weekly support positioned just below and a merging daily channel support taken from the low 0.7148, price is also somewhat capped here too. Stepping across to the H4 chart, one can clearly see that price came within shouting distance of connecting with the aforementioned weekly support yesterday, before rotating to the upside and ending the day above the H4 mid-way resistance 0.7650.
Our suggestions: Given the somewhat cramped higher-timeframe structures, one needs to be cautious trading this pair today. With this in mind, an area which is jumping off the screen at us this morning is the 0.77 handle. Not only does this number unite with the weekly trendline resistance, but it also fuses with the underside of a recently broken H4 channel support (now resistance) taken from the low 0.7420. Taking a short from here based on these points is valid in our opinion. Nevertheless, we would advise waiting for lower timeframe price action to enter (see the top of this report) to avoid the dreaded fakeout, and look to take at least 70% of the position off the table around the 0.7650ish range, leaving the rest to potentially run back down to the weekly support.
Levels to watch/live orders:
- Buys: Flat (Stop loss: N/A).
- Sells: 0.77 region [Tentative – confirmation required] (Stop loss: dependent on where one confirms this area).
USD/JPY:
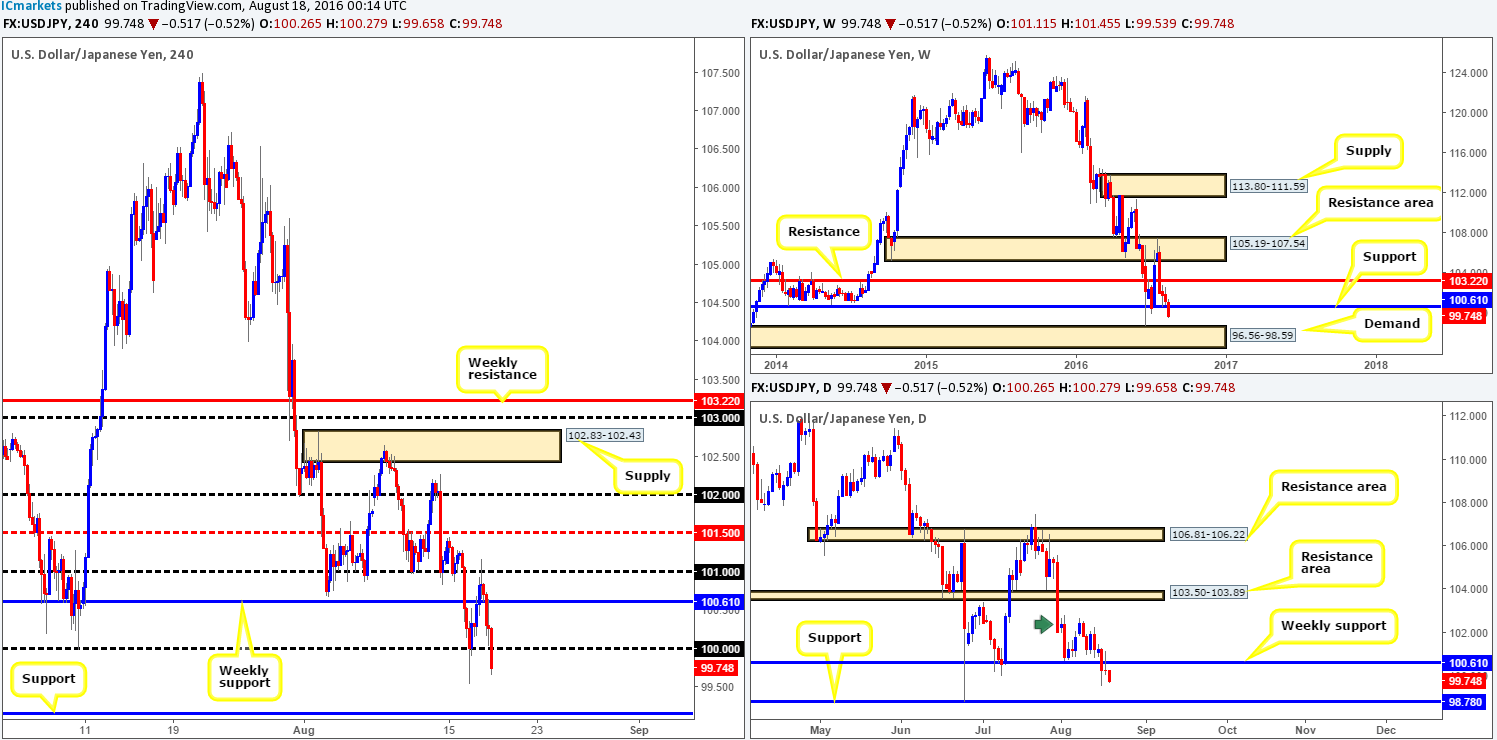
Following the release of July’s FOMC minutes, the safe-haven pair tagged in offers around the underside of weekly support at 100.61. This, as you can see, forced daily action to chalk up a picture-perfect bearish selling wick, which has, by the looks of things, attracted sellers into the market this morning. In the event that daily price continues to drive south, there’s a good chance that the pair may shake hands with daily support coming in at 98.78. We agree that the current weekly support is looking incredibly vulnerable at present, but before we jump to any conclusions, it may be worth waiting for the weekly candle to close shop before presuming that this support is consumed.
Turning our attention to the H4 chart, the key figure 100 is currently under attack. This number held firm back in early July and also more recently on the 16th August. However, given the strength shown from the sell-side of this market right now, it’s likely we’ll see a close beyond this number today which could open the gates for price to challenge 99.15: a H4 support level.
Our suggestions: Granted, the downside does look favorable at this time. Nevertheless, there’s always a chance that the push seen below weekly support is simply a deep fakeout. Given this uncertainty, opting to stand on the sidelines here today might be the best path to take.
Levels to watch/live orders:
- Buys: Flat (Stop loss: N/A).
- Sells: Flat (Stop loss: N/A).
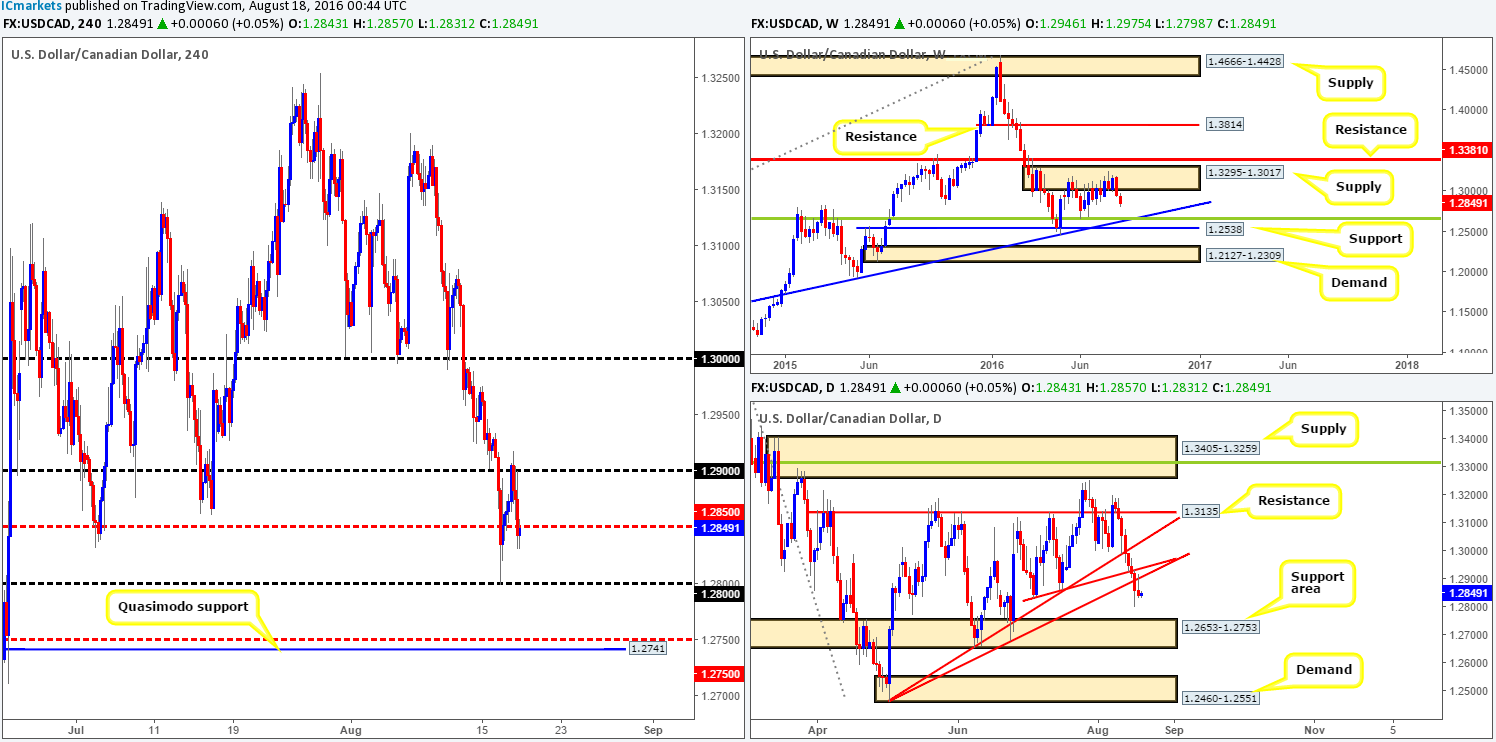
USD/CAD:
Shortly after the release of the FOMC minutes yesterday, the USD/CAD traded south from the 1.29 handle, reaching lows of 1.2830 on the day. What this also did was chalk up a beautiful-looking daily bearish selling wick off the back of a daily trendline resistance taken from the low 1.2460. This – coupled with weekly action driving lower from a weekly supply zone at 1.3295-1.3017, increases the chances of a continuation move lower today.
With the above points taken into account, a confirmed (see the top of this report) short from the underside of the H4 mid-way resistance 1.2850 may be something to consider today, targeting the 1.28 handle, followed by 1.2750/1.2741 (H4 mid-way support/H4 Quasimodo support [also represents the top edge of a daily support area at 1.2653-1.2753 – the next downside target on the daily timeframe]).
Levels to watch/live orders
- Buys: Flat (Stop loss: N/A).
- Sells: 1.2850 region [Tentative – confirmation required] (Stop loss: dependent on where one confirms this area).
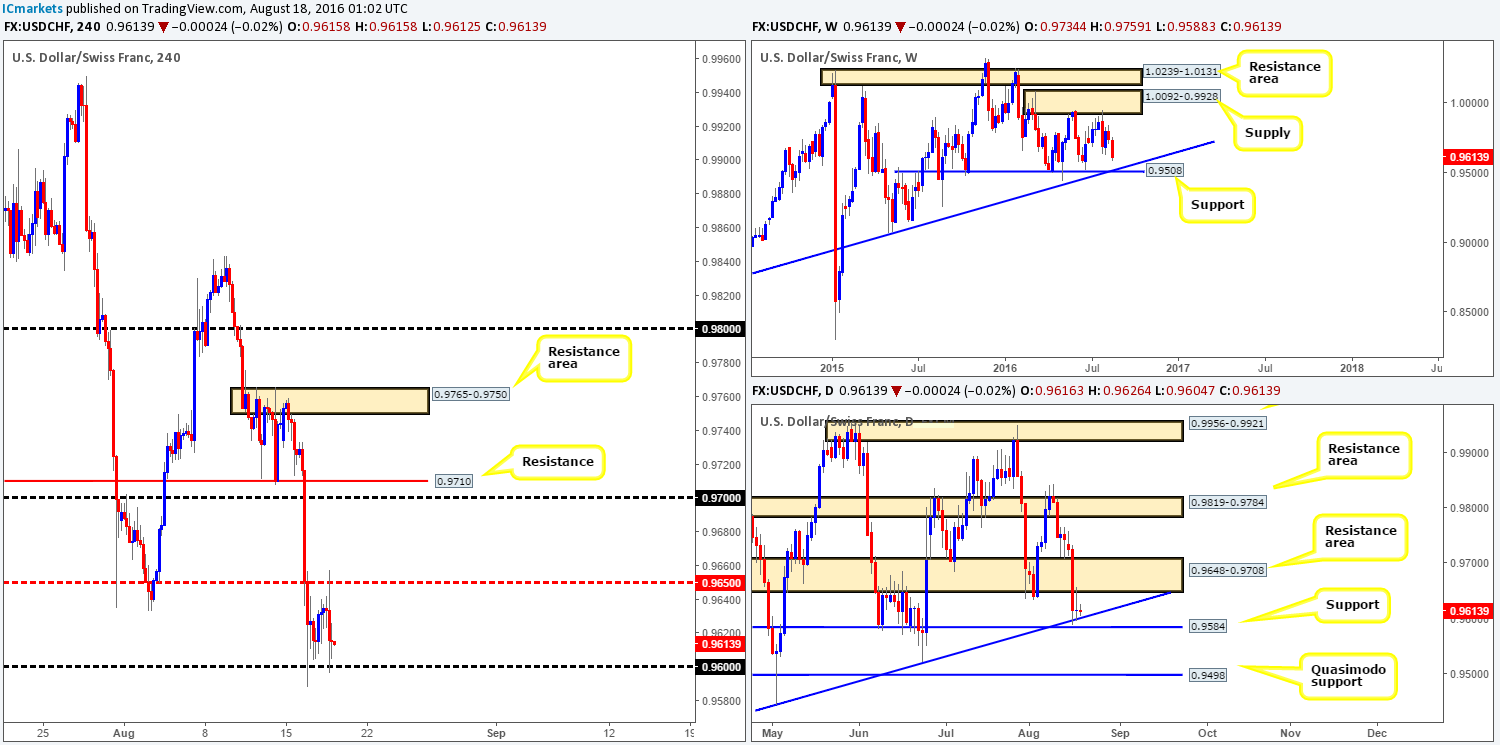
USD/CHF:
Similar to the EUR/USD (an inversely correlated pair to the Swissy), the USD/CHF also entered into a phase of minor consolidation between the H4 mid-way resistance 0.9650 and the 0.96 handle. In light of this rather lackluster performance seen yesterday, much of the following report will be similar to yesterday’s analysis.
Starting off with a look at the weekly chart this morning, price is now seen trading within touching distance of a weekly support level at 0.9508 (merges with a weekly trendline support extended from the low 0.8703). This level is certainly not one to be ignored given its history! However, before the Swissy can come to grips with above levels, daily price has to take out both the daily trendline support extended from the low 0.9443 and also the daily support line at 0.9584.
The real attraction for this pair, however, remains to be seen around the 0.95 range. Not only does this number boast a daily Quasimodo support at 0.9498 but there is also the weekly support mentioned above at 0.9508 (coupled with weekly trendline support [0.8703]).
Our suggestions: In regard to buying from 0.95, our team is confident enough to place a pending buy order here with stops set below the daily Quasimodo apex low at 0.9440. However, since we’re already looking to sell the EUR (see the top of this report), buying this pair, given that its inversely correlated, is similar to doubling up on risk, so we may pass on this one in favor of the EUR short trade.
Levels to watch/live orders:
- Buys: 0.95 [Pending order possible] (Stop loss: 0.9440).
- Sells: Flat (Stop loss: N/A).
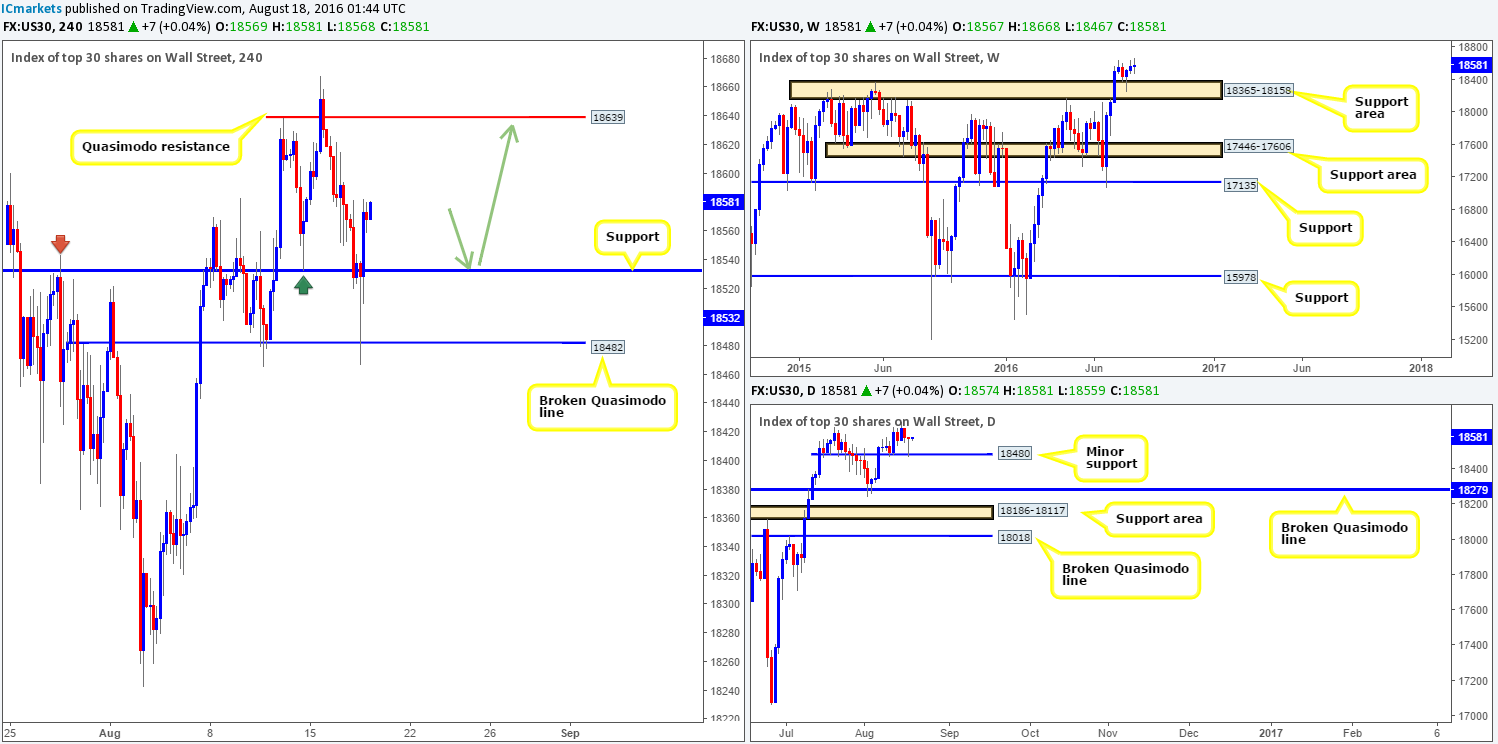
DOW 30:
In recent trading, US stocks fell sharply to test the H4 broken Quasimodo line seen at 18482, which as you can see, held firm and rotated prices back to the upside, reaching highs of 18582 on the day. The above said H4 broken Quasimodo line was a noted level of support to watch for buying opportunities in yesterday’s report, so we do hope some of our readers managed to jump aboard this move!
With price chalking up a picture-perfect weekly pin bar off a weekly support area coming in at 18365-18158 two weeks ago, and now daily action also printing a nice-looking pin bar off of the minor daily support at 18480, higher prices are likely on the cards.
Our suggestions: With the above taken into consideration, we feel that a buy from the H4 support at 18532 is a reasonable possibility. Should price retest this support and we manage to pin down a lower timeframe long entry (for entry techniques please see the top of this report) from here, we’ll initially be looking at targeting the H4 Quasimodo resistance at 18639. Following this, we’ll then be looking for price to punch to fresh highs with the aim of joining the current trend.
Levels to watch/live orders:
- Buys: 18532 [Tentative – confirmation preferred but not required] (Stop loss: 18438ish region looks best).
- Sells: Flat (Stop loss: N/A)
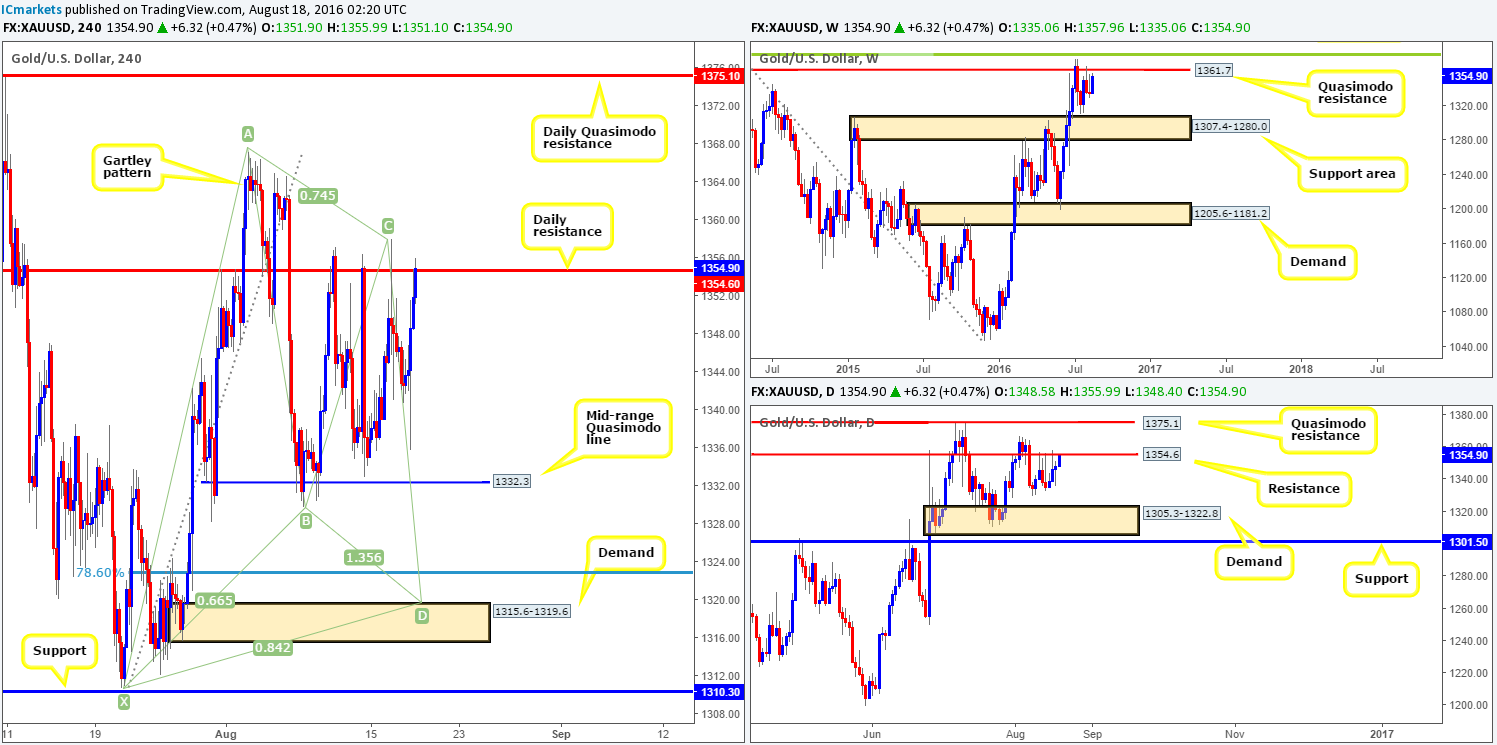
GOLD:
Gold initially spiked to lows of 1335.8 during the FOMC minutes yesterday, but managed to recover quickly. This, as can be seen from the H4 chart, eventually brought the yellow metal back up to test daily resistance coming in at 1354.6. Between this level and the weekly Quasimodo resistance line seen just above it at 1361.7 makes for one very strong barrier of resistance for the bulls to contend with!
Therefore, quite simply, we’d suggest keeping an eye on how price responds within these two higher-timeframe structures today. Should one manage to locate a lower timeframe sell signal (see the top of this report), a trade from here could, in our book, prove very profitable, given the first take-profit target is 1332.3: a H4 mid-range Quasimodo line, followed by a H4 demand at 1315.6-1319.6.
Levels to watch/live orders:
- Buys: Flat (Stop loss: N/A).
- Sells: 1361.7/1354.6 [Tentative – confirmation required] (Stop loss: dependent on where one confirms this area).


