A note on lower timeframe confirming price action…
Waiting for lower timeframe confirmation is our main tool to confirm strength within higher timeframe zones, and has really been the key to our trading success. It takes a little time to understand the subtle nuances, however, as each trade is never the same, but once you master the rhythm so to speak, you will be saved from countless unnecessary losing trades. The following is a list of what we look for:
- A break/retest of supply or demand dependent on which way you’re trading.
- A trendline break/retest.
- Buying/selling tails/wicks – essentially we look for a cluster of very obvious spikes off of lower timeframe support and resistance levels within the higher timeframe zone.
- Candlestick patterns. We tend to stick with pin bars and engulfing bars as these have proven to be the most effective.
We search for lower timeframe confirmation between the M15 and H1 timeframes, since most of our higher-timeframe areas begin with the H4. Stops are usually placed 5-10 pips beyond confirming structures.
EUR/USD:
In the early hours of yesterday’s London segment, the EUR resumed its decline against its US counterpart, eventually closing below 1.07 and testing the 1.0646-1.0689 area, a small hidden H4 demand (seen clearer on the H1). As we write, we can see that price is retesting the underside of 1.07. Should the bulls succeed in breaking through this barrier, the H4 supply at 1.0759-1.0738 would likely be the next objective to reach. Whereas, a close below the current H4 demand could spark further selling down to the 1.06 boundary.
With the above points in mind, let’s turn over to the bigger picture. Weekly price, as you can probably see, continues to maintain a bearish stance beyond the trendline support drawn from the low 0.8231, which could, should a weekly bearish close emerge, ultimately send the EUR back down to demand at 1.0333-1.0502. On top of this, the daily candles recently closed below a major support level at 1.0710. This might, given that the last time this level was visited it produced a 900-pip move, portend further downside to a Quasimodo support level coming in at 1.0557 (positioned just above the aforementioned weekly demand).
Our suggestions: According to the CME group Fed watch tool there’s a 90% chance that the FOMC will hike rates in December. This – coupled with the bearish posture reflected on the higher timeframes, our team feels lower prices may be on the cards. Unfortunately, selling into a H4 demand is not something our team would feel comfortable with. Moreover, there’s little more than 40 pips room to play with beyond the current H4 demand till we reach 1.06! Therefore, opting to stand on the sidelines here may very well be the best path to take.
Data points to consider: US Housing data, US Inflation data, Philly Fed business outlook survey, US Jobless claims and US Housing starts all at 1.30pm. FOMC member Dudley speaks at 1.50pm, Fed Chair Janet Yellen testifies at 3pm as well as FOMC member Brainard speaks at 5.30pm GMT.

Levels to watch/live orders:
- Buys: Flat (stop loss: N/A).
- Sells: Flat (stop loss: N/A).
GBP/USD:
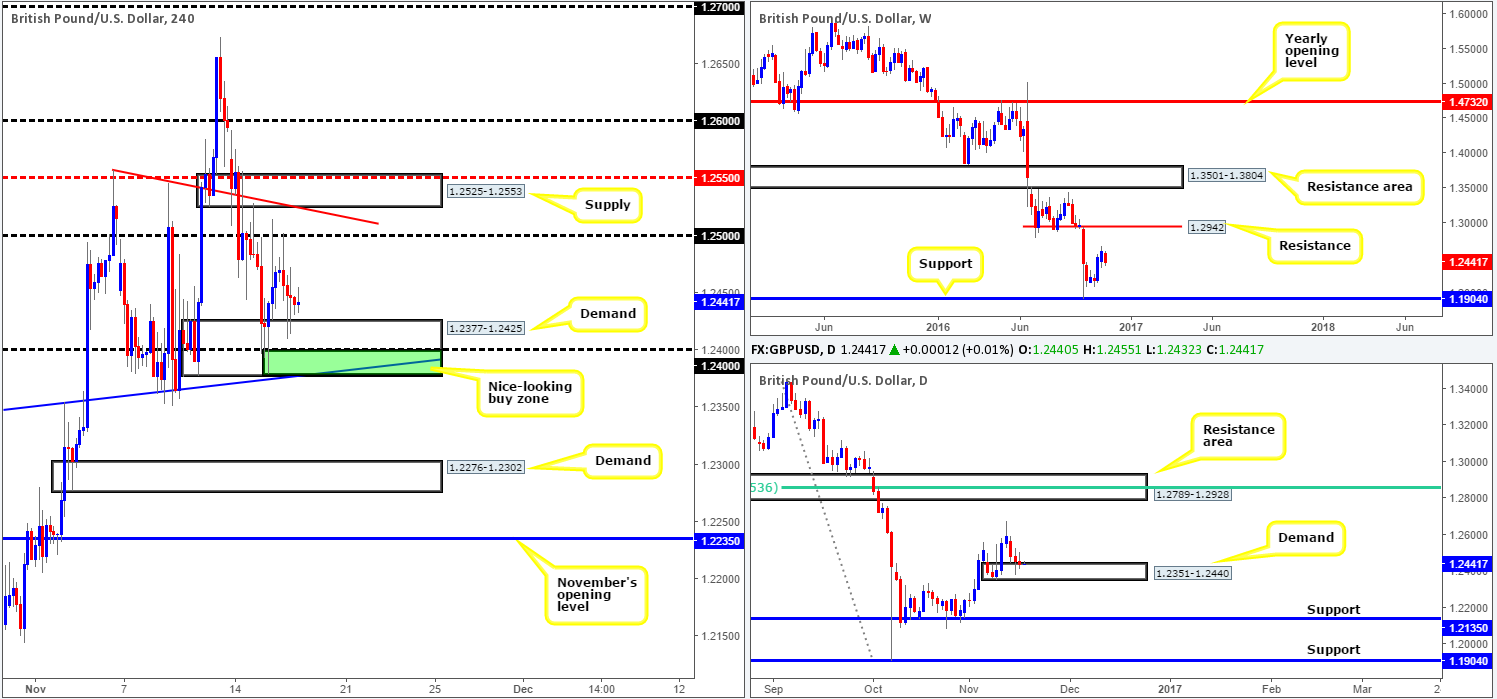
The GBP/USD, as you can see, remains locked between H4 demand at 1.2377-1.2425 and the 1.25 handle. While daily demand at 1.2351-1.2440 is still seen in the picture, the daily candles continue to close lower even after striking the zone which is typically not a good sign! Looking up to the weekly timeframe, the pair is currently trading mid-range between resistance penciled in at 1.2942 and support carved from 1.1904.
Should the daily demand give way, this would likely open the doors for a move down to daily support seen at 1.2135. Nevertheless, a break through the current H4 demand base would likely place the nearby H4 demand at 1.2276-1.2302 in the spotlight, followed closely by November’s opening level at 1.2235.
Our suggestions: Personally, our desk would not feel at all comfortable selling this market until we see a H4 bearish close form beyond the current H4 demand base. Granted, this would not entirely clear bids from the daily demand zone mentioned above, but it would give a strong indication that its likely to give way soon. Thus, a close beyond 1.2377-1.2425, along with a firm retest of this area as supply is, at least in our book, a good signal to short down the next H4 demand at 1.2276-1.2302.
In regard to buying, one could look to trade the H4 buy zone we discussed a few days back at 1.2377/1.24 (green rectangle). This zone held beautifully on the first test, and could do so again. Though, we are more than likely going to pass here given the state of the current daily demand structure.
Data points to consider: UK Retail sales at 9.30am. US Housing data, US Inflation data, Philly Fed business outlook survey, US Jobless claims and US Housing starts all at 1.30pm. FOMC member Dudley speaks at 1.50pm, Fed Chair Janet Yellen testifies at 3pm as well as FOMC member Brainard speaks at 5.30pm GMT.
Levels to watch/live orders:
- Buys: Flat (stop loss: N/A).
- Sells: Watching for a H4 bearish close beyond the H4 demand at 1.2377-1.2425 before shorts are considered.
AUD/USD:
The commodity currency came under pressure during yesterday’s Asia session, consequently taking out September’s opening level at 0.7518 and the 0.75 handle, before leveling out mid-way through the London segment at a H4 demand area drawn from 0.7462-0.7473. With upside attempts being limited for now by the 0.75 level and buyers likely weakened by the minor breach of the above said H4 demand yesterday, we feel price may go on to fake through this base today and shake hands with bids seen around the H4 Quasimodo support level penciled in at 0.7451. The Quasimodo also represents the lower edge of a daily support area coming in at 0.7517-0.7451, and is located only a few pips above the top edge of a weekly support area at 0.7438-0.7315.
Our suggestions: While 0.7451 could be a logical area for price to bounce from, one has to take into account that Australian employment data is set to hit the wire in around 30 minutes. As such, we would not advise trading this level until 30 minutes post event.
Data points to consider: Aussie employment data at 12.30am. US Housing data, US Inflation data, Philly Fed business outlook survey, US Jobless claims and US Housing starts all at 1.30pm. FOMC member Dudley speaks at 1.50pm, Fed Chair Janet Yellen testifies at 3pm as well as FOMC member Brainard speaks at 5.30pm GMT.

Levels to watch/live orders:
- Buys: 0.7451 ([trading this number at market is a possibility here but is dependent on the time of day] stop loss: 0.7440).
- Sells: Flat (stop loss: N/A).
USD/JPY:
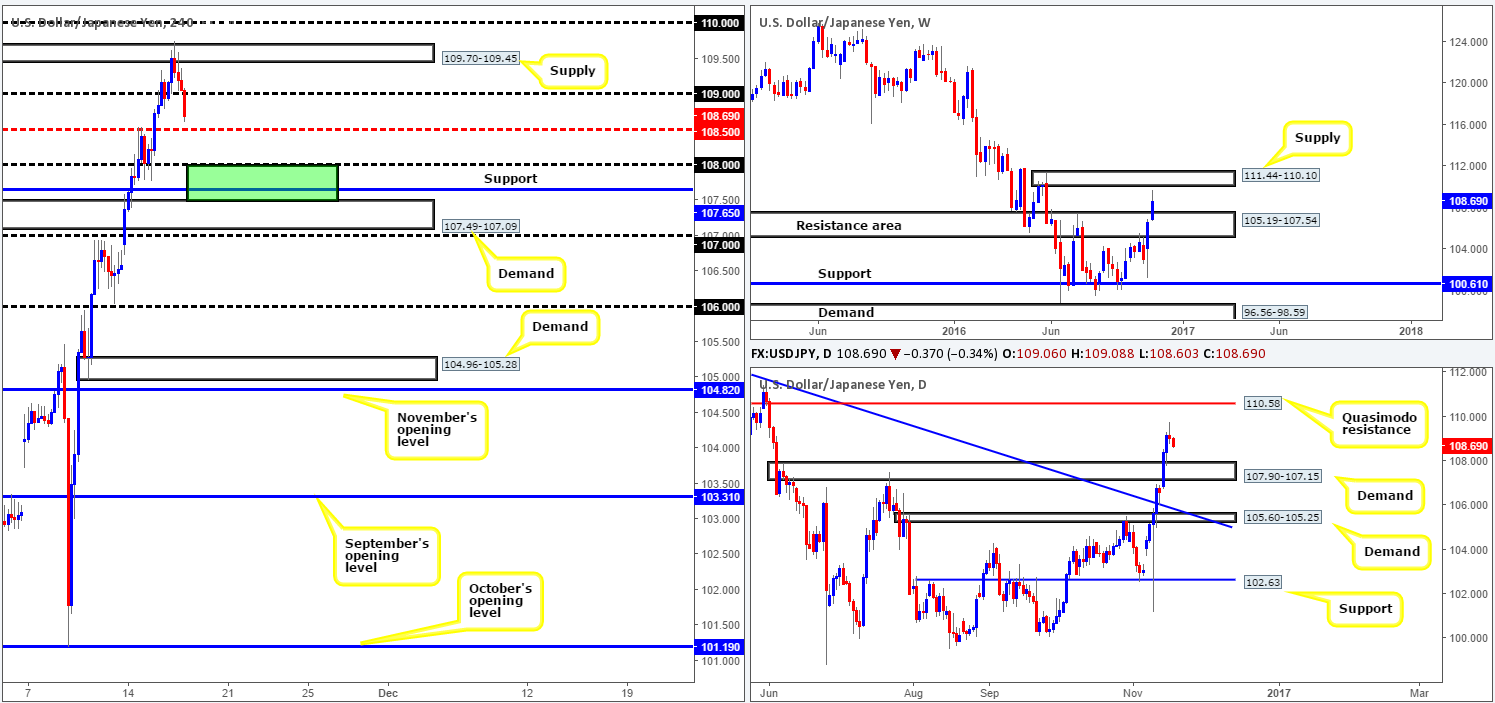
The USD/JPY, as can be seen from the H4 chart, put in a top mid-way through yesterday’s London session, following a minor breach above a minor supply base coming in at 109.70-109.45. In recent hours, however, we have seen the 109 handle challenged, feasibly opening up the possibility for a run down to either the H4 mid-way support 108.50 or the 108 handle, which sits just above daily demand at 107.90-107.15.
Despite yesterday’s bearish rotation, the weekly chart still shows room to move north up to a supply barrier coming in at 111.44-110.10. In addition to this, we can also see that the daily candles also show upside space till 110.58: a Quasimodo resistance that is housed within the walls of the above said weekly supply.
Our suggestions: The top edge of a H4 demand at 107.49, coupled with the H4 support at 107.65 and the 108 handle, is somewhere we believe the unit will struggle to breach today (green rectangle). Given that this area rests on top of the aforementioned daily demand barrier, we feel a long position could be taken from here, targeting the 108.50 hurdle as your immediate take-profit target. Approaching this H4 buy zone from an aggressive standpoint would likely see traders place a pending buy order at 108.00 and a stop below at 107.47. The conservative route, nevertheless, our more preferred method, entails waiting for lower timeframe buying confirmation prior to pulling the trigger (see the top of this report).
Data points to consider: US Housing data, US Inflation data, Philly Fed business outlook survey, US Jobless claims and US Housing starts all at 1.30pm. FOMC member Dudley speaks at 1.50pm, Fed Chair Janet Yellen testifies at 3pm as well as FOMC member Brainard speaks at 5.30pm GMT.
Levels to watch/live orders:
- Buys: 107.49/108 ([lower timeframe confirmation required prior to pulling the trigger] stop loss: depends on where one confirms this area).
- Sells: Flat (stop loss: N/A).
USD/CAD:
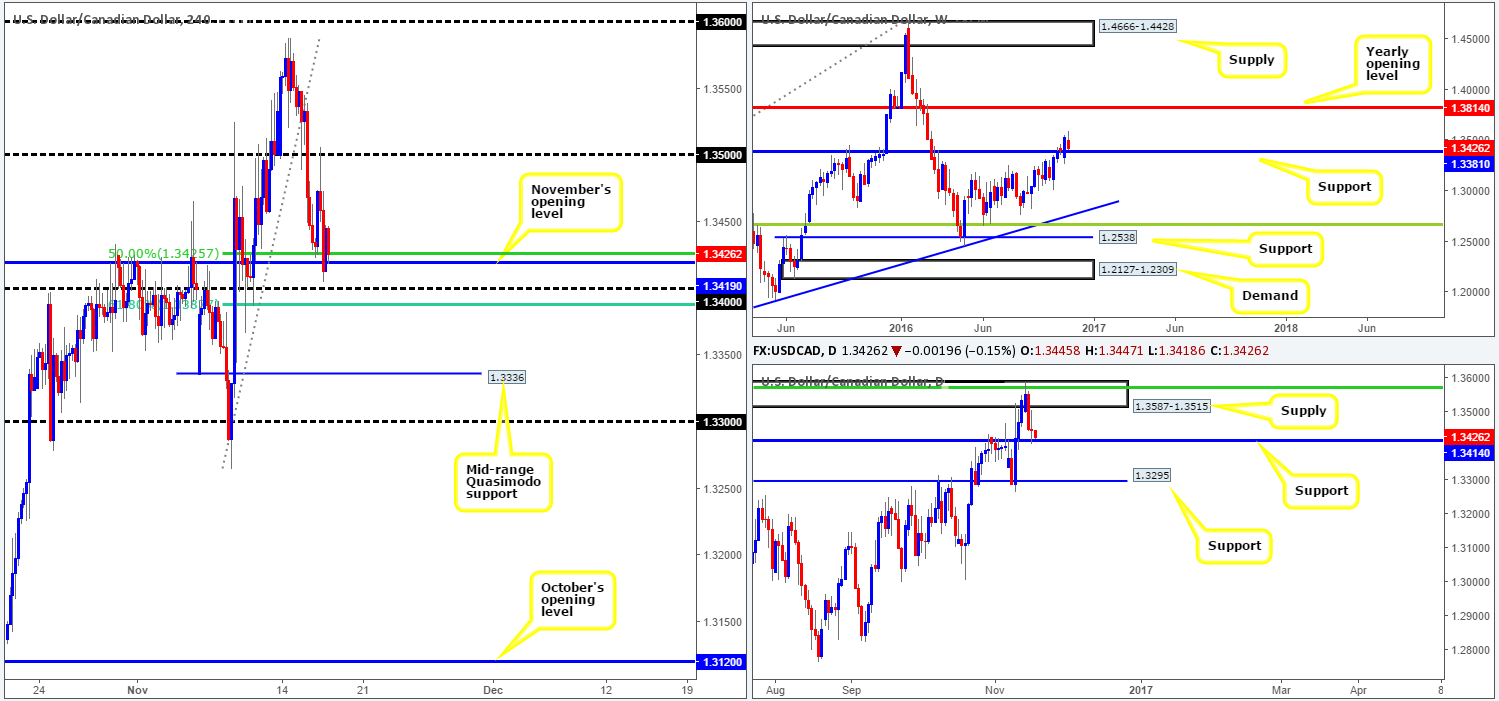
For those who read Wednesday’s report on the USD/CAD you may recollect that our desk highlighted the 1.3381/1.3425 area as a place which would likely hold the pair higher. As you can see on the H4 chart, we happened to be correct on this occasion. Be that as it may, the 1.35 handle did a superb job in rejecting further upside from this region, and ended with price closing the day pretty much unchanged. Regardless of yesterday’s movement, we still have faith in the above said H4 buy zone simply due to its connection with the higher-timeframe structures: weekly support coming in from 1.3381 and daily support at 1.3414.
Our suggestions: In view of the most recently closed H4 bull candle within the aforementioned H4 buy zone, our desk has entered long at 1.3444 with a stop set at 1.3408. We’d agree that things are not looking too bright at the moment. Our first take-profit target is the 1.35 handle.
Data points to consider: US Housing data, US Inflation data, Philly Fed business outlook survey, US Jobless claims and US Housing starts all at 1.30pm. FOMC member Dudley speaks at 1.50pm, Fed Chair Janet Yellen testifies at 3pm as well as FOMC member Brainard speaks at 5.30pm GMT.
Levels to watch/live orders:
- Buys: 1.3444 ([live] stop loss: 1.3408).
- Sells: Flat (stop loss: N/A).
USD/CHF:
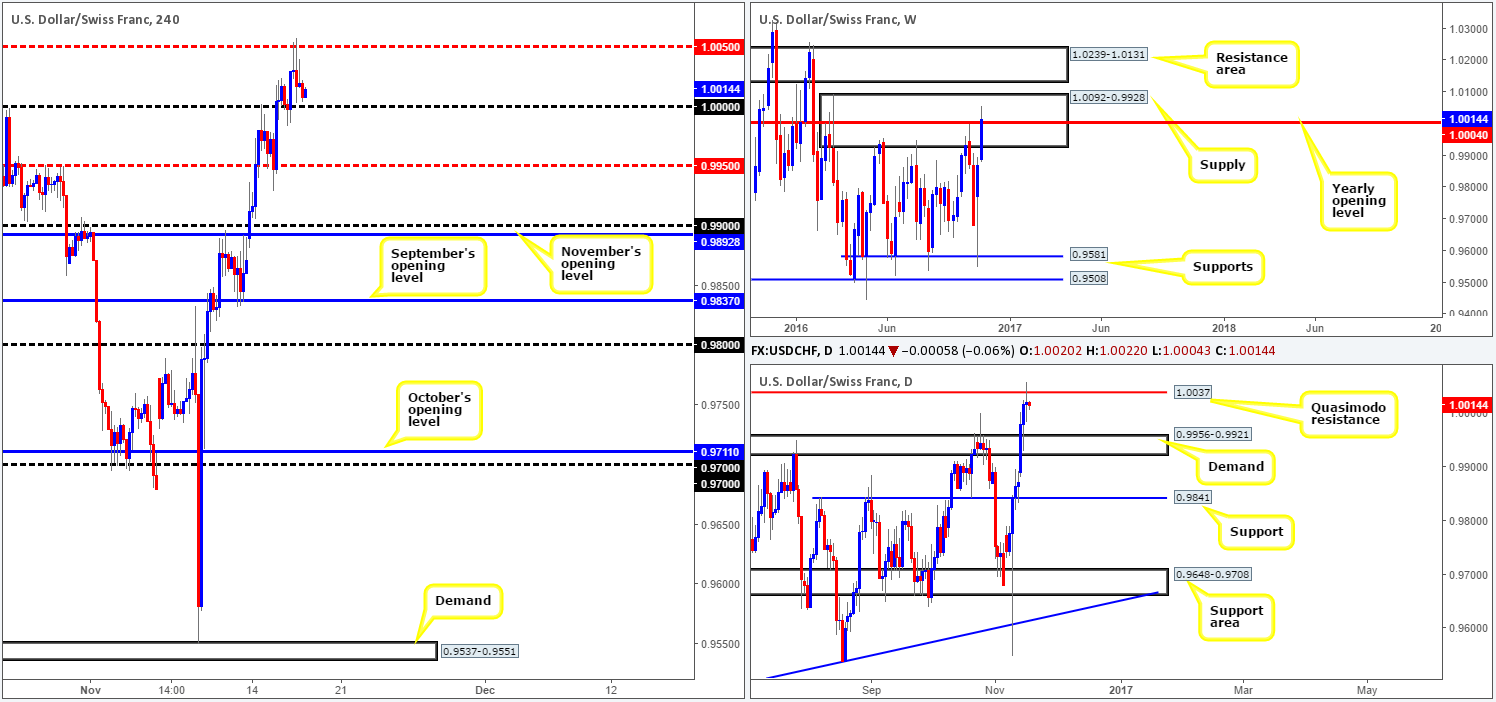
Amid yesterday’s session, the Swissy retested parity (1.0000) beautifully as support, and went on to clock highs of 1.0057 during the London morning segment. While the H4 chart emphasizes bullish strength, we have to take into consideration what the bigger picture is telling us. On the weekly chart price recently crossed swords with the yearly opening level at 1.0004, which happens to be positioned within a major supply zone drawn from 1.0092-0.9928. In conjunction with the weekly picture, the daily candles also struck a Quasimodo resistance level at 1.0037 that has so far held firm.
Regardless of the 1.0000 level holding steady yesterday, we firmly believe that this barrier is still on the verge of giving way, according to what we’re seeing on the higher timeframes. The next downside target beyond parity can be seen around the H4 mid-way support level at 0.9950, which is positioned just above a daily demand base seen at 0.9956-0.9921 (the next downside target on the daily timeframe).
Our suggestions: Our desk will be looking for a decisive H4 close to take shape beyond 1.0000. Should this come into view, we’d require a firm retest to be seen before our desk would consider placing any sells in this market.
Data points to consider: Gov. Board member Maechler speaks today at 5pm. US Housing data, US Inflation data, Philly Fed business outlook survey, US Jobless claims and US Housing starts all at 1.30pm. FOMC member Dudley speaks at 1.50pm, Fed Chair Janet Yellen testifies at 3pm as well as FOMC member Brainard speaks at 5.30pm GMT.
Levels to watch/live orders:
- Buys: Flat (stop loss: N/A).
- Sells: Watch for a close below 1.0000 and then look to trade any retest seen thereafter (stop loss: ideally beyond the candle that retests 1.0000 as resistance).
DOW 30:
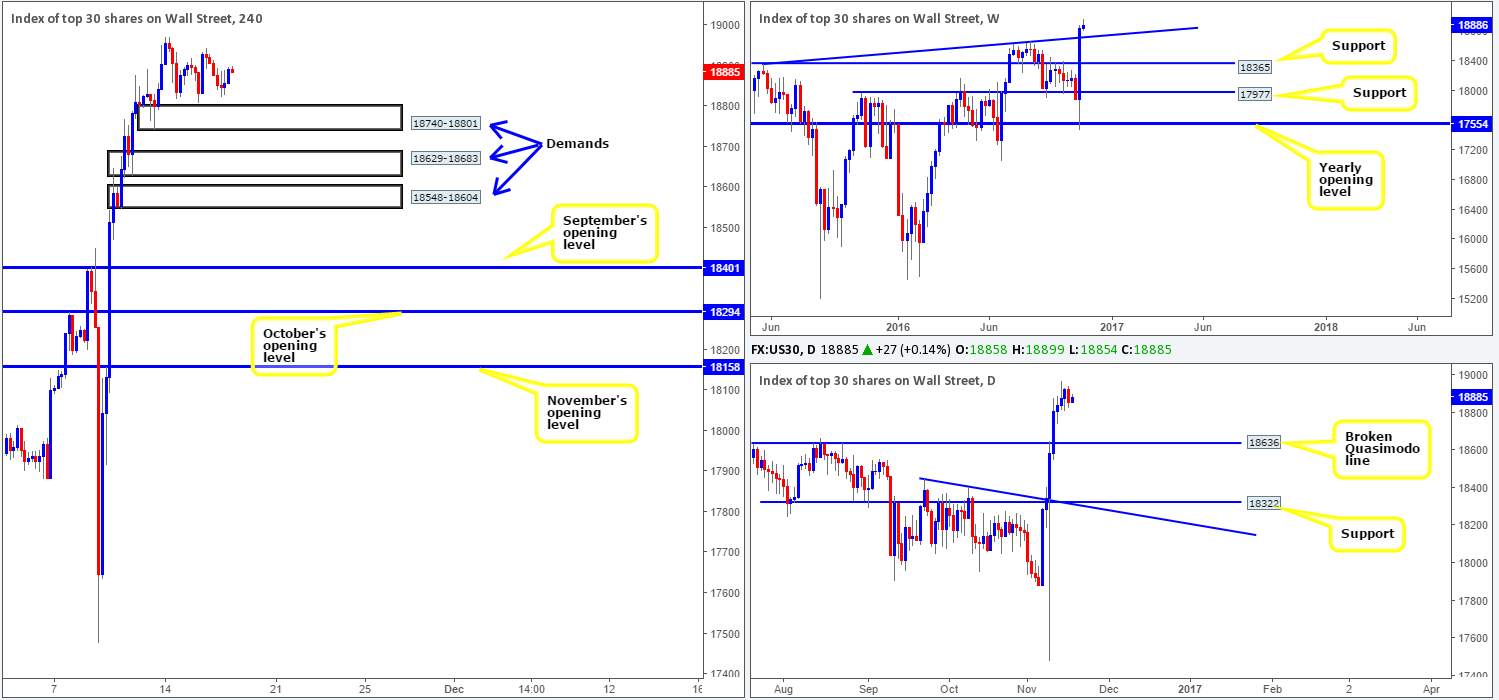
In recent days, we’ve seen equities withdraw into a phase of consolidation ahead of a H4 demand base coming in at 18740-18801. It appears the market is taking a breather, following Trump’s presidential win over Clinton. From a technical standpoint, nevertheless, our outlook remains unchanged as our desk continues to keep a close eye on the three following areas of demand. The first, the lowest of the three, comes in at 18548-18604: a H4 demand which was formed following the break of the daily Quasimodo resistance level at 18636 (the next downside target on the daily timeframe). The second, the middle of the three is seen at 18629-18683: a H4 demand base that intersects beautifully with the weekly trendline support extended from the high 18365 (the next downside target on the weekly timeframe). The third area drawn from 18740-18801, which is also a H4 demand barrier unfortunately has little higher-timeframe significance so is, in our book, liable to be faked should price test this area.
Our suggestions: Given Yellen’s testimony later on today, we may see more volatile movement in this market. In view of the higher-timeframe picture displaying room to continue advancing north, however, the two lower H4 demands are stable enough zones to consider entering at market given their connection with the higher timeframes. The upper area, whilst it has no connection to the bigger picture, could still react. Still, we’d advise waiting for at least a H4 bullish close to form prior to pulling the trigger here to avoid the possibility of getting caught on any fakeout.
Data points to consider: US Housing data, US Inflation data, Philly Fed business outlook survey, US Jobless claims and US Housing starts all at 1.30pm. FOMC member Dudley speaks at 1.50pm, Fed Chair Janet Yellen testifies at 3pm as well as FOMC member Brainard speaks at 5.30pm GMT.
Levels to watch/live orders:
- Buys: 18740-18801 ([reasonably sized H4 bullish close required prior to pulling the trigger] stop loss: ideally beyond the trigger candle). 18629-18683 ([a possible area to consider entering at market from] stop loss: 18618). 18548-18604 ([a possible area to consider entering at market from] stop loss: 18537).
- Sells: Flat (stop loss: N/A).
GOLD:
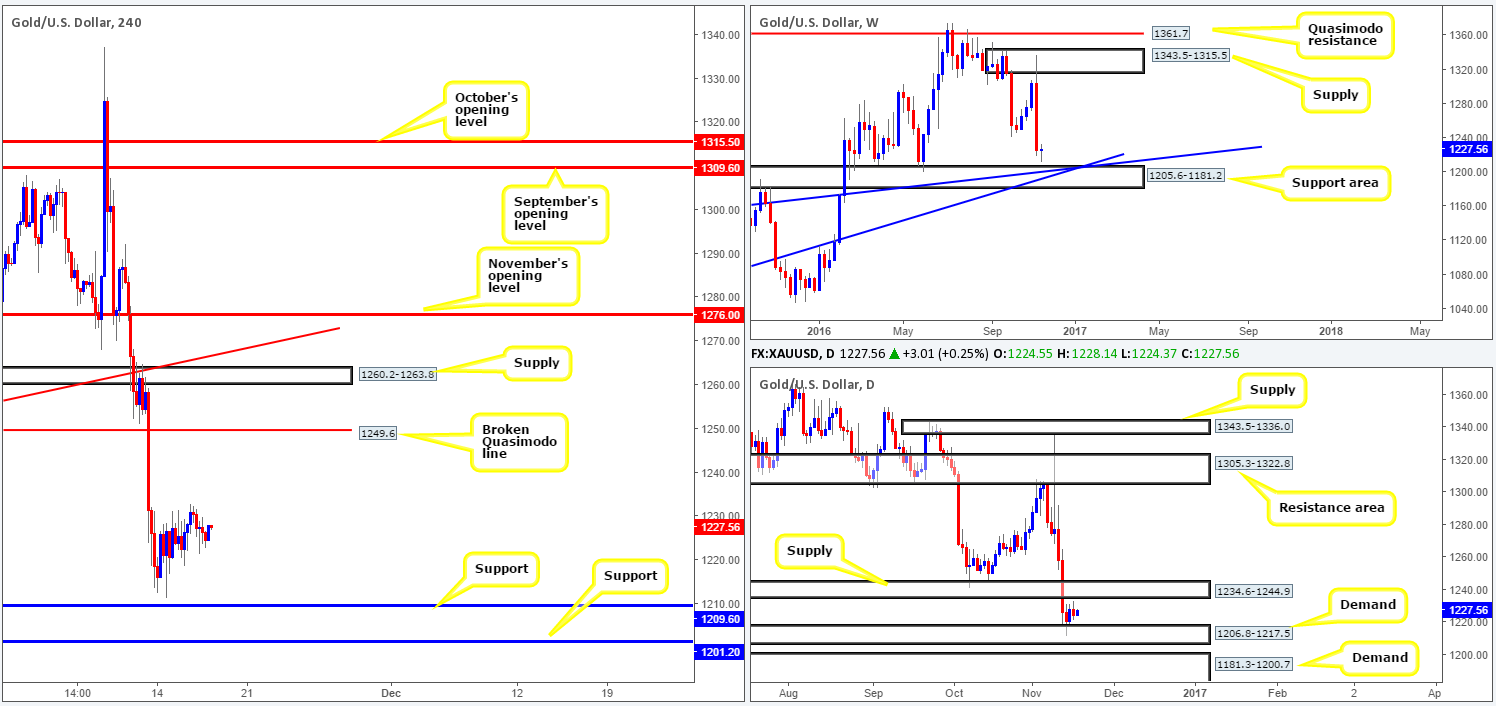
Although the yellow metal recently caught a bid from daily demand at 1206.8-1217.5, upside gains have been fairly limited so far. While the daily area is positioned directly above a weekly support area at 1205.6-1181.2, there’s a daily supply loitering just ahead of current price at 1234.6-1244.9 that could prove to be problematic for buyers.
Our suggestions: Bullion is certainly in a tricky spot right now. A break above the current daily supply would, of course, be considered bullish. However, looking to trade long from that point would be challenging in view of the H4 broken Quasimodo line lurking just above at 1249.6!
In the event that the current daily demand is taken out, selling would be a mistake, in our opinion. The reason being is you’d be selling directly into a nearby daily demand at 1181.3-1200.7, as well as the weekly support area mentioned above at 1205.6-1181.2 that converges with two trendline supports (1130.1/1071.2).
With the above points taken into account, here is what we have jotted down so far:
- Look to trade long from the H4 support at 1209.6. This hurdle is placed perfectly within the lower limits of the current daily demand, and could potentially bounce price.
- The H4 support level seen lower on the curve at 1201.2 is also another interesting barrier. It sits nicely within the top edge of the above said weekly support area and is located just above the daily demand at 1181.3-1200.7 (hence a fakeout could be seen here so be careful).
Levels to watch/live orders:
- Buys: 1209.6 region ([wait for a reasonably sized H4 bullish close to form prior to pulling the trigger] stop loss: ideally beyond the trigger candle). 1201.2 ([wait for a reasonably sized H4 bullish close to form prior to pulling the trigger] stop loss: ideally beyond the trigger candle).
- Sells: Flat (stop loss: N/A).


