EUR/USD:
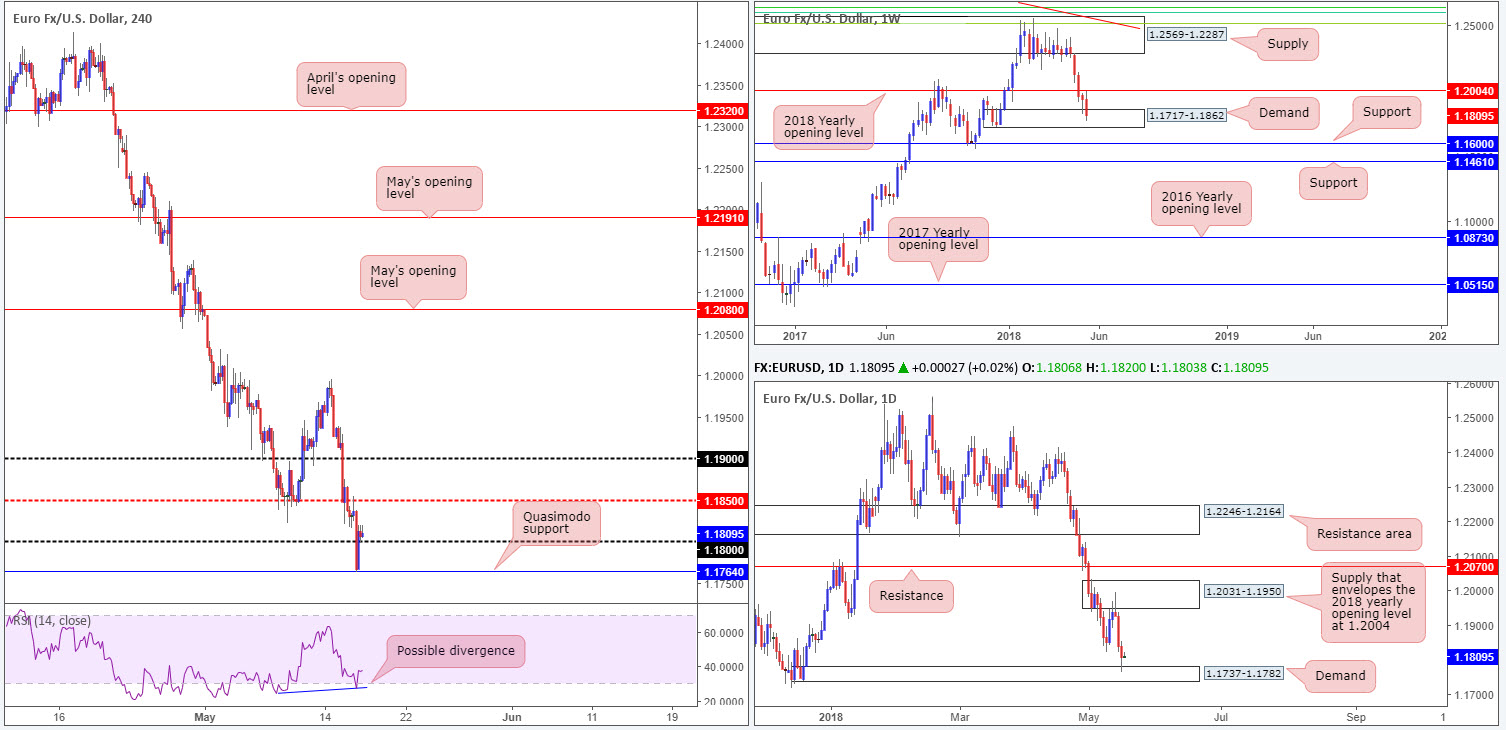
Following a compact retest off the underside of a H4 mid-level resistance at 1.1850 (in the shape of a H4 bearish pin-bar formation) amid London hours on Wednesday, the euro plunged lower. Hit by weak core inflation (Apr), events in Rome and a tenacious USD, the pair surpassed the 1.18 handle and connected with a H4 Quasimodo support located at 1.1764 (taken from mid-Dec 2017). However, a late and broad round of greenback selling/profit taking provided the single currency a footing, which saw the unit reclaim the big figure by the day’s end.
While the bulls are establishing some ground above 1.19 on the H4 scale, the story over on the bigger picture is also interesting. Weekly price is seen shaking hands with a firm demand base coming in at 1.1717-1.1862, after the buyers were unable to bring things above the 2018 yearly opening level sited at 1.2004. In conjunction with weekly flow, daily action is currently seen fading a demand area drawn from 1.1737-1.1782, which, as you can probably see, is located within the lower limit of the said weekly demand.
Potential trading zones:
Owing to weekly and daily structure, buying this market on a reasonable retest of 1.18 as support could be an option today, targeting 1.1850 as an initial target area. To ensure realistic risk/reward, however, we would strongly recommend drilling down to the lower timeframes and shooting for an entry there. A full or near-full-bodied M15 candle printed off of 1.18, for example, would be enough to justify a buy and hopefully offer reduced risk (stop-loss order best placed beyond the confirmation candle’s tail).
Data points to consider today: US Philly Fed manufacturing index; US unemployment claims.
GBP/USD
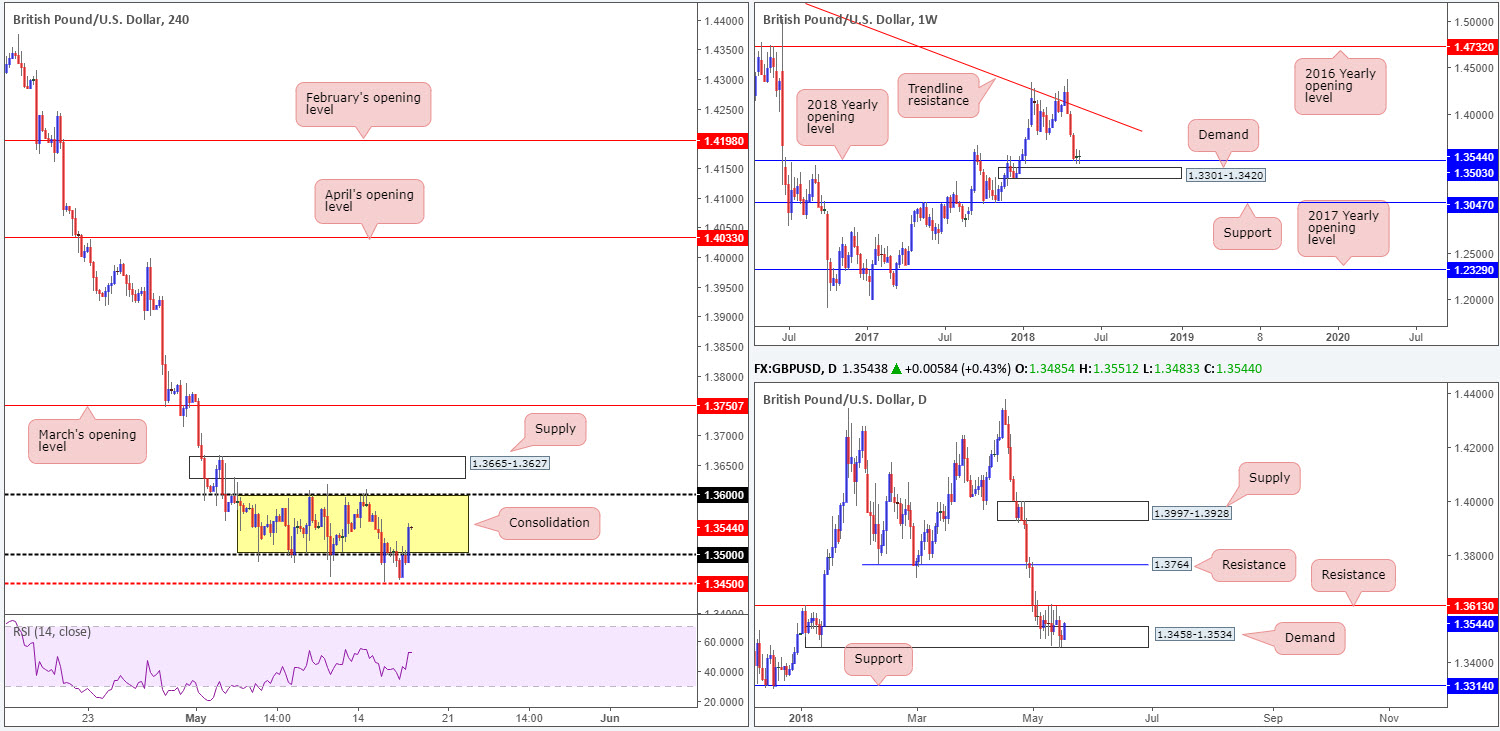
In recent trading, cable lost grip of 1.35 (the lower edge of the current H4 range between 1.35/1.36) before finding some underlying support just north of a H4 mid-level support at 1.3450. Following this, sterling caught fresh bids on the back of an announcement from the UK that British Parliament would be willing to remain within the EU customs union beyond 2021 in an effort to veer away from a hard Brexit scenario.
As you can see, recent buying has placed the H4 candles back within the confines of its H4 range in reasonably strong fashion. Supporting the current range, as highlighted in previous reports, is daily structure: demand planted at 1.3458-1.3534 and resistance fixed at 1.3613. The situation up on the weekly timeframe, nevertheless, is slightly less complicated. The 2018 yearly opening level at 1.3503, as is evident from the chart, remains a supportive barrier in this market despite last week’s period of indecision. Should the line give way, though, nearby weekly demand at 1.3301-1.3420 will likely save the bulls from too much damage!
Potential trading zones:
Further buying could eventually materialize off the 2018 yearly opening barrier at 1.3503, which not only represents the lower edge of the current H4 range, it is also placed within daily demand at 1.3458-1.3534. Therefore, looking for a retest play to form off of 1.35 today could be something to consider. A full or near-full-bodied H4 bull candle printed off of 1.35 would, given the surrounding structure, be enough to justify a long, targeting the opposite end of the current H4 range at 1.36, shadowed closely by daily resistance mentioned above at 1.3613.
Data points to consider today: MPC member Haldane speaks; US Philly Fed manufacturing index; US unemployment claims.
AUD/USD:
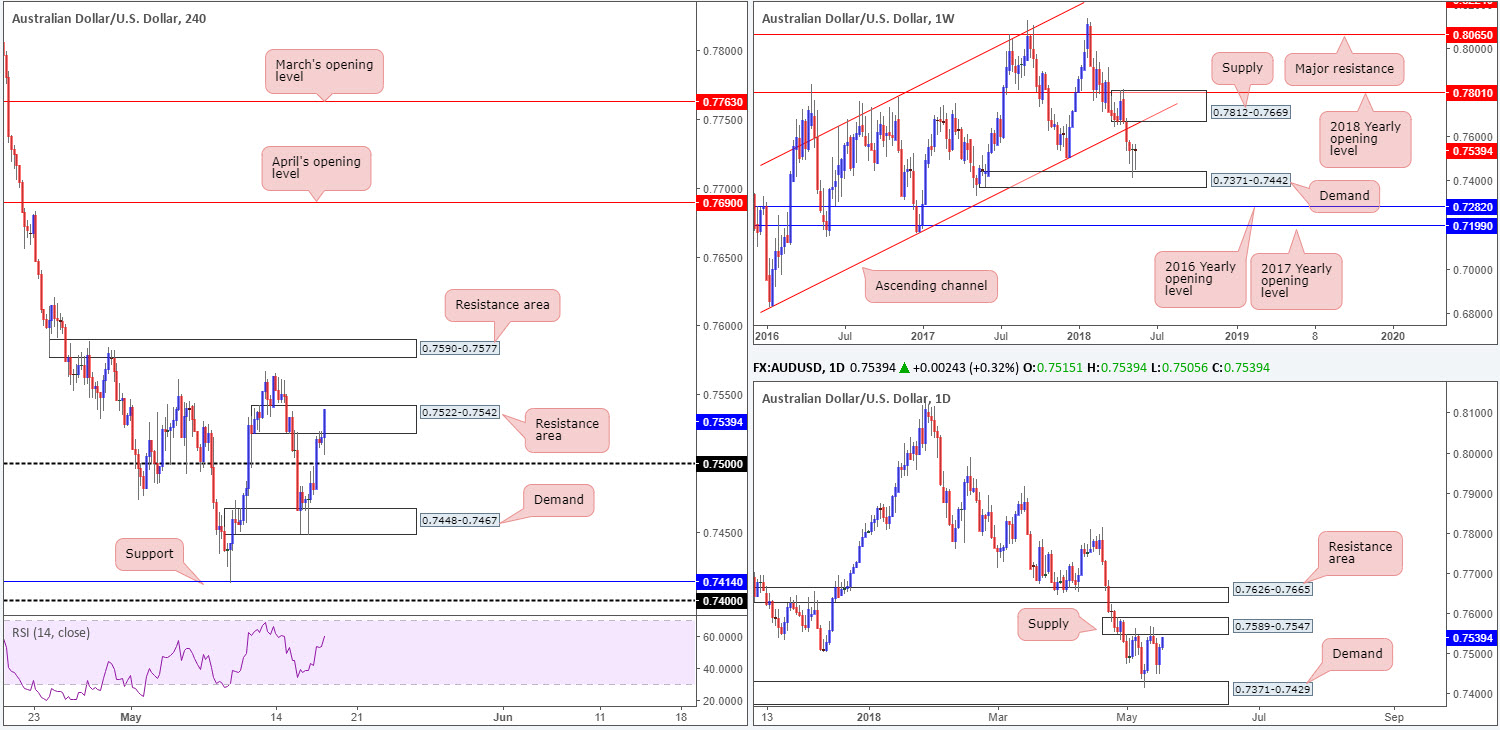
The Australian dollar was among the best performers amid Wednesday’s movement, influenced by an upbeat tone surrounding both the equity and metals markets. The AUD/USD, as you can see, recovered within the walls of a H4 demand area coming in at 0.7448-0.7467 after a less-than-stellar Aussie wage growth reading.
In recent trade, however, Aussie employment data hit the wires. Australian unemployment marginally ticked higher to 5.6% vs. expected 5.5%, while employment change beat expectations, clocking in at +22.6k jobs added over the past month, compared to the expected 20k. Overall this has provided a floor for buyers to gravitate higher into the walls of a H4 resistance area seen at 0.7522-0.7542. While a break above this area is likely, let’s bear in mind that directly above this zone is a PROVEN daily supply zone at 0.7589-0.7547. On the plus side of things, nevertheless, weekly price shows room to extend as far north as supply at 0.7812-0.7669, which happens to intersect with a weekly channel support-turned resistance taken from the low 0.6827.
Potential trading zones:
Entering long based on where weekly price is currently situated would not be a high-probability move, in our humble view. As to why should be obvious: you would effectively trade directly into potential selling pressure from the aforementioned daily supply.
The same is unfortunately true for a short in this market. While selling from the underside of the daily supply may appear attractive considering the immediate trend, would you really like to try and tackle possible buying on the weekly timeframe?!
Based on the above information, neither a long nor short position seems attractive at this time.
Data points to consider today: US Philly Fed manufacturing index; US unemployment claims.
This site has been designed for informational and educational purposes only and does not constitute an offer to sell nor a solicitation of an offer to buy any products which may be referenced upon the site. The services and information provided through this site are for personal, non-commercial, educational use and display. IC Markets does not provide personal trading advice through this site and does not represent that the products or services discussed are suitable for any trader. Traders are advised not to rely on any information contained in the site in the process of making a fully informed decision.
This site may include market analysis. All ideas, opinions, and/or forecasts, expressed or implied herein, information, charts or examples contained in the lessons, are for informational and educational purposes only and should not be construed as a recommendation to invest, trade, and/or speculate in the markets. Any trades, and/or speculations made in light of the ideas, opinions, and/or forecasts, expressed or implied herein, are committed at your own risk, financial or otherwise.
The use of the site is agreement that the site is for informational and educational purposes only and does not constitute advice in any form in the furtherance of any trade or trading decisions.
The accuracy, completeness and timeliness of the information contained on this site cannot be guaranteed. IC Markets does not warranty, guarantee or make any representations, or assume any liability with regard to financial results based on the use of the information in the site.
News, views, opinions, recommendations and other information obtained from sources outside of www.icmarkets.com.au, used in this site are believed to be reliable, but we cannot guarantee their accuracy or completeness. All such information is subject to change at any time without notice. IC Markets assumes no responsibility for the content of any linked site. The fact that such links may exist does not indicate approval or endorsement of any material contained on any linked site.
IC Markets is not liable for any harm caused by the transmission, through accessing the services or information on this site, of a computer virus, or other computer code or programming device that might be used to access, delete, damage, disable, disrupt or otherwise impede in any manner, the operation of the site or of any user’s software, hardware, data or property.


