Waiting for lower timeframe confirmation is our main tool to confirm strength within higher timeframe zones, and has really been the key to our trading success. It takes a little time to understand the subtle nuances, however, as each trade is never the same, but once you master the rhythm so to speak, you will be saved from countless unnecessary losing trades. The following is a list of what we look for:
- A break/retest of supply or demand dependent on which way you’re trading.
- A trendline break/retest.
- Buying/selling tails/wicks – essentially we look for a cluster of very obvious spikes off of lower timeframe support and resistance levels within the higher timeframe zone.
We typically search for lower-timeframe confirmation between the M15 and H1 timeframes, since most of our higher-timeframe areas begin with the H4. Stops are usually placed 1-3 pips beyond confirming structures.
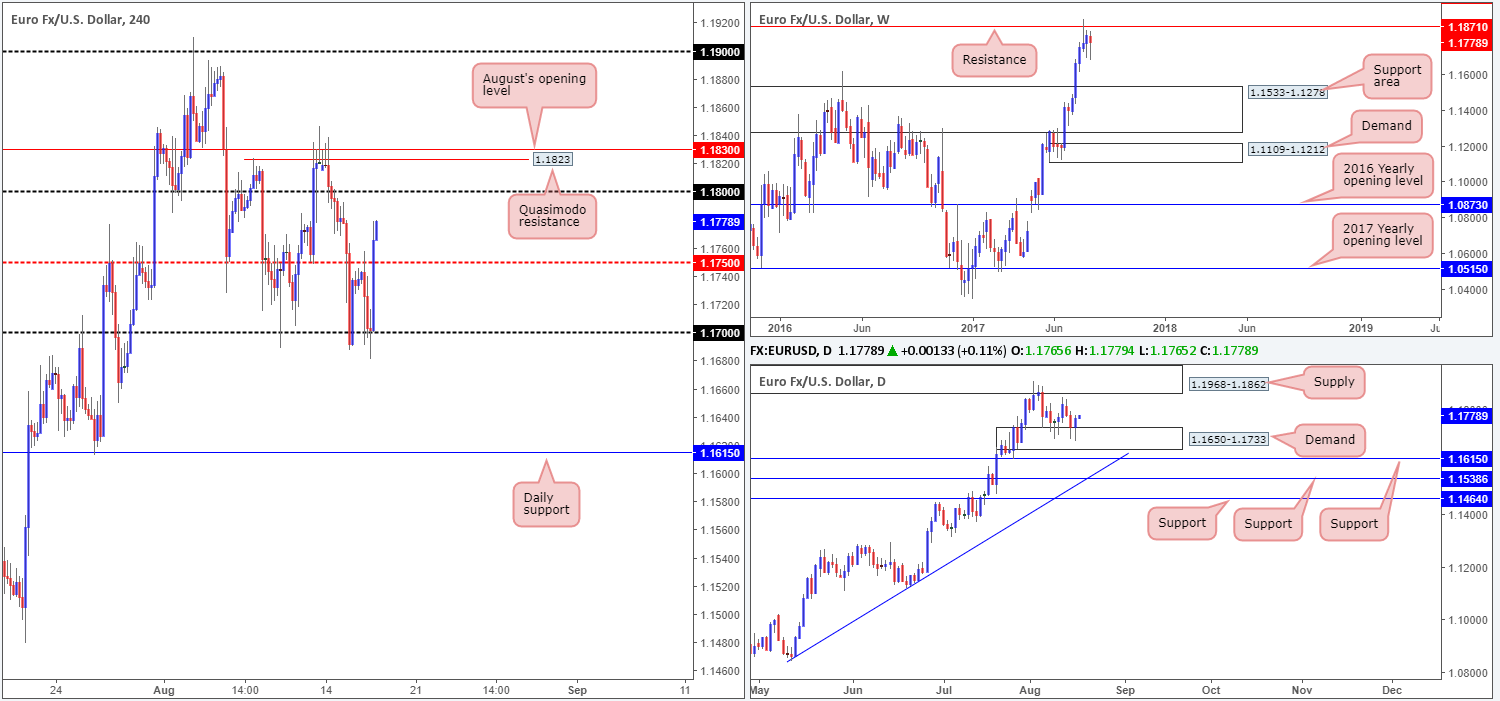
EUR/USD:
Following a minor breach of the 1.17 threshold during yesterday’s NY segment, the single currency aggressively advanced higher. Influenced by the latest FOMC meeting minutes, the major ended the day closing above the H4 mid-level resistance at 1.1750. This – coupled with back-to-back buying tails seen printed from within a daily demand at 1.1650-1.1733, suggests further upside may be possible.
On the H4 timeframe, the 1.18 handle, followed closely by a Quasimodo resistance at 1.1823 and August’s opening level at 1.1830, are the next notable areas of resistance to keep an eyeball on. Over on the daily timeframe, the next upside target can be seen at a supply drawn from 1.1968-1.1862. The weekly timeframe on the other hand, exhibits seller weakness at the moment. Since connecting with resistance at 1.1871 two weeks ago, there has been little bearish intent registered from here..
Suggestions: Near-term, entering long in this market is challenging due to the nearby H4 resistances mentioned above. In regard to selling, we see very little of interest at this time. With that, our team’s position will remain flat going into today’s sessions.
Data points to consider: EUR final CPI y/y at 10am, ECB Monetary policy meeting accounts at 12.30pm. US weekly unemployment claims at 1.30pm, followed later by FOMC member Kaplan speaking at 5.30pm GMT+1.
Levels to watch/live orders:
- Buys: Flat (stop loss: N/A).
- Sells: Flat (stop loss: N/A).
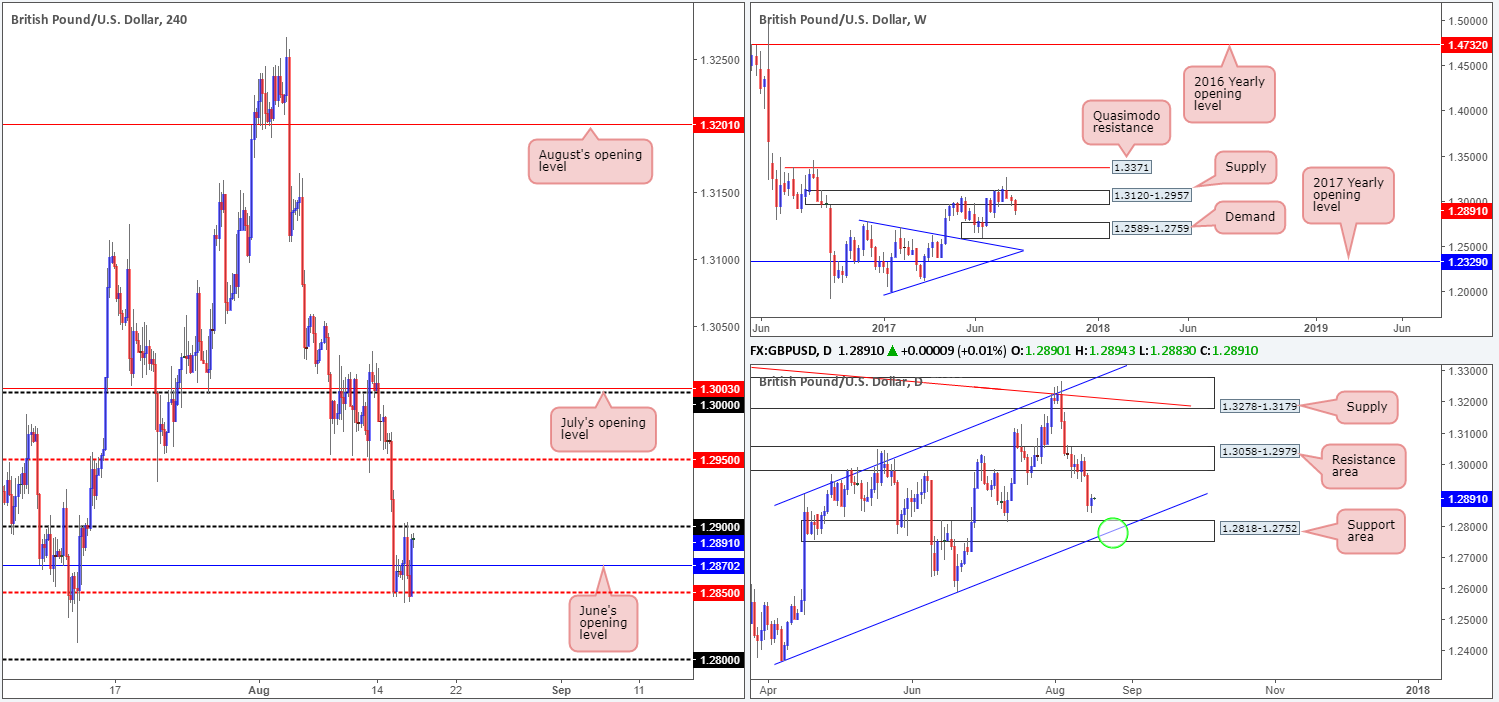
GBP/USD:
After Tuesday’s impulsive downside move, the H4 candles spent yesterday’s segment ranging between the 1.29 handle and the mid-level support at 1.2850. To our way of seeing things, this is not a buyers’ market at the moment. On the bigger picture, the daily support area at 1.3058-1.2979 recently gave way; leaving downside free to potentially challenge the daily support area pegged at 1.2818-1.2752 (converges with a daily channel support extended from the low 1.2365). Further supporting the bears, the weekly timeframe shows space for the market to trade as far down as the demand area coming in at 1.2589-1.2759.
As stated in Wednesday’s report, shorting this market sub 1.2850 is challenging. Positioned only 30 pips beneath this number is the top edge of the aforementioned daily support area, followed closely by the 1.28 handle drawn on the H4 chart.
Suggestions: On account of the above, we are looking for the market to challenge the current daily support area and its fusing channel support (green circle). It will be from this point that we’ll begin hunting for long opportunities on the H4 timeframe and lower.
Data points to consider: UK retail sales at 9.30am. US weekly unemployment claims at 1.30pm, followed later by FOMC member Kaplan speaking at 5.30pm GMT+1.
Levels to watch/live orders:
- Buys: 1.2818-1.2752 is interesting for long opportunities.
- Sells: Flat (stop loss: N/A).
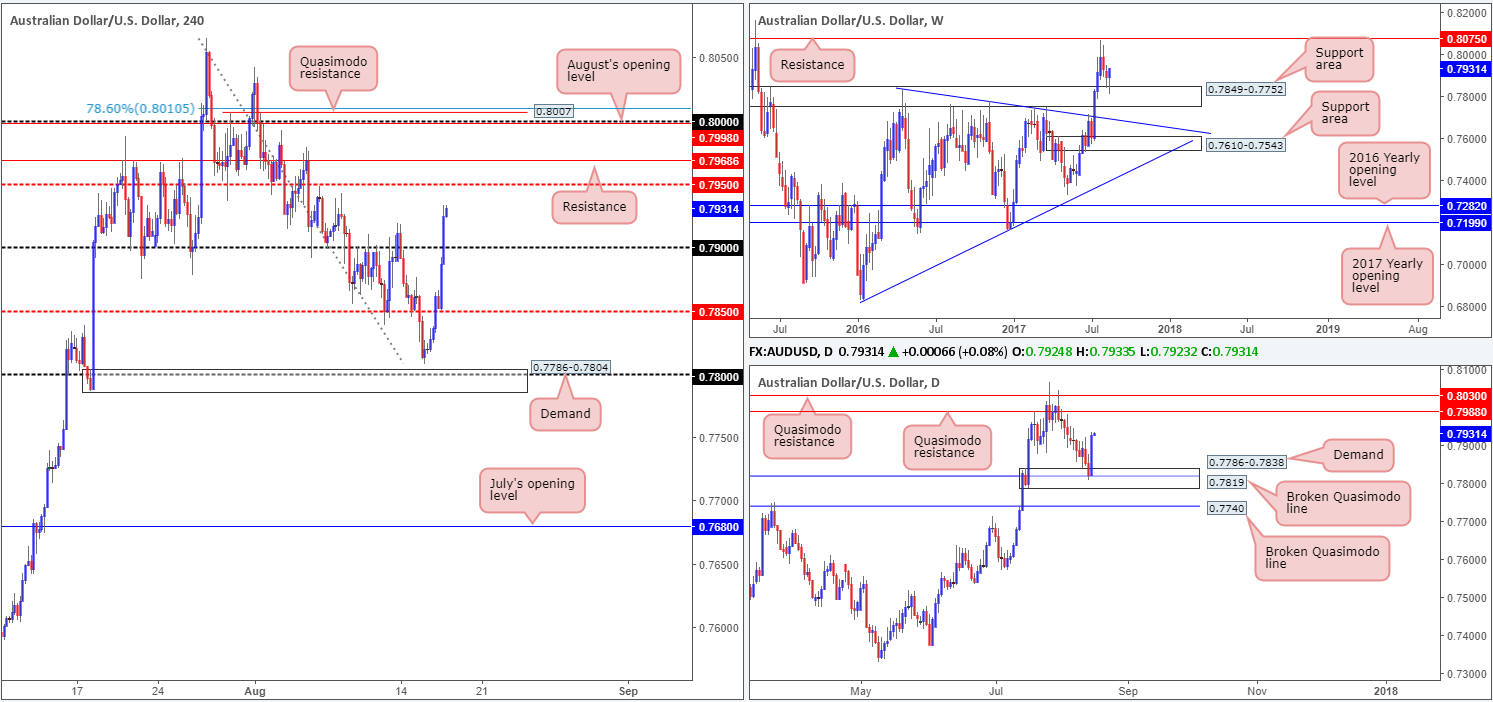
AUD/USD:
Don’t you just love it when that happens! For those of you who are regular readers you may recall that we set a pending buy order at 0.7805, with a stop-loss order tucked beneath H4 demand (0.7786-0.7804) at 0.7784. Price came within two pips of our order and has since rallied over 100 pips! Our reasoning for this trade call was due to the following structures:
- The weekly candles recently came into contact with a support area marked at 0.7849-0.7752.
- The daily timeframe also showed price interacting with a demand at 0.7786-0.7838, which encased a broken Quasimodo level at 0.7819.
- The 0.78 handle is seen housed within the current H4 demand.
Moving forward, we can see that a decline in US housing data coupled with a technically strong Aussie, forced the commodity currency beyond 0.79 into the closing bell. On the H4 timeframe, the next upside targets can be seen around the mid-level resistance at 0.7950, shadowed closely by resistance at 0.7968. Over on the higher timeframes, however, upside looks relatively free until we reach the daily Quasimodo resistance planted at 0.7988.
Suggestions: Although both the weekly and daily charts suggest that this is a buyers’ market right now, we’re not willing to buy into the noted H4 resistances. Instead, we have our eye on the large psychological band 0.80 for potential shorts. Supporting this level is August’s opening level at 0.7998, a H4 78.6% Fib resistance level at 0.8010 (taken from the high 0.8065), a H4 Quasimodo resistance at 0.8007 and the aforementioned daily Quasimodo resistance.
As weekly price shows room for the unit to trade beyond this zone up to resistance pegged at 0.8075, we would strongly advise waiting for a H4 bearish rotation candle (preferably in the shape of a full-bodied candle) to form from here, before pulling the trigger.
Data points to consider: Australian employment figures at 2.30am, followed by RBA assist Gov. Ellis speaking at 9.20am. US weekly unemployment claims at 1.30pm, followed later by FOMC member Kaplan speaking at 5.30pm GMT+1.
Levels to watch/live orders:
- Buys: Flat (stop loss: N/A).
- Sells: 0.80 region ([waiting for a reasonably sized bearish candle to form– in the shape of either a full, or near-full-bodied candle – is advised] stop loss: ideally beyond the candle’s wick).
USD/JPY:
In recent trading, the USD/JPY fell sharply after the FOMC meeting minutes triggered a broad-based dollar selloff. This left the unit free to challenge the 110 handle, which, as you can see, is taking place as we write. Although buyers are beginning to show interest from here, it’s difficult to judge whether this will transpire in to anything tradable. Granted, the move from this number has the backing of a weekly demand base seen at 108.13-108.95, but down on the daily timeframe, price shows room to move down as far as 109.11: a Quasimodo support.
Suggestions: To be quite honest, we’re not too impressed by this market at the moment.
A long from 110 not only places you against potential daily sellers, but also August’s opening level at 110.30.
With 110 holding firm at the moment and a H4 Quasimodo support seen below that at 109.56, alongside possible weekly buyers from demand, a sell is just as challenging.
Data points to consider: US weekly unemployment claims at 1.30pm, followed later by FOMC member Kaplan speaking at 5.30pm GMT+1.

Levels to watch/live orders:
- Buys: Flat (stop loss: N/A).
- Sells: Flat (stop loss: N/A).
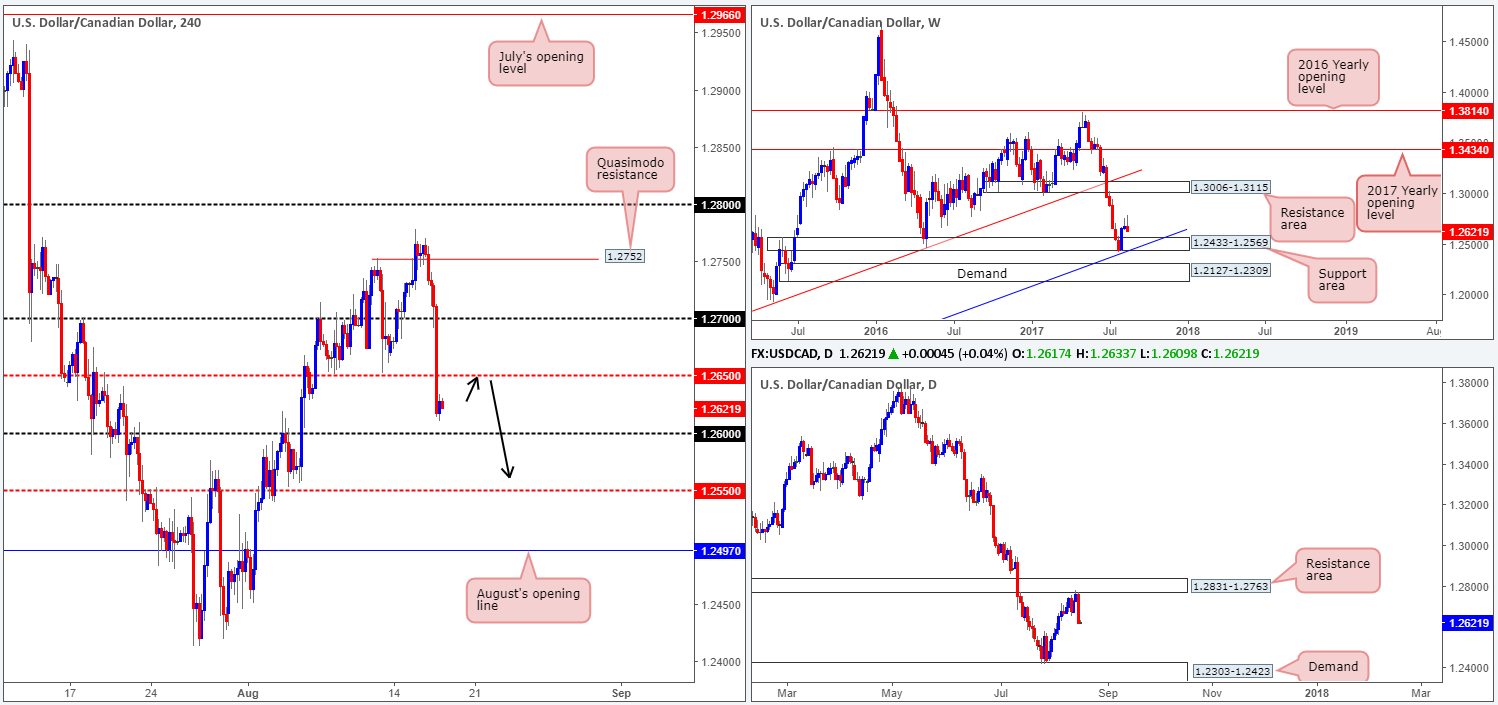
USD/CAD:
The USD/CAD spent yesterday’s sessions easing from the 1.2750 region, taking out both the 1.27 handle and the H4 mid-level support at 1.2650. Influenced by the latest FOMC meeting minutes and bolstered by a daily resistance area coming in at 1.2831-1.2763, the next level of interest on the H4 chart can be seen at 1.26. With that being said, however, we do not feel 1.26 will offer much in the way of support. Our reasoning behind this comes down to the two following points:
- Daily action shows room to trade as far down as the demand area coming in at 1.2303-1.2423.
- The top edge of weekly demand does not come into view until we reach 1.2569.
Suggestions: Put simply, we’re looking for the H4 candles to retest 1.2650 as resistance. This – coupled with a H4 bearish rotation candle in the shape of either a full, or near-full-bodied candle, would, in our opinion, be enough to suggest a short, targeting 1.2569, followed closely by H4 mid-level support at 1.2550.
Data points to consider: US weekly unemployment claims at 1.30pm, followed later by FOMC member Kaplan speaking at 5.30pm. Canadian manufacturing sales at 1.30pm GMT+1.
Levels to watch/live orders:
- Buys: Flat (stop loss: N/A).
- Sells: 1.2650 region ([waiting for a reasonably sized bearish candle to form– in the shape of either a full, or near-full-bodied candle – is advised] stop loss: ideally beyond the candle’s wick).
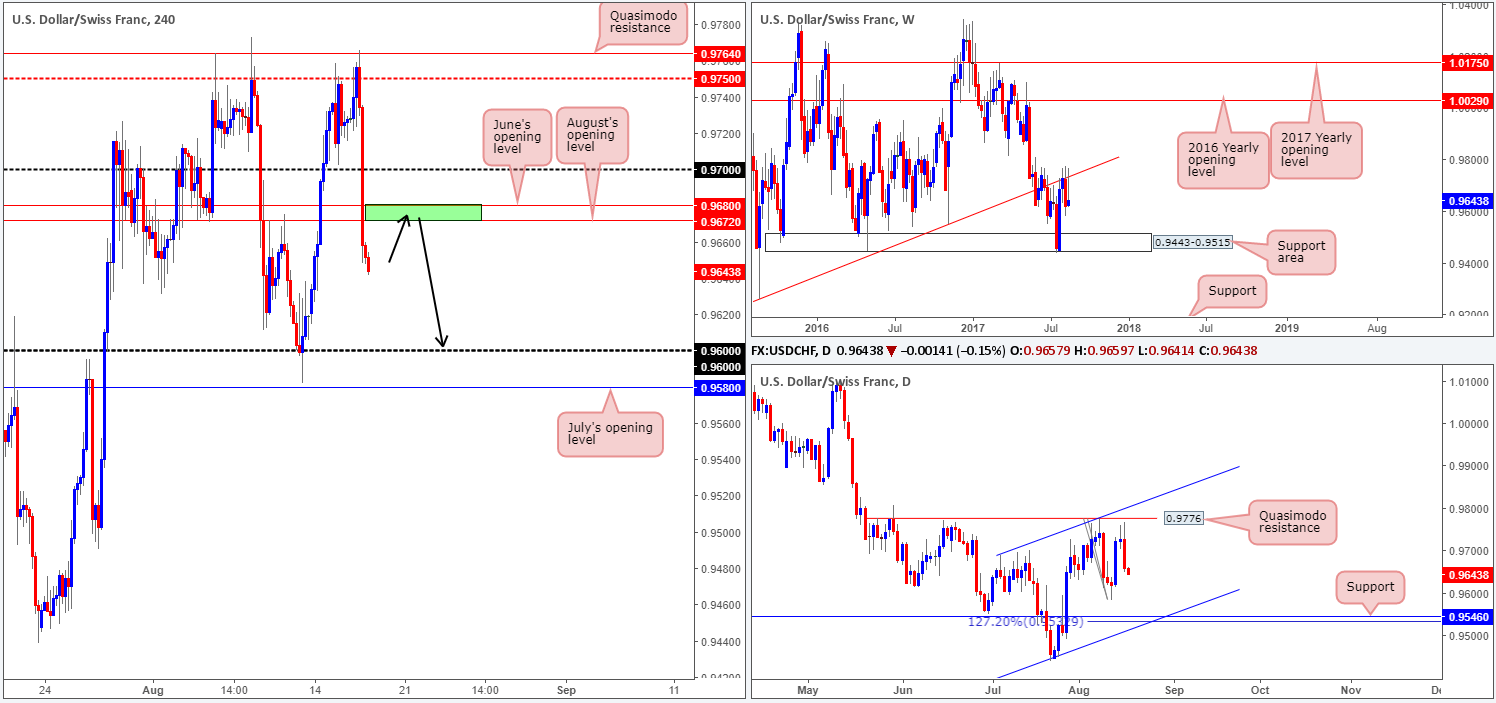
USD/CHF:
Going into the early hours of US trading yesterday, the H4 candles penetrated the mid-level resistance at 0.9750 and challenged a Quasimodo resistance seen at 0.9764. It was from this point that the US dollar began spiraling south. With the help of the latest FOMC meeting minutes, the pair ended the day slipping below both the 0.97 handle as well as June and August’s opening levels at 0.9680/0.9672.
Having seen the weekly trendline resistance (extended from the low 0.9257) continue to hold firm, H4 price may look to drive lower and connect with the 0.96 handle today. Also of particular interest is the daily timeframe. The chart shows room for the pair to trade as far down as support coming in at 0.9546, which happens to unite with a channel support etched from the low 0.9438 and a AB=CD 127.2 Fib ext. at 0.9532.
Suggestions: Consequent to the above findings, our team has their eye on the 0.9680/0.9672 green H4 area for possible shorts (June and August’s opening levels). A retest of this region, alongside a H4 bearish rotation candle in the shape of either a full, or near-full-bodied candle, would, in our opinion, be enough to suggest a short, targeting 0.96 as the initial take-profit line.
Data points to consider: US weekly unemployment claims at 1.30pm, followed later by FOMC member Kaplan speaking at 5.30pm GMT+1.
Levels to watch/live orders:
- Buys: Flat (stop loss: N/A).
- Sells: 0.9680/0.9672 region ([waiting for a reasonably sized bearish candle to form – in the shape of either a full, or near-full-bodied candle – is advised] stop loss: ideally beyond the candle’s wick).
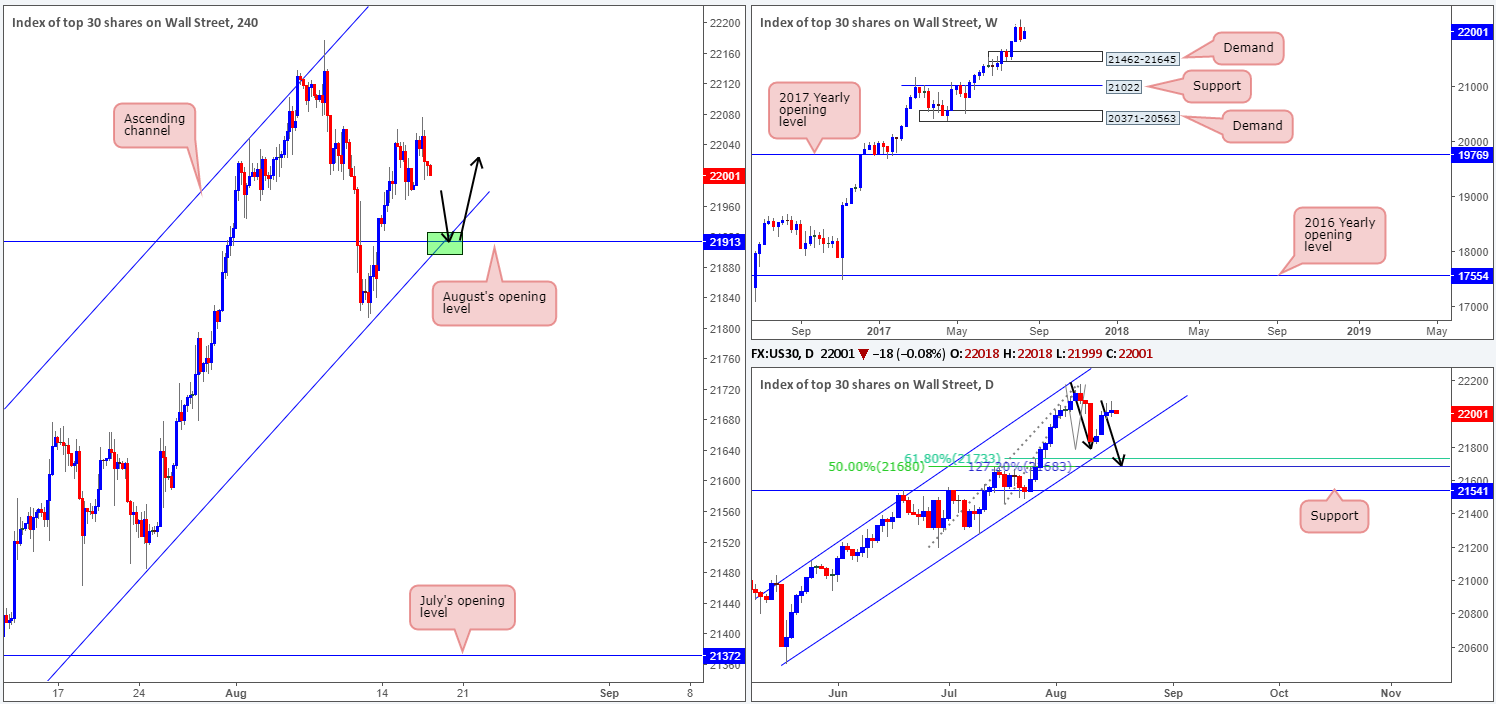
DOW 30:
During the course of yesterday’s segment, we saw the daily chart print its second consecutive selling wick. This could, should the bears move into a higher gear, bring the index down to a channel support line extended from the low 20494, followed closely by an AB=CD (black arrows) 127.2% Fib ext. at 21683. Also worth noting here is the converging 61.8% Fib support at 21733 taken from the low 21462, and 50% support line at 21680 drawn from the low 21192.
Near term, however, we can see H4 price trading nearby a channel support line extended from the low 21273, which fuses with August’s opening level at 21913 (green zone). As noted in yesterday’s report, we do not see any higher-timeframe resistances on the horizon at the moment. Therefore, a retest of August’s opening level, alongside the aforementioned H4 channel support would, in our humble view, be a nice area to consider entering long from.
Our suggestions: As you are probably already aware trendlines are unfortunately prone to being faked, so we would highly recommend being patient and waiting for a H4 bullish candle to take shape in the form of a full, or near-full-bodied candle. This will, of course, not guarantee that the level will hold, but what it will do is show bullish intent from a potential buy zone!
Data points to consider: US weekly unemployment claims at 1.30pm, followed later by FOMC member Kaplan speaking at 5.30pm GMT+1.
Levels to watch/live orders:
- Buys: 21913 region ([waiting for a reasonably sized H4 bullish candle to form – in the shape of either a full, or near-full-bodied candle – is advised] stop loss: ideally beyond the candle’s tail).
- Sells: Flat (stop loss: N/A).
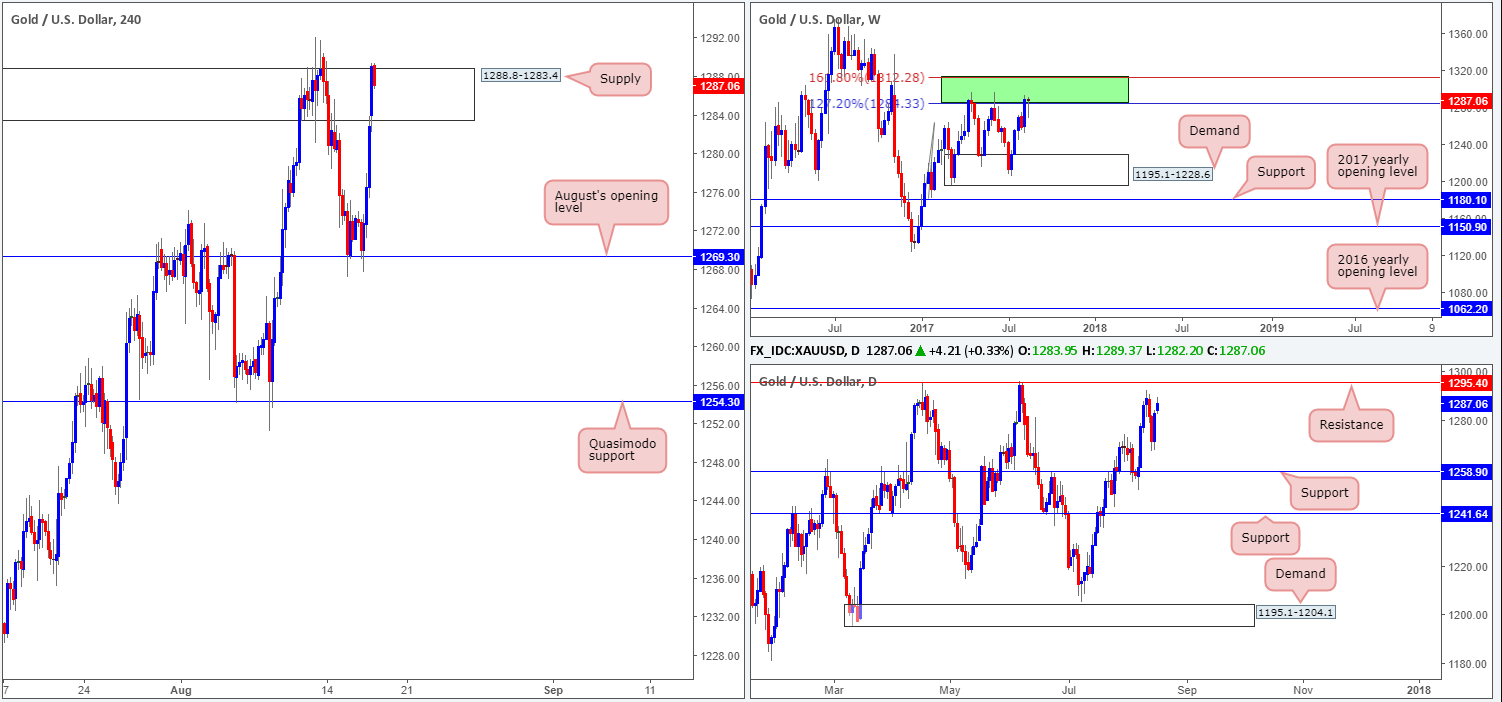
GOLD:
Kicking this morning’s analysis off with a look at the weekly timeframe, we can see that the bears are struggling to hold ground. Of course, it’s far too early to judge just yet since the green weekly resistance area (comprised of two weekly Fibonacci extensions 161.8/127.2% at 1312.2/1284.3 taken from the low 1188.1) has managed to hold the metal lower successfully on two separate occasions in the past.
The story on the daily chart, nevertheless, shows price trading nearby a resistance level at 1295.4. Apart from the two occasions on 17/04/2017 and 06/06/2017, there’s little history registered with this number! For that reason, we may see price break above this line and head to the resistance carved from 1308.4, which boasts very attractive history dating back to early 2011.
August’s opening level at 1269.3, as can be seen on the H4 timeframe, held beautifully as support on Wednesday. Bolstered by a decline in the US dollar, the unit attacked supply coming in at 1288.8-1283.4. The way we see things right now is this H4 supply is the last barrier stopping daily price from connecting with resistance mentioned above at 1295.4.
Our suggestions: Based on the above notes, our desk will not be looking for (long-term) shorts until the daily resistance line plotted at 1308.4 is in play. This is due to the history surrounding this number and its position within the current weekly resistance area (allowing us to place stops tightly above this zone). Regarding intraday opportunities, we see very little to hang our hat on at the moment.
Levels to watch/live orders:
- Buys: Flat (stop loss: N/A).
- Sells: 1308.4 region. This is, given the location of this daily resistance on the weekly timeframe, a fantastic level to be looking for a short from.