Waiting for lower timeframe confirmation is our main tool to confirm strength within higher timeframe zones, and has really been the key to our trading success. It takes a little time to understand the subtle nuances, however, as each trade is never the same, but once you master the rhythm so to speak, you will be saved from countless unnecessary losing trades. The following is a list of what we look for:
- A break/retest of supply or demand dependent on which way you’re trading.
- A trendline break/retest.
- Buying/selling tails/wicks – essentially we look for a cluster of very obvious spikes off of lower timeframe support and resistance levels within the higher timeframe zone.
We typically search for lower-timeframe confirmation between the M15 and H1 timeframes, since most of our higher-timeframe areas begin with the H4. Stops are usually placed 1-3 pips beyond confirming structures.
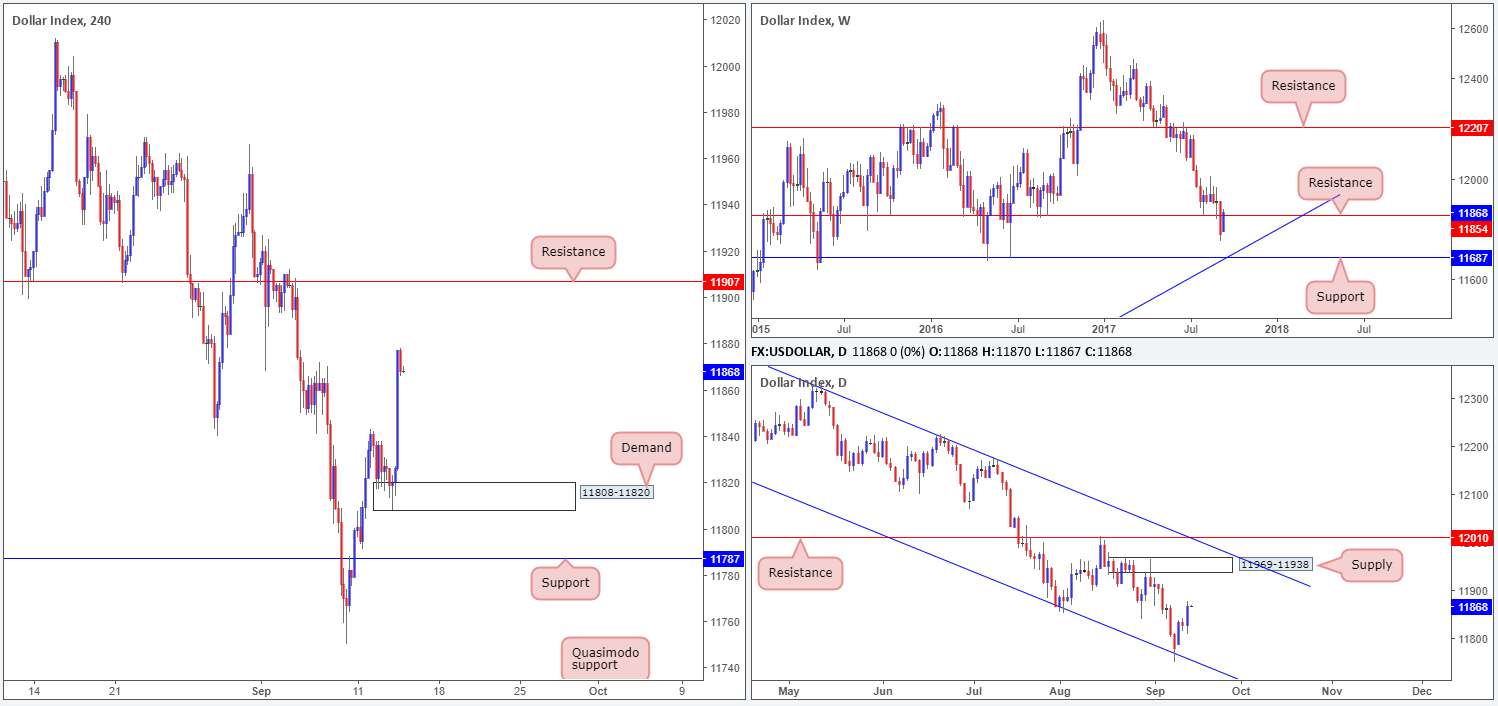
US dollar index (USDX):
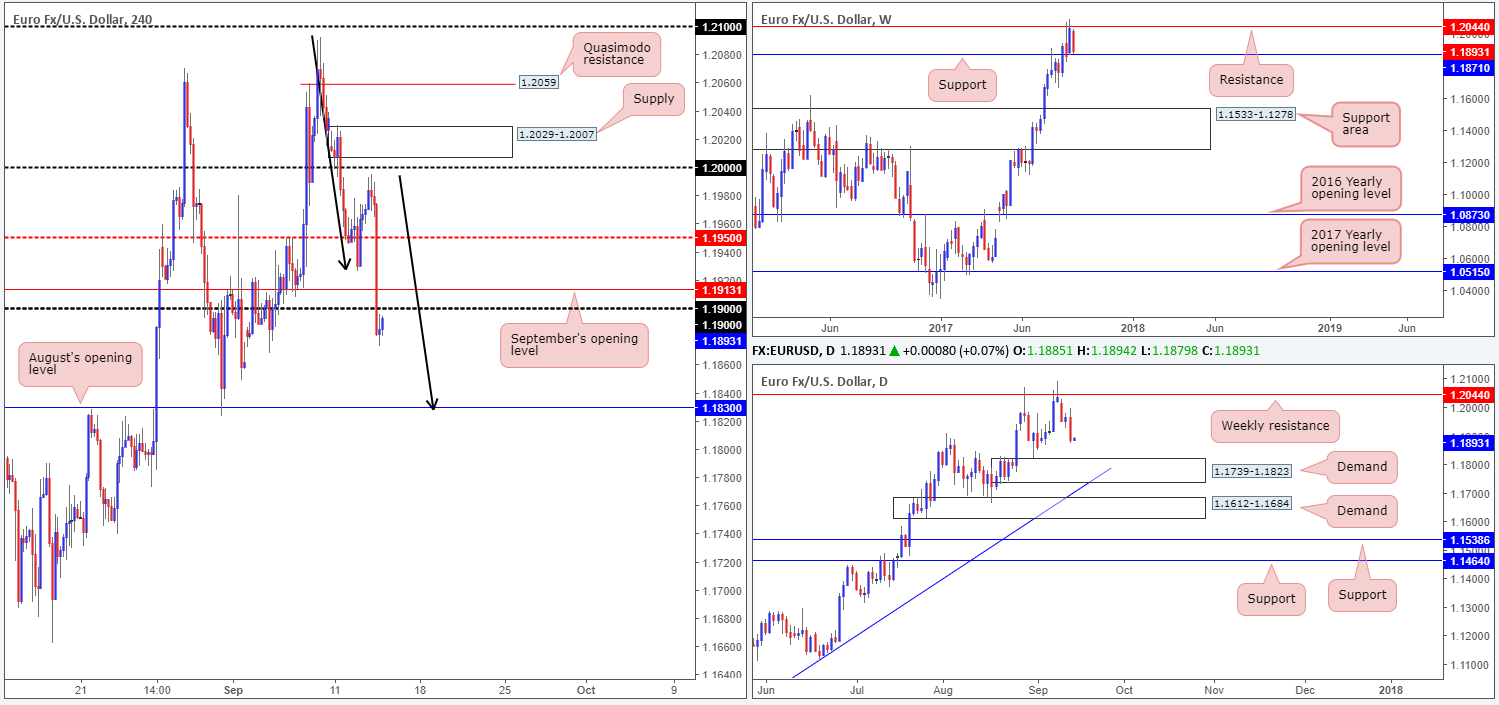
EUR/USD:
Across the board, the US dollar rallied against the majority of its trading peers on Wednesday amid tax reform talks, consequently pushing the single currency south. After crushing the 1.19 handle, the pair ended the day bottoming around the 1.1873 mark.
With yesterday’s aggressive slide, technical traders are likely watching for September’s opening level at 1.1913/1.19 handle to hold firm as resistance. Should this come to fruition, all eyes will likely then be on August’s opening line at 1.1830, which happens to not only be positioned a few pips above daily demand at 1.1739-1.1823, it also converges with a H4 AB=CD bullish formation (see black arrows). However, for price to sell off and reach 1.1830, weekly support at 1.1871 would need to be weakened.
Suggestions: We feel the best thing to do right now is be patient. It would, in our technical view, be unwise to attempt a sell at 1.1913/1.19 when weekly price is so near to support. Should price push lower and challenge 1.1830, however, then great, we have a high-probability buy zone to trade. If not, we could see the unit extend back up to the mid-level point 1.1950 or quite possibly the large number 1.20.
Data points to consider: US Inflation figures and US Unemployment claims at 1.30pm GMT+1.
Levels to watch/live orders:
- Buys: 1.1830 region ([waiting for a H4 bullish candle to form – preferably in the shape of a full, or near full-bodied candle – is advised] stop loss: ideally beyond the candle’s tail).
- Sells: Flat (stop loss: N/A).
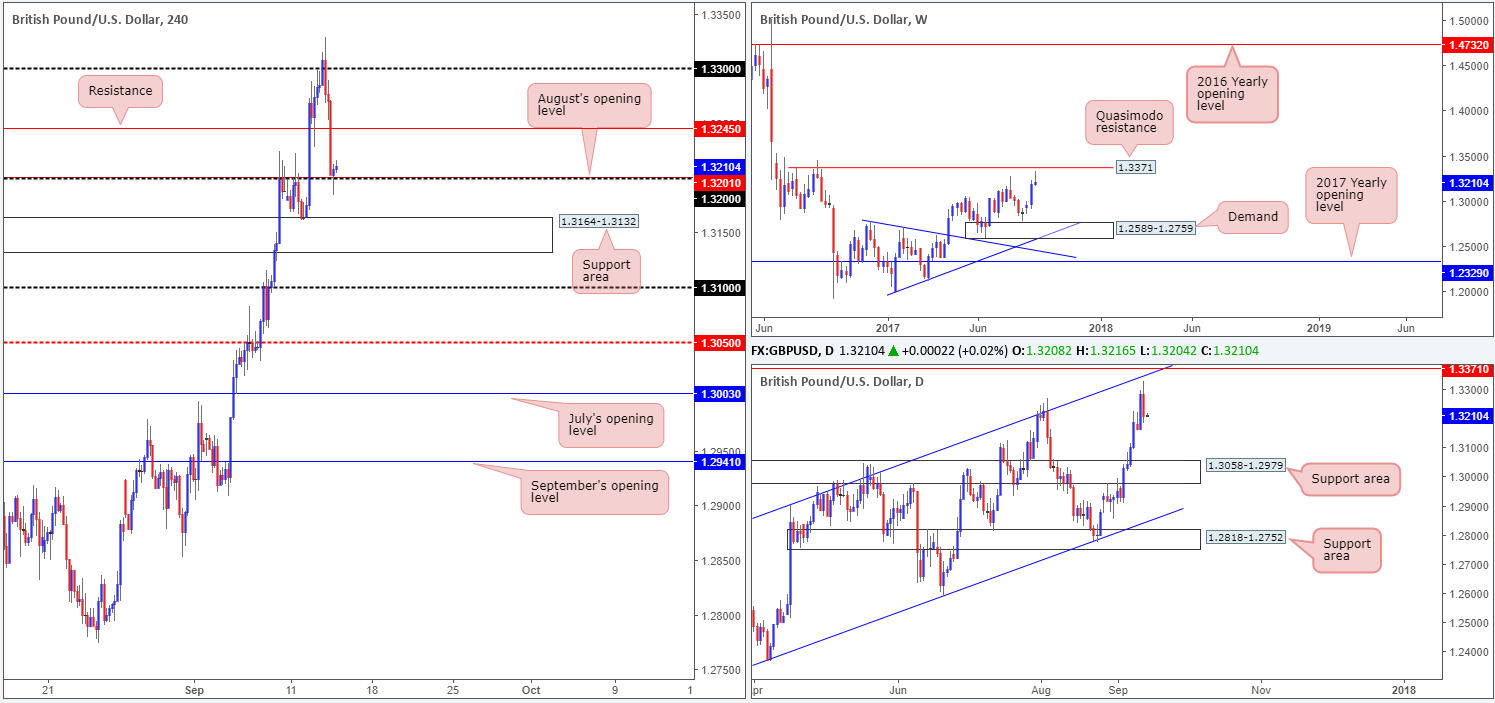
GBP/USD:
Disappointing UK employment data (+2.1% versus +2.3% expected) sent the British pound lower in early trading on Wednesday. This – coupled with a robust dollar eventually saw the pair challenge the 1.32 handle going into the closing bell. Meanwhile, over on the bigger picture, weekly price found a ceiling around 1.3328 ahead of the Quasimodo resistance level at 1.3371. Similarly, down on the daily chart price turned ahead of the channel resistance extended from the high 1.2903.
Suggestions: With cable supported by 1.32 right now, it’s possible the unit will look to retest H4 resistance at 1.3245 today. This level has a high probability of bouncing price as it is effectively an ignored Quasimodo line. Be that as it may, we believe this is still a somewhat risky short for two reasons. Firstly, higher-timeframe action may look to push higher to connect with the said resistances. Secondly, we do not see much additional confirmation around the 1.3245 area. Well, not enough for us to place capital on the line anyway!
So, with the above notes in mind, we will remain flat for now.
Data points to consider: BoE takes the stage at 12pm. US Inflation figures and US Unemployment claims at 1.30pm GMT+1.
Levels to watch/live orders:
- Buys: Flat (stop loss: N/A).
- Sells: Flat (stop loss: N/A).
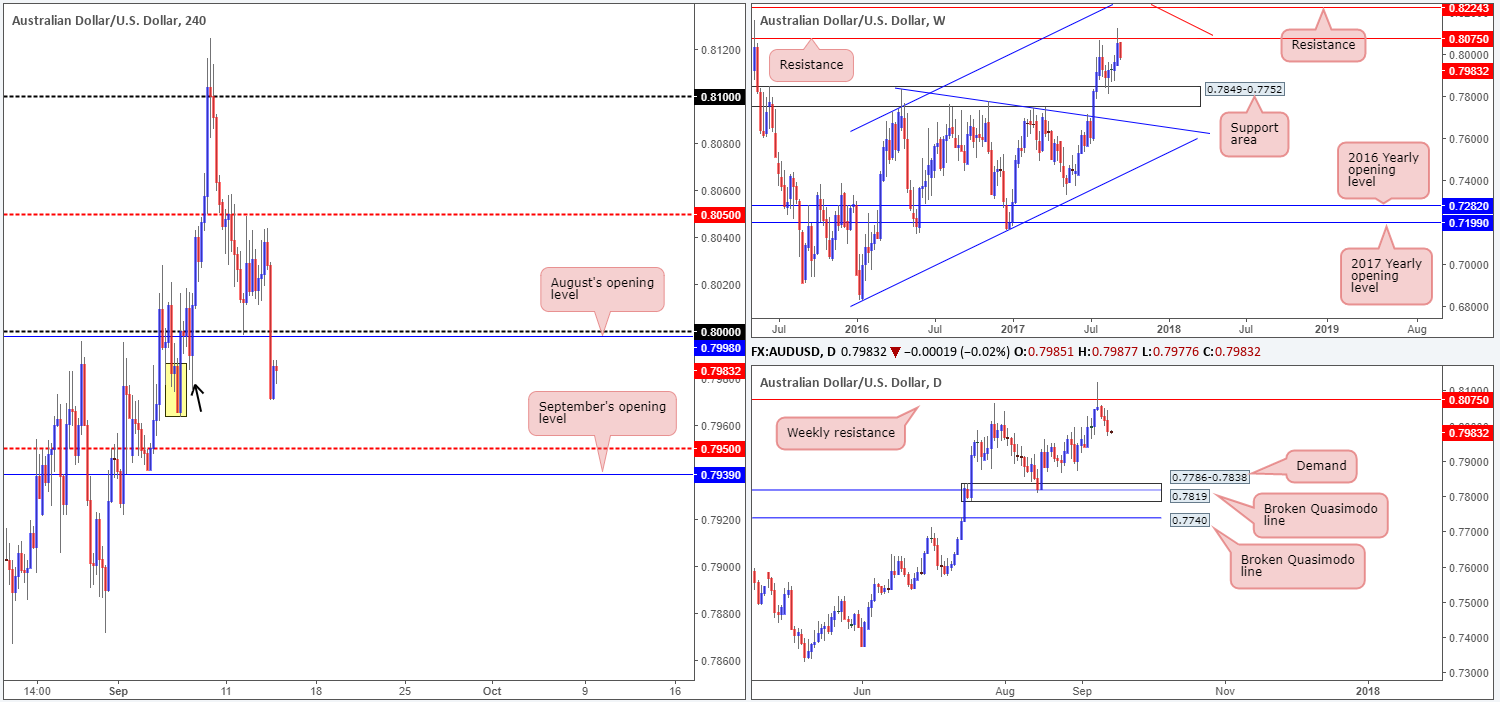
AUD/USD:
In recent trading, the commodity currency stormed through the key 0.80 handle/August’s opening level at 0.7998. The move, influenced by US tax reform talks, saw the pair bottom at 0.7970.
For those who read Wednesday’s report you may recall us highlighting possible shorting opportunities should a decisive H4 close be seen beyond 0.80. This is due to a couple of reasons:
- Weekly price currently trading from resistance at 0.8075, which shows room to extend as far down as the support area pegged at 0.7849-0.7752.
- Beyond 0.80, we believe the pair could end up trading as low as September’s opening level at 0.7939. This is simply because there’s a high probability that the H4 demand painted in yellow at 0.7965-0.7988 has already had its orders taken by the H4 tail seen marked with a black arrow at 0.7974.
Suggestions: A retest of 0.80, coupled with a H4 bearish candle (preferably in the form of a full, or near-full-bodied candle) would, in our view, be enough to warrant an intraday sell down to at least the 0.7950 neighborhood.
Data points to consider: Australian Employment figures at 2.30am, Chinese Industrial production at 3am. US Inflation figures and US Unemployment claims at 1.30pm GMT+1.
Levels to watch/live orders:
- Buys: Flat (stop loss: N/A).
- Sells: 0.80 region ([waiting for a H4 bearish candle to form – preferably in the shape of a full, or near full-bodied candle – is advised] stop loss: ideally beyond the candle’s wick).
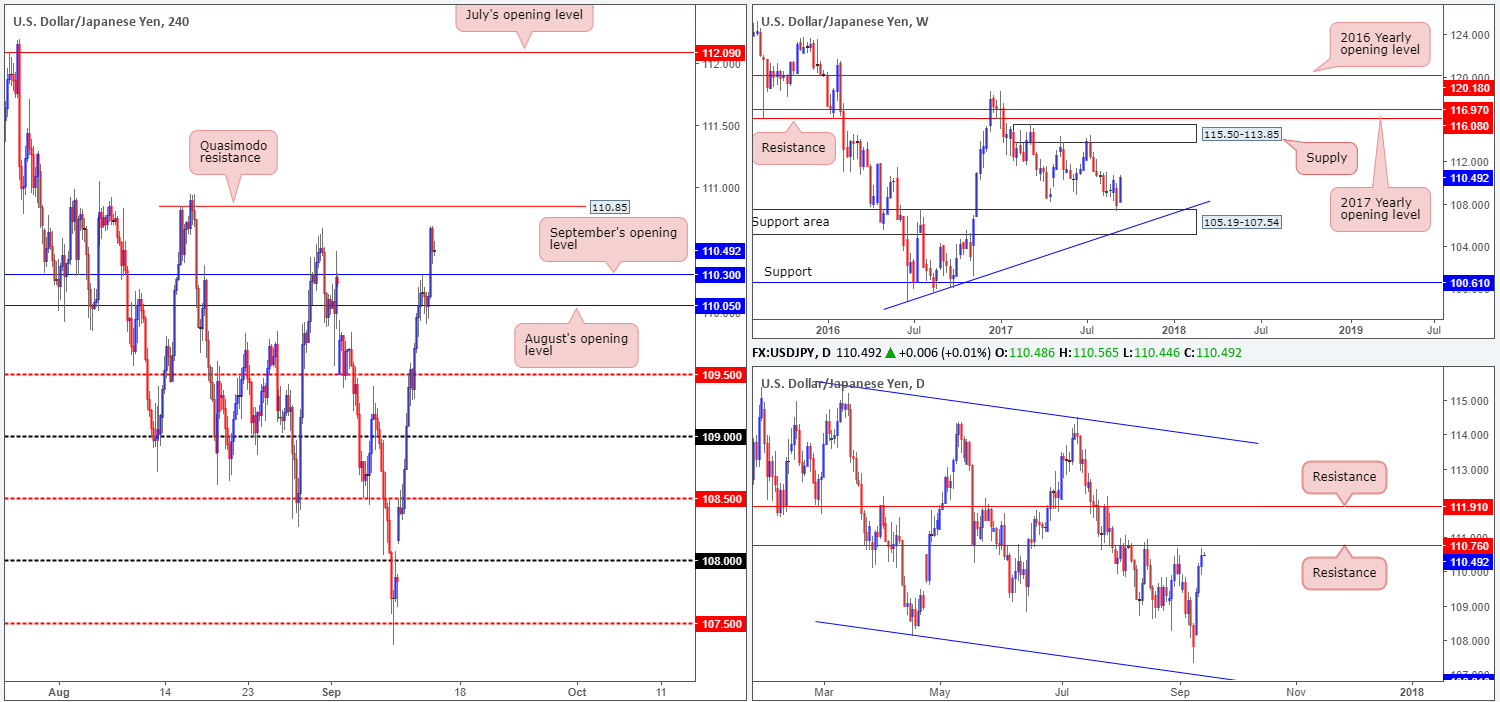
USD/JPY:
Propelled by recent US tax reform talks, the USD/JPY ripped through offers positioned at September’s opening level drawn from 110.30. As you can see, this has opened up the path north for the H4 candles to test the Quasimodo resistance at 110.85. Also of particular interest, daily price is now trading within touching distance of resistance registered at 110.76. On the other side of the coin, however, weekly price is seen rallying from a support area penciled in at 105.19-107.54.
Suggestions: Watch the H4 Quasimodo resistance at 110.85 for a potential sell trade. We like this level because it sits just above daily resistance at 110.76. However, in view of weekly bulls trading from a support area, additional candle confirmation would be required before a trade can be initiated from here. Should this come to realization, we would likely be looking to trail the position down to 110.30 as an initial take-profit zone.
Data points to consider: US Inflation figures and US Unemployment claims at 1.30pm GMT+1.
Levels to watch/live orders:
- Buys: Flat (stop loss: N/A).
- Sells: 110.85 region ([waiting for a H4 bearish candle to form – preferably in the shape of a full, or near full-bodied candle – is advised] stop loss: ideally beyond the candle’s wick).
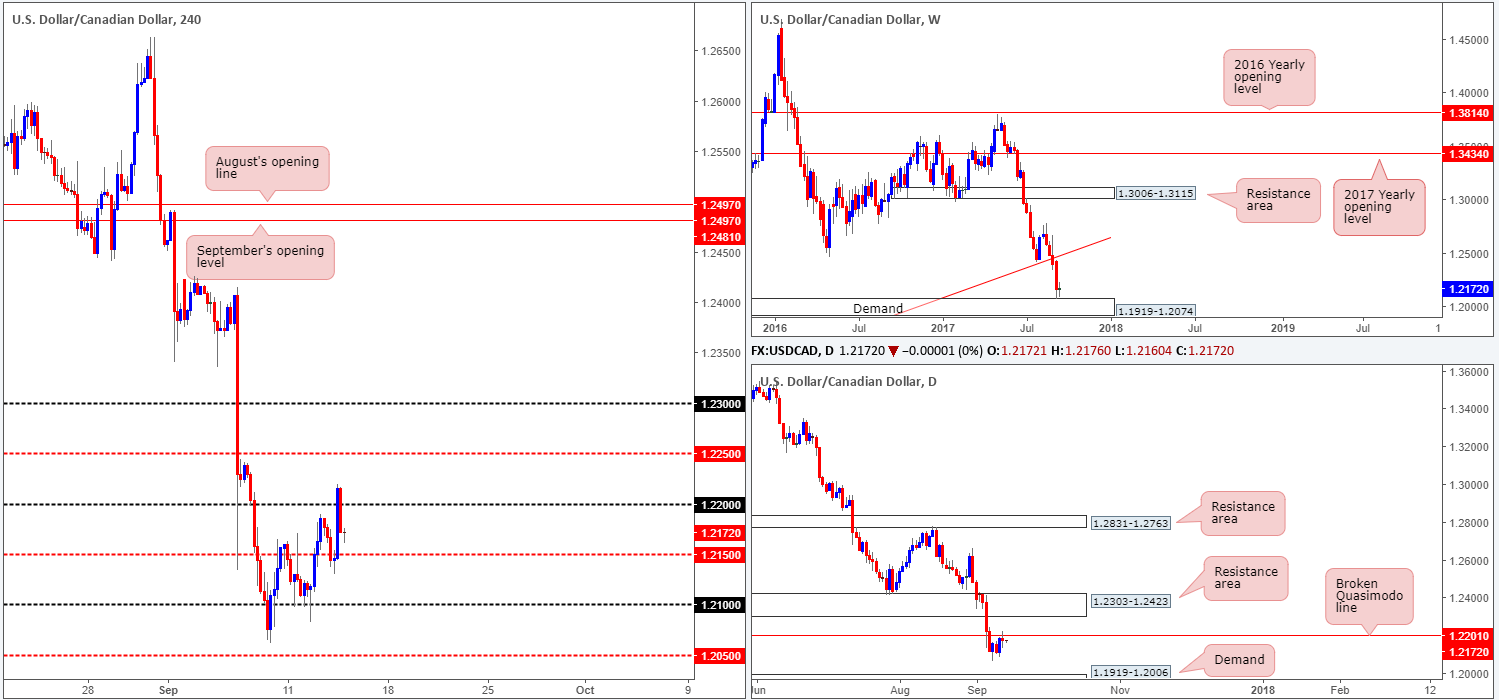
USD/CAD:
On Wednesday, we set a pending sell order at 1.22 with a stop-loss order positioned 20 pips above at 1.2220. Our basis for the trade was not only the round number, but also a H4 38.2% Fib resistance at 1.22, a daily broken Quasimodo line at 1.2201 and a H4 AB=CD bearish formation topping at 1.22. Unfortunately, our stop was taken out at the pip before turning lower. It’s frustrating, but this happens.
Although weekly price recently connected with demand printed at 1.1919-1.2074, we still have a bearish bias towards this market. Not only because of the current daily broken Quasimodo line mentioned above at 1.2201, but also because of the pair’s strong downtrend since May.
Suggestions: To become sellers, a H4 close beyond the mid-level support at 1.2150 is required. To our way of seeing things, this will help confirm bull weakness at the current weekly demand, and at the same time demonstrate bearish intent from the daily broken Quasimodo resistance. A retest at 1.2150, coupled with a lower-timeframe sell signal (see the top of this report), would be sufficient enough to trade short, targeting 1.21 as an INITIAL take-profit zone.
Data points to consider: US Inflation figures and US Unemployment claims at 1.30pm GMT+1.
Levels to watch/live orders:
- Buys: Flat (stop loss: N/A).
- Sells: Watch for H4 price to engulf 1.2150 and then look to trade any retest seen thereafter ([waiting for a lower-timeframe sell signal to form following the retest is advised] stop loss: dependent on where one confirms this level).
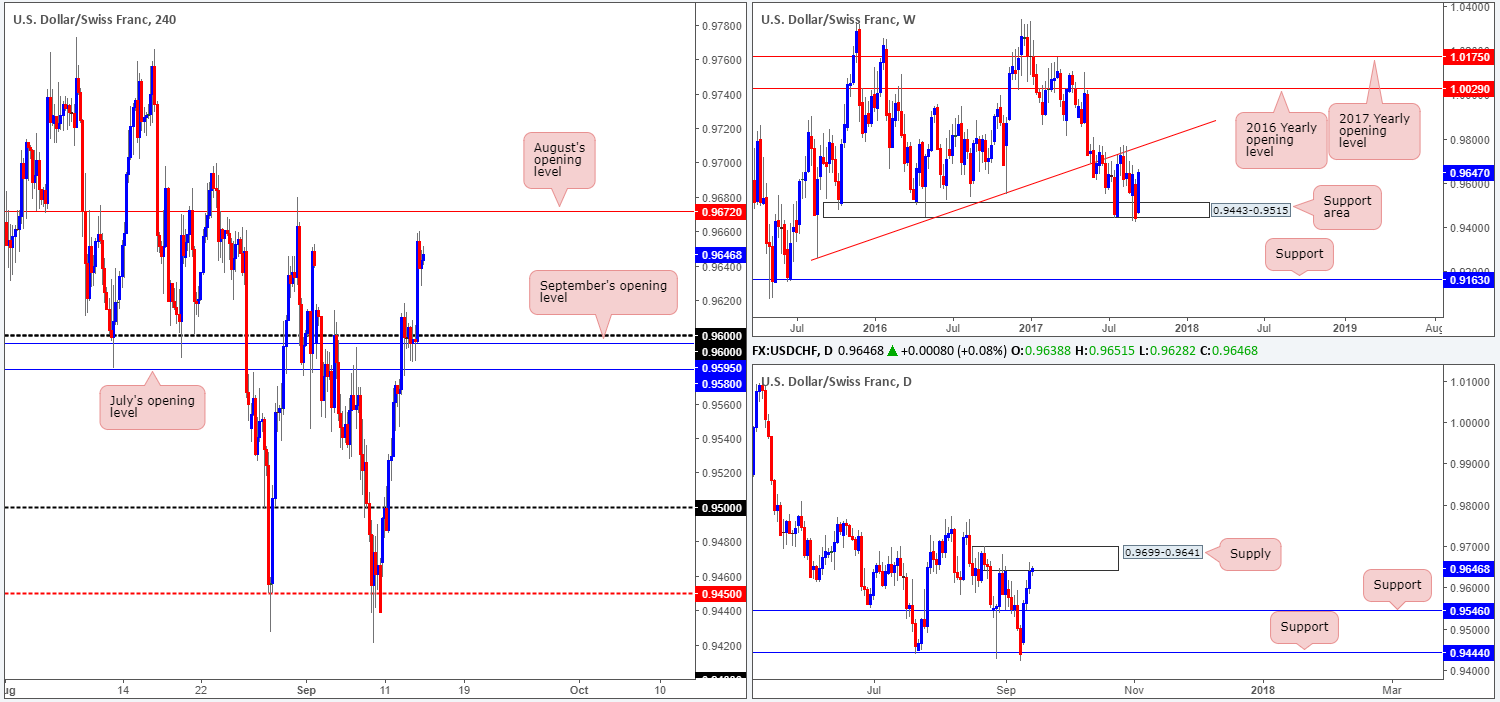
USD/CHF:
After finding support at September’s opening level/0.96 handle at 0.9595/0.96 on Wednesday, the safe-haven pair extended gains to a high of 0.9659 on tax reform news. Filling the prior week’s weekend gap, the H4 chart shows price now trading within a few pips of August’s opening line at 0.9672. From a technical perspective, this week’s advance has largely been due to the weekly support area coming in at 0.9443-0.9515. However, with daily supply at 0.9699-0.9641 now in the fight, a bearish presence may come into view.
Suggestions: Initial thinking brings us to August’s opening level for possible selling opportunities, given that it is fixed within the aforementioned daily supply. There are, however, a few cautionary points to consider:
- Weekly buying pressure seen from the current support area.
- The daily supply may be weak due to it having already been tested.
- There is little H4 confluence seen around August’s opening level.
While August’s opening level may very well hold price lower today, we feel it is just too much of a risk at the moment.
Data points to consider: US Inflation figures and US Unemployment claims at 1.30pm. SNB Interest-rate statement at 8.30am GMT+1.
Levels to watch/live orders:
- Buys: Flat (stop loss: N/A).
- Sells: Flat (stop loss: N/A).
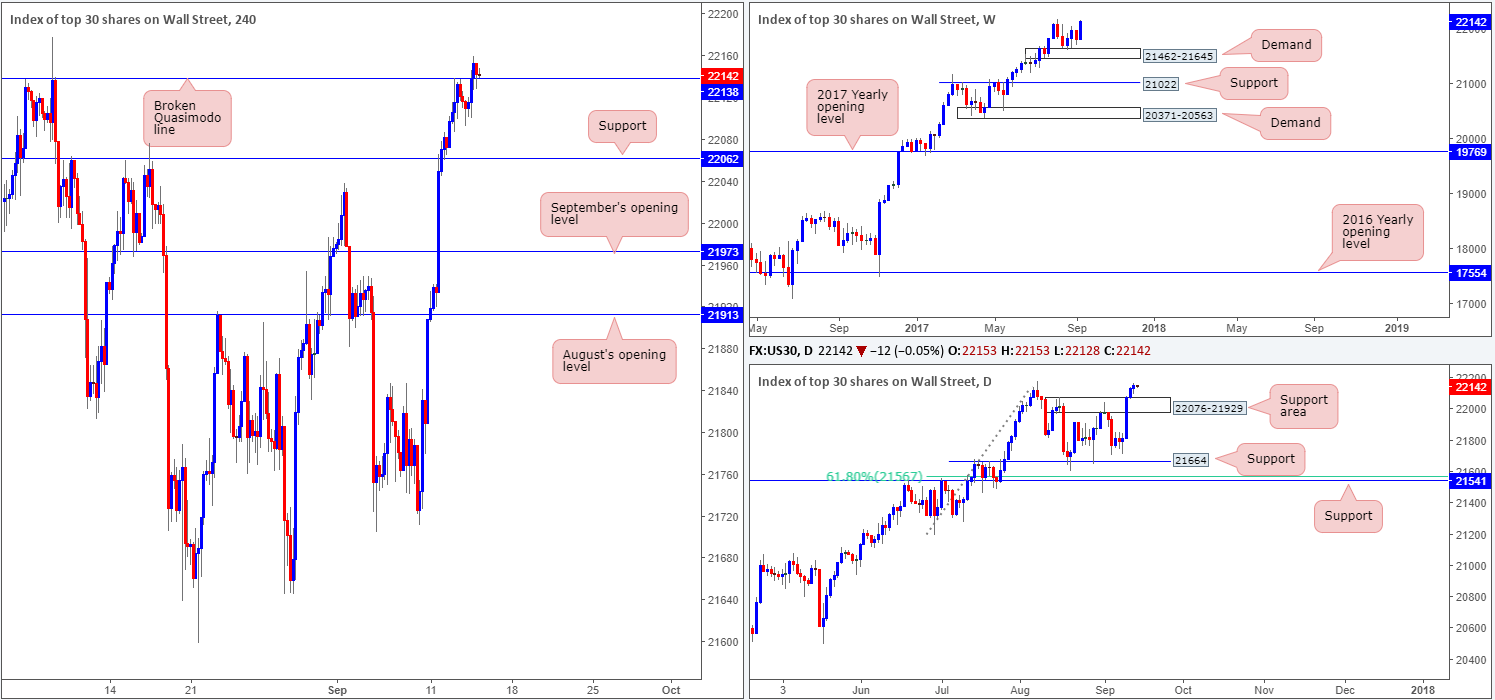
DOW 30:
The DOW, as you can see on the H4 chart, edged its way above the Quasimodo resistance at 22138 on Wednesday and has maintained a bullish footing. As highlighted in yesterday’s report, we believe this H4 barrier was the last remaining resistance stopping the index from achieving fresh record highs. So, with this line out of the picture and currently holding as a support, a long from here is high probability, in our opinion.
Suggestions: Keeping it nice and simply today, we’re going to watch how H4 action responds at 22138 given that it is now support. To become a buyer, a H4 bullish candle needs to be seen, preferably in the shape of a full, or near-full-bodied candle. The beautiful thing about this setup is that there is effectively no clear take-profit target, meaning that we could potentially join, what seems to be, the never-ending bull run.
Data points to consider: US Inflation figures and US Unemployment claims at 1.30pm GMT+1.
Levels to watch/live orders:
- Buys: 22138 region ([waiting for a reasonably sized H4 bullish candle to form – preferably a full, or near-full-bodied candle – is advised] stop loss: ideally beyond the candle’s tail).
- Sells: Flat (stop loss: N/A).
GOLD:
The yellow metal, as you can see, failed to sustain Tuesday’s gains on Wednesday. After topping at 1334.5, the unit headed south on strong dollar buying due to recent news on a US tax reform. H4 flow ran through bids at support drawn from 1325.9 and went on to challenge September’s opening level coming in at 1320.4.
While there is absolutely no higher-timeframe support structures in view at the moment (the closest is daily support logged at 1308.4), the odds of a push lower is strong, right? While there is a chance that gold could push lower, it might be worth noting that the USDX weekly chart shows price trading around resistance at 11854. For those who do not know, there exists an inverse correlation between these two markets. Therefore, should US weekly candles hold firm at resistance and push lower, this could see the metal bid higher.
Suggestions: With the above notes taken on board, we feel it’s too much of a risk to buy at this point. Nevertheless, a H4 close back above the H4 resistance at 1325.9 would, for us at least, confirm upside strength. And as such, this could be used as an entry trigger to long gold given the position of US weekly price at the moment.
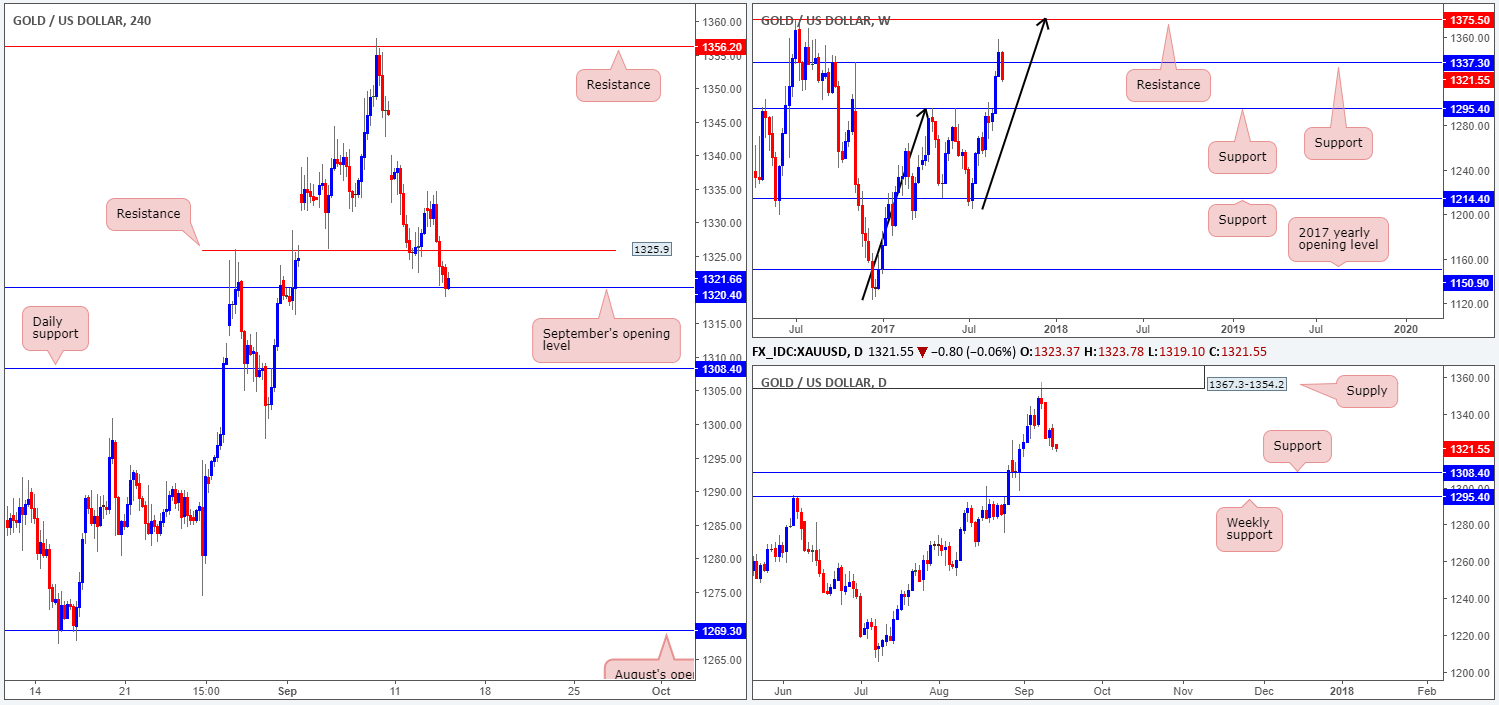
Levels to watch/live orders:
- Buys: Watch for H4 price to engulf 1325.9 and then look to trade any retest seen thereafter (stop loss: ideally beyond the rejection candle’s tail).
- Sells: Flat (stop loss: N/A).


