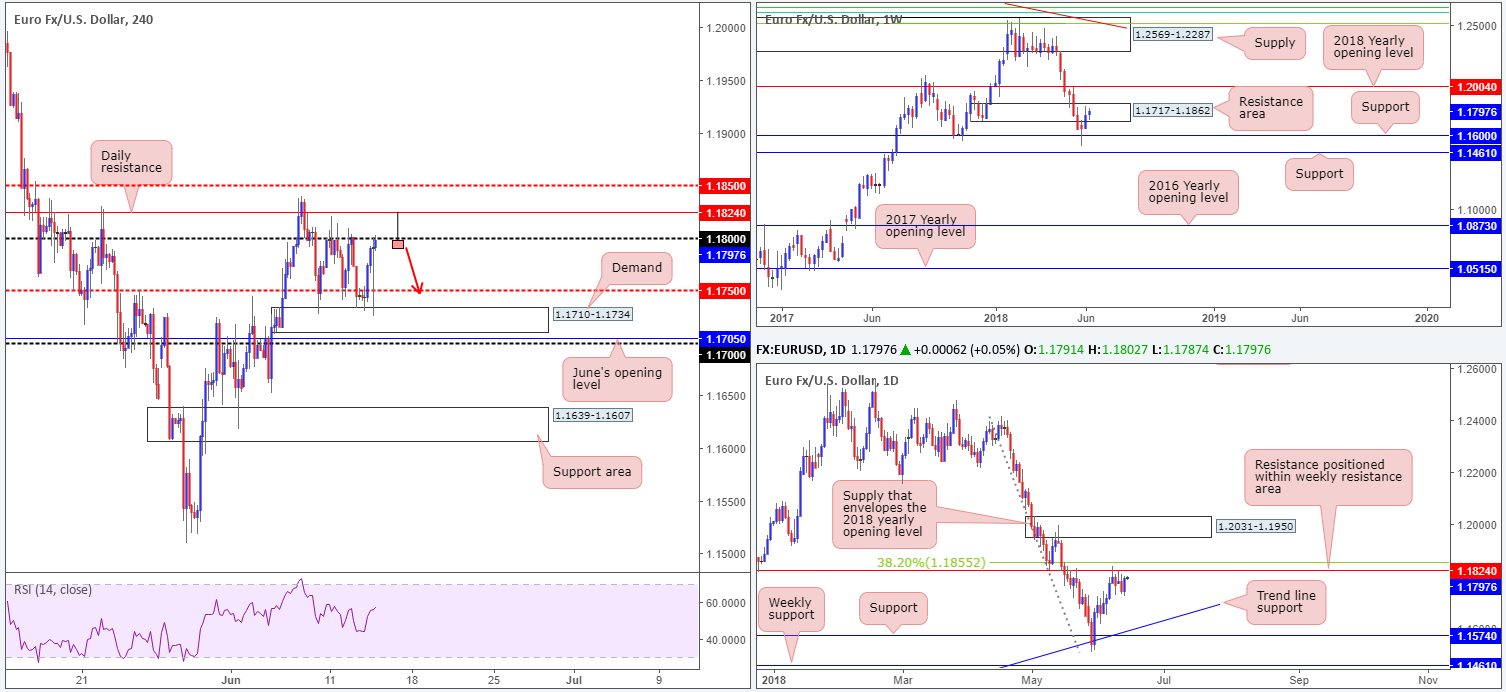
EUR/USD:
The greenback soared across the board on Wednesday after the FOMC announced its decision to hike rates. The move, nonetheless, was a short-lived one. As Chairman Powell was giving his press conference, news that the US was preparing to place tariffs on China resulted in the dollar paring gains. As is displayed on the H4 chart, the EUR/USD remains pretty much unchanged in terms of technical structure. The H4 candles continue to respect boundaries between H4 demand at 1.1710-1.1734 and the 1.18 handle: its current range.
The story over on the bigger picture, nevertheless, shows us that weekly price remains trading within the walls of a weekly resistance area seen at 1.1717-1.1862. Also of particular interest is the nearby daily resistance at 1.1824, which is seen sited just south of the 38.2% daily Fib resistance at 1.1855 and plotted within the aforementioned weekly area.
Areas of consideration:
Given the overhead resistance seen on both weekly and daily structure right now, a selloff from the 1.18 region today is certainly a possibility. With that being said, though, do remain cognizant of the nearby daily resistance mentioned above at 1.1824. This level is an ideal base to attack should price decide to whipsaw above 1.18 and trip stops.
In fact, an ideal sell signal would be for a H4 bearish pin-bar formation to take shape that pierces through 1.18 and taps the daily resistance (see H4 chart for a visual representation). As for stop-loss placement, above the rejection candle’s wick is likely best, with an initial take-profit target objective set at the H4 demand zone highlighted above at 1.1710-1.1734: the opposite end of the H4 range.
Traders may also want to note that the ECB monetary policy decision is due later on today, along with the press conference. Unanimous expectations look for the ECB to leave its three key rates unchanged.
Today’s data points: ECB monetary policy decision and press conference; US retail sales m/m; US weekly unemployment claims.
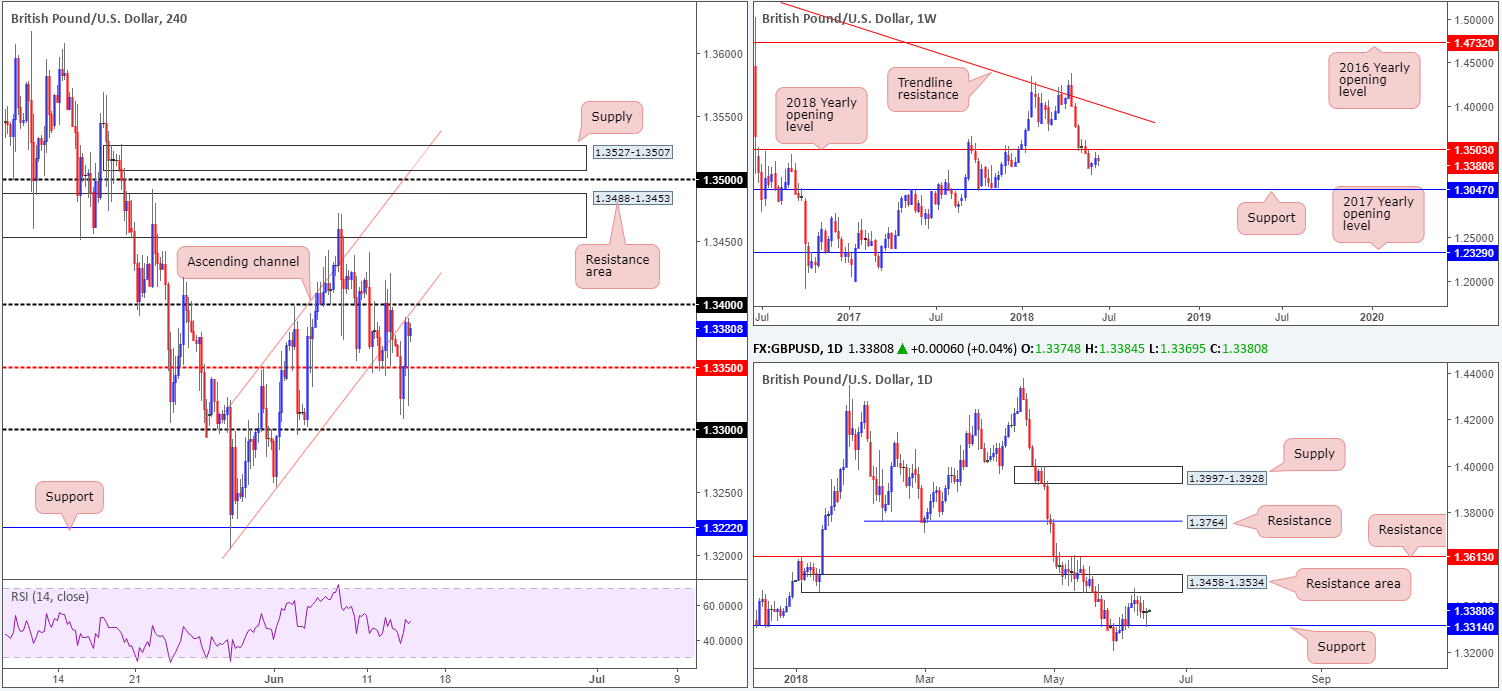
GBP/USD:
In recent sessions, we witnessed the British pound dip below H4 mid-level support at 1.3350 and bottom just north of the 1.33 handle. Although the H4 candles managed to reclaim 1.3350 on a strong bid, the H4 channel support-turned resistance (taken from the low 1.3204) was brought into the fray amid the FOMC announcing its decision to hike rates.
Through the simple lens of a technical trader, the reason behind cable bottoming just ahead of 1.33 yesterday can be found on the daily timeframe: a daily support drawn from 1.3314. Also note that daily price reacted to this level in the shape of a daily bullish pin-bar formation (considered a buy signal among the candlestick community). As for weekly action, the pair remains balanced just beneath the 2018 yearly opening level at 1.3503.
Areas of consideration:
In the event that buyers enter the market on the back of Wednesday’s reaction off of daily support, the next upside target on this scale falls in at a daily resistance area drawn from 1.3458-1.3534. This would imply a break above 1.34 and a test of the H4 resistance area at 1.3488-1.3453. Intraday longs above the 1.34 boundary, therefore, could be an option today.
As for prospective sell zones, the team still has their eye on the H4 supply zone at 1.3527-1.3507. Positioned strategically above the 1.35 handle, the zone has ‘fakeout 1.35 to me’ written all over it. Also note that the H4 supply is positioned within the walls of the current daily resistance area and the 1.35 handle represents the 2018 yearly opening level mentioned above at 1.3503 (weekly timeframe).
Today’s data points: UK retail sales m/m; US retail sales m/m; US weekly unemployment claims.
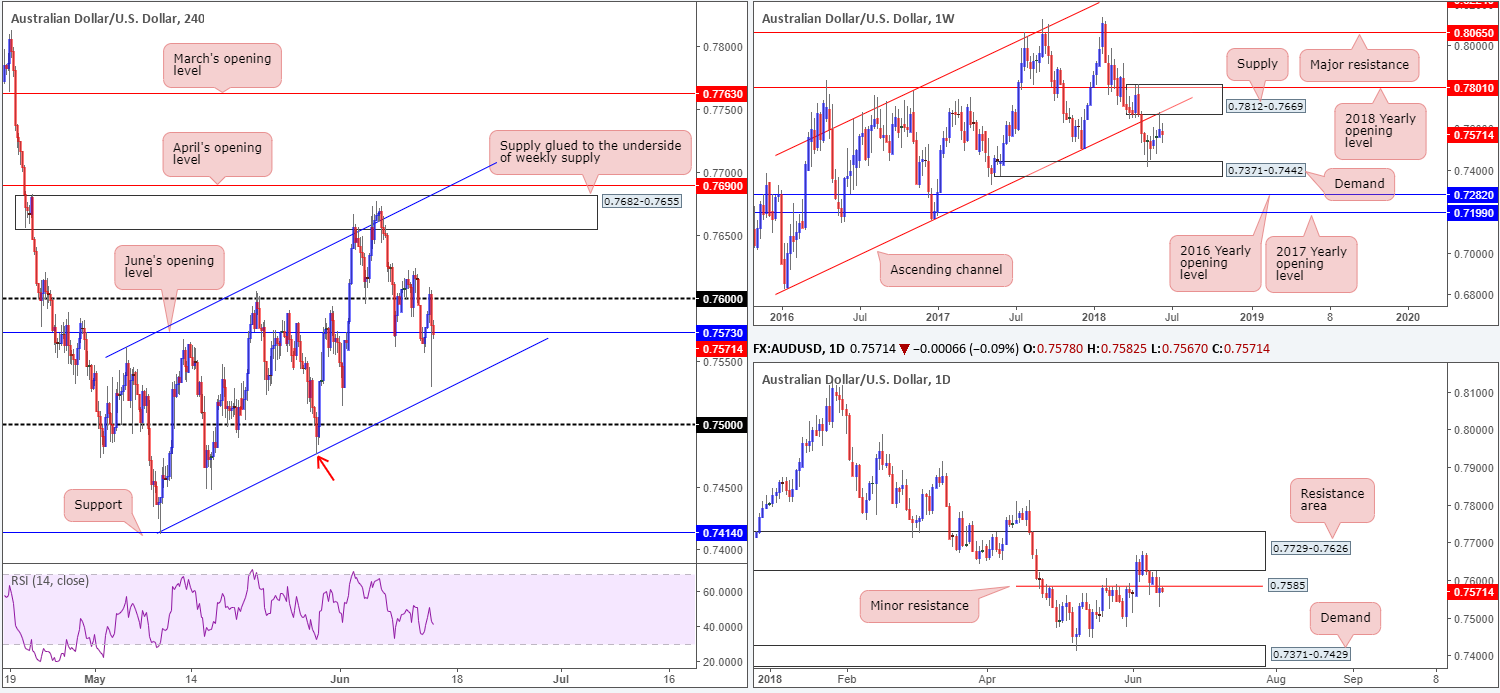
AUD/USD:
The AUD/USD aggressively charged lower on Wednesday following the Fed’s decision to hike rates by 25 bps. As is evident from the H4 chart, though, the move was short-lived. Price action swiftly recovered and concluded the day back above June’s opening level at 0.7573.
Stop-loss orders beneath June’s opening level, in our opinion, have likely been well and truly obliterated. In consequence, this has likely cleared the path south to a nearby H4 channel support taken from the low 0.7412, followed closely by the 0.75 handle. Further adding to this bearish vibe, we can see that not only is daily price respecting the underside of a minor daily resistance level plotted at 0.7585 (albeit in the shape of a daily indecision candle), weekly movement also shows room to press as far south as weekly demand printed at 0.7371-0.7442.
Areas of consideration:
On account of the above reading, the team believes that sellers have the upper hand at the moment. Ultimately, though, before committing to shorts, we would recommend waiting for a decisive H4 close beyond June’s opening level mentioned above at 0.7573. This – coupled with a retest of this number as resistance – would, in our technical opinion, be enough to suggest selling this market, targeting noted H4 channel support and the 0.75 handle as initial take-profit zones. A break beyond this psychological boundary has the May 30 low to target at 0.7476 (red arrow).
Today’s data points: Australian job’s data; China’s industrial production y/y; US retail sales m/m; US weekly unemployment claims.
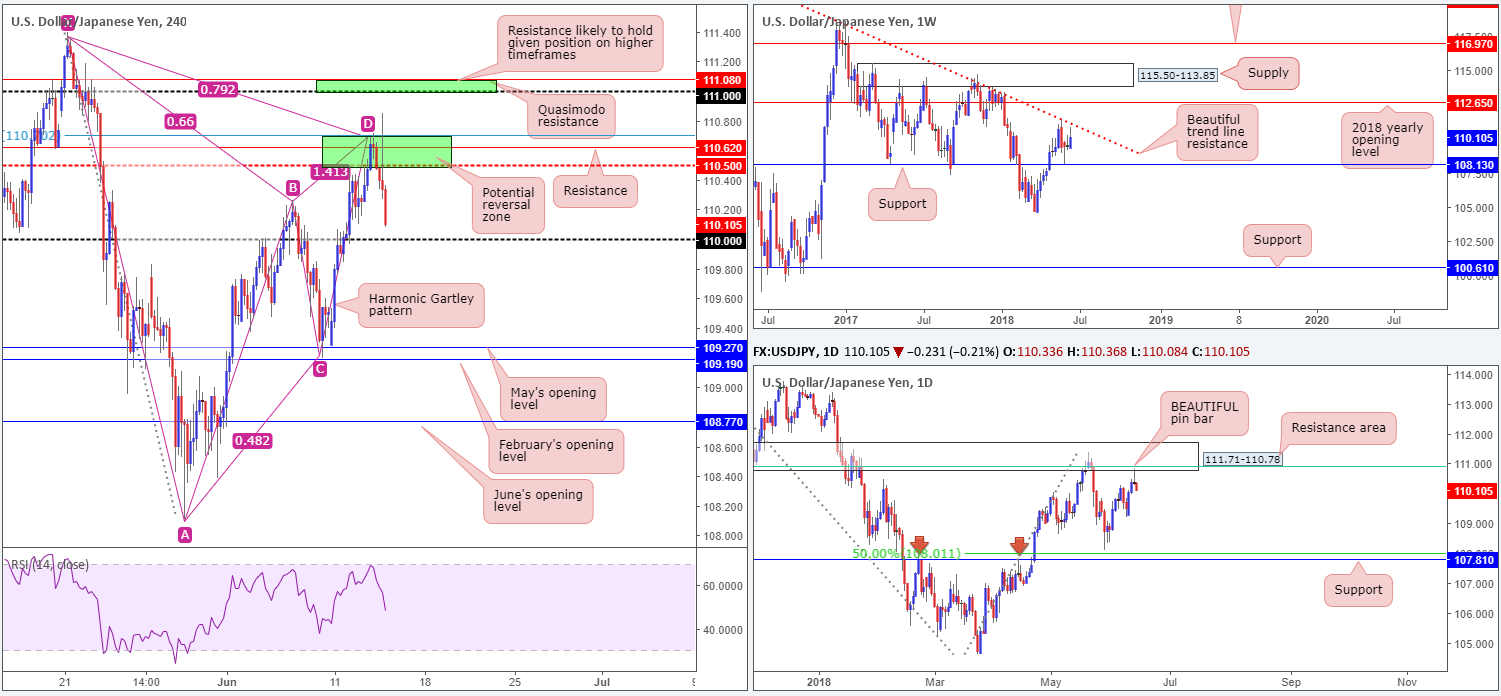
USD/JPY:
For those who read Wednesday’s briefing you may recall that the team highlighted the H4 mid-level resistance at 110.50 as a particularly important level. Not only is it positioned nearby a H4 resistance level at 110.62, it also forms part of a H4 harmonic Gartley completion point: 78.6% H4 Fib resistance at 110.70 (lower green zone). Despite a brief spike to highs of 110.84 on the back of the FOMC hiking rates, the 110.72/110.50 green H4 zone has held firm, with H4 action appearing poised to challenge the 110 handle, as we write.
Supporting downside in this market is the fact that yesterday’s push to highs brought in a daily resistance area planted at 111.71-110.78 in the shape of a beautiful bearish pin-bar formation. Not only does this area fuse with a 61.8% daily Fib resistance value at 110.91 (green line), it also converges nicely with a weekly trend line resistance taken from the high 123.67.
Areas of consideration:
Those who are currently short from 110.72/110.50 on the H4 timeframe, we would recommend looking to begin reducing risk once/if price shakes hands with 110. A decisive close beyond this number, however, would, in our view, be enough evidence to then reduce risk to breakeven and target May’s opening level at 109.27 as the initial take-profit zone.
For folks who missed the initial short, waiting for H4 price to close beneath 110 is an option. A retest to the underside of this number that closes bearishly would likely be enough confirmation to permit a short, with an initial target objective set at 109.27.
Today’s data points: US retail sales m/m; US weekly unemployment claims.
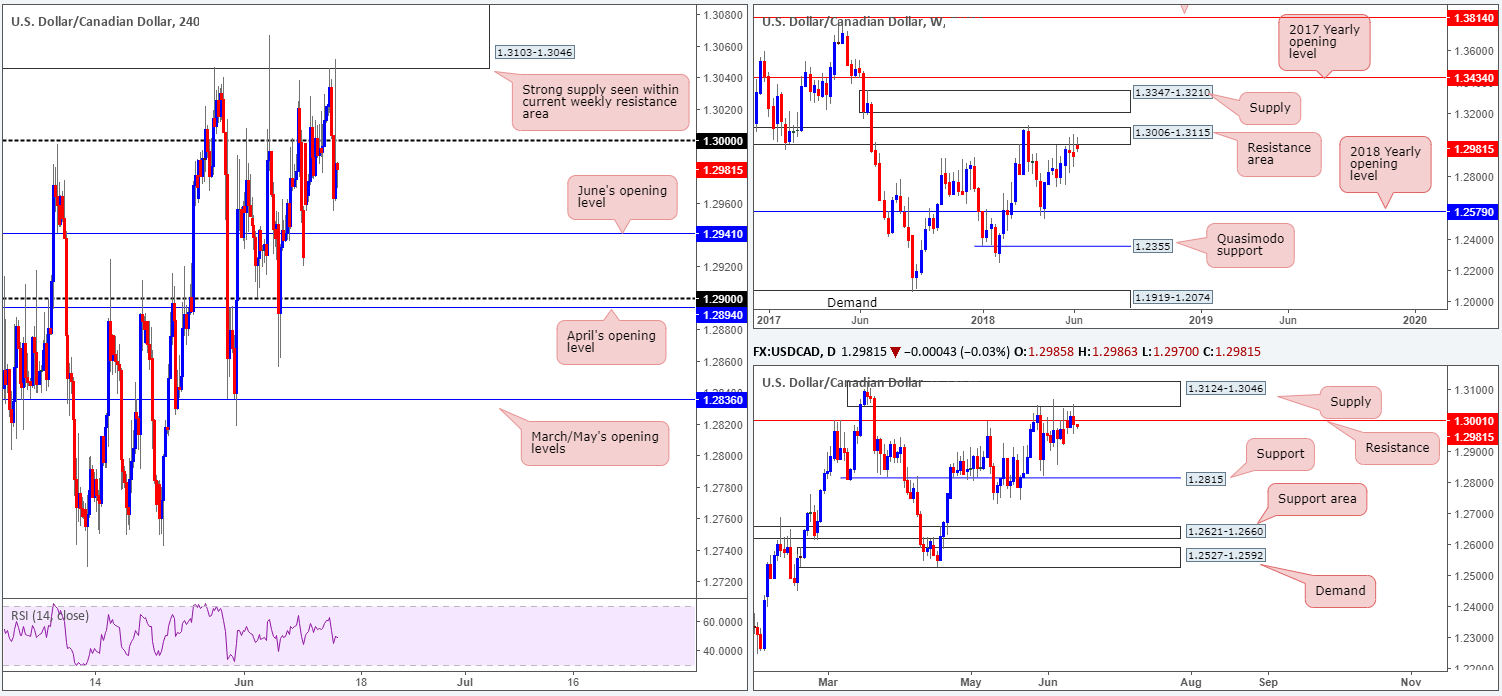
USD/CAD:
As noted in Wednesday’s report, the team underscored the H4 supply zone at 1.3103-1.3046 as a possible sell zone. Well done to any of our readers who managed to catch this move as price sold off from this area beautifully, and closed back beneath the key figure 1.30 into the close. The next port of call on the H4 scale can be seen at June’s opening level drawn from 1.2941. A move beyond this region will draw the 1.29 handle back into focus.
Yesterday’s move should not really come as much of a surprise, given the bedrock of support seen bolstering the current H4 supply. Seen positioned within the walls of a weekly resistance area at 1.3006-1.3115, and also glued to the underside of a daily supply area at 1.3124-1.3046, both timeframes display room to stretch lower. The closest neighboring support target on the higher timeframes falls in at daily support drawn from 1.2815.
Areas of consideration:
For those who are currently short, reducing risk to breakeven is certainly an option now. Taking partial profits off June’s opening level at 1.2941/1.29 handle is also an option, assuming price action dips this low. Ultimately, though, we would be looking to hang on to this trade with the expectation of daily price connecting with support mentioned above at 1.2815, using H4 structure as a guide for trailing.
For folks who missed the initial short, waiting for H4 price to retest the underside of 1.30 may be something you want to consider. A retest of 1.30 in the shape of a full or near-full-bodied H4 bearish candle would, in our technical view, be enough evidence to suggest lower prices (stops best placed above the rejection candle’s wick).
Today’s data points: US retail sales m/m; US weekly unemployment claims; CAD NHPI m/m.
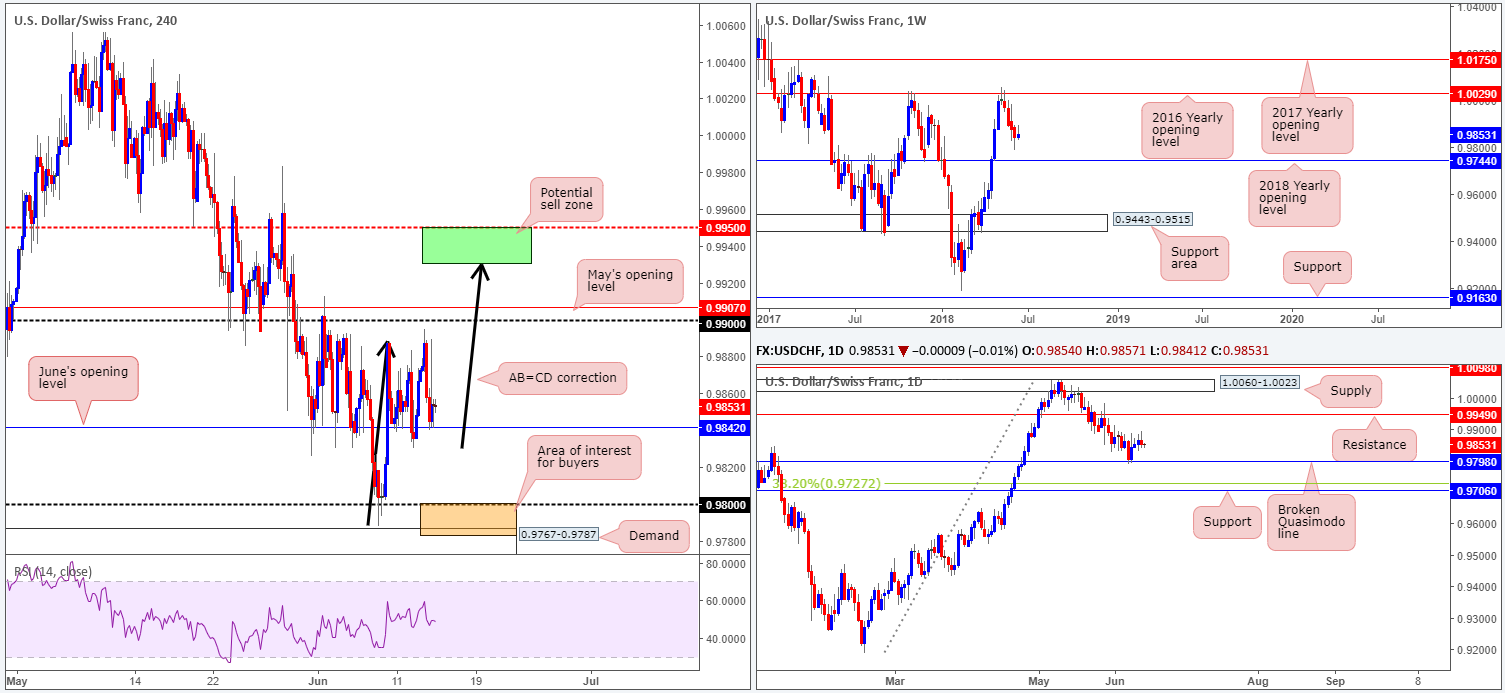
USD/CHF:
Going into the early hours of London trade on Wednesday, the USD/CHF encountered strong selling just south of the 0.99 handle. This prompted a return to June’s opening level seen on the H4 timeframe at 0.9842, which held ground. USD/CHF bulls once again went on the offensive amid US trade on the back of the FOMC’s recent decision to hike rates. However, the move was short-lived, topping at highs of 0.9889.
Turning the focus over to the higher timeframes, we can see that weekly price continues to air a bearish vibe since topping out around the 2016 yearly opening level at 1.0029, as price appears poised to connect with the 2018 yearly opening level at 0.9744. A little lower on the curve, however, daily price is currently holding firm at daily support drawn from 0.9798, with the possibility of further buying being seen up to daily resistance coming in at 0.9949.
Areas of consideration:
Areas of interest for sellers today remain the same as advertised in Wednesday’s report: the 0.99 handle given its connection with May’s opening level at 0.9907 (H4), and the area marked in green on the H4 timeframe between 0.9950 (essentially representing daily resistance at 0.9949) and the H4 AB=CD correction (black arrows) terminating at around the 0.9930 mark.
A H4 close beyond the 0.9842 level, on the other hand, will place the 0.98 handle back in view, alongside its closely positioned H4 demand at 0.9767-0.9787 (orange area). These areas are likely of interest to buyers owing to its convergence with daily support mentioned above at 0.9798.
Today’s data points: US retail sales m/m; US weekly unemployment claims.
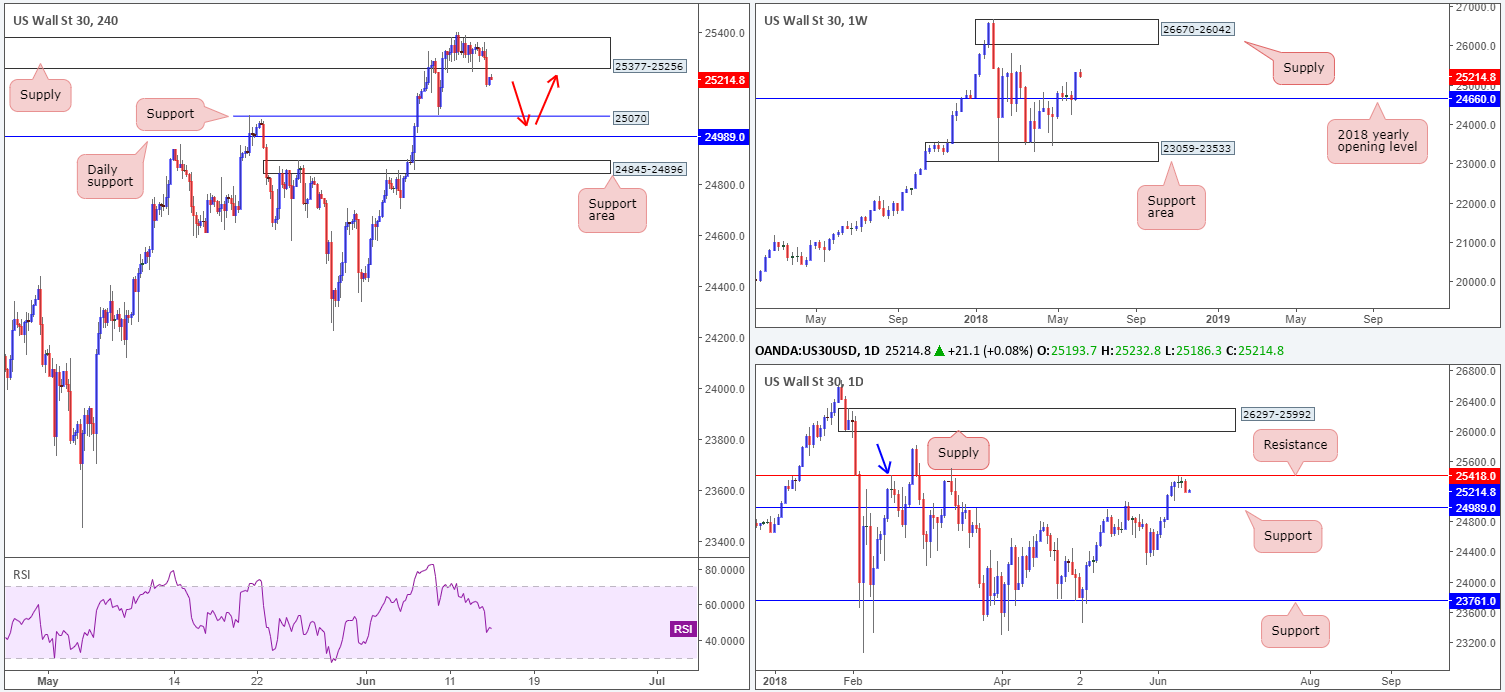
Dow Jones Industrial Average:
US stocks momentarily spiked to highs of 25332 on Wednesday in the immediate aftermath of the FOMC’s decision to hike interest rates by 25 bps. This was swiftly followed by a bout of aggressive selling from within the walls of a H4 supply zone chiseled in at 25377-25256. Neighboring support can be seen at 25070, which already proved its worth back on June 8.
What’s also notable from a technical perspective is that directly beneath the aforementioned H4 support level, there’s a daily support level seen at 24989, shadowed closely by a H4 support area priced in at 24845-24896. Contrary to H4 and daily action showing room to probe lower, weekly movement demonstrates little resistance ahead until we reach weekly supply drawn from 26670-26042, following a solid round of buying seen last week off of the 2018 yearly opening level at 24660.
Areas of consideration:
In light of recent trade, we feel H4 support mentioned above at 25070 may be brought into play today, with the possibility of a fakeout being seen through this level to the aforementioned daily support level. To our way of seeing things, this is a reasonably solid buying opportunity with upside targets positioned at the noted H4 supply, followed by daily resistance plotted at 25418.
Today’s data points: US retail sales m/m; US weekly unemployment claims.
XAU/USD (Gold)
Given the lackluster performance seen yesterday, much of the following report echoes Wednesday’s outlook.
Despite FOMC-induced movement amid trade on Wednesday, the price of gold continues to echo a somewhat range-bound environment.
As demonstrated on the H4 timeframe, the daily resistance area at 1301.6-1307.5 continues to cap upside in this market, supporting a week-long H4 consolidation seen below it between 1301.0/1294.0. Despite this, the team remains supportive of a lower low taking place on the H4 scale (a break of the swing low 1285.8). As mentioned in several reports prior, this expectation will only be discounted on a H4 close above the clear lower high seen on the H4 timeframe at 1307.7.
Turning the focus over to the bigger picture, the price of gold remains tightly confined between the 2018 yearly opening level on the weekly timeframe at 1302.5 and the lower edge of a weekly bullish flag formation taken from the low 1346.1. A break lower may set the stage for a test of 1260.8: a weekly Quasimodo support, whereas a move above 1302.5 may see weekly price head for the opposite end of the current weekly flag extended from the high 1366.0.
Moving down to the daily timeframe, we are able to see that price action remains sandwiched between the aforementioned daily resistance area and a daily support level drawn in from 1289.4. Beyond this area, surrounding structures are seen at daily supply penciled in from 1332.6-1322.2, and daily support at 1267.5.
Areas of consideration:
As the expectation is for a lower low to form on the H4 timeframe, we still feel shorts at current price are worthy of consideration, with stop-loss orders placed above the clear lower high on the H4 timeframe at 1307.7. Reducing risk to breakeven and taking partial profits off the table on a test of lows at 1281.8 is recommended.

The use of the site is agreement that the site is for informational and educational purposes only and does not constitute advice in any form in the furtherance of any trade or trading decisions.
The accuracy, completeness and timeliness of the information contained on this site cannot be guaranteed. IC Markets does not warranty, guarantee or make any representations, or assume any liability with regard to financial results based on the use of the information in the site.
News, views, opinions, recommendations and other information obtained from sources outside of www.icmarkets.com.au, used in this site are believed to be reliable, but we cannot guarantee their accuracy or completeness. All such information is subject to change at any time without notice. IC Markets assumes no responsibility for the content of any linked site. The fact that such links may exist does not indicate approval or endorsement of any material contained on any linked site.
IC Markets is not liable for any harm caused by the transmission, through accessing the services or information on this site, of a computer virus, or other computer code or programming device that might be used to access, delete, damage, disable, disrupt or otherwise impede in any manner, the operation of the site or of any user’s software, hardware, data or property.


