A note on lower timeframe confirming price action…
Waiting for lower timeframe confirmation is our main tool to confirm strength within higher timeframe zones, and has really been the key to our trading success. It takes a little time to understand the subtle nuances, however, as each trade is never the same, but once you master the rhythm so to speak, you will be saved from countless unnecessary losing trades. The following is a list of what we look for:
- A break/retest of supply or demand dependent on which way you’re trading.
- A trendline break/retest.
- Buying/selling tails/wicks – essentially we look for a cluster of very obvious spikes off of lower timeframe support and resistance levels within the higher timeframe zone.
- Candlestick patterns. We tend to only stick with pin bars and engulfing bars as these have proven to be the most effective.
We search for lower timeframe confirmation between the M15 and H1 timeframes, since most of our higher-timeframe areas begin with the H4. Stops are usually placed 5-10 pips beyond confirming structures.
EUR/USD:
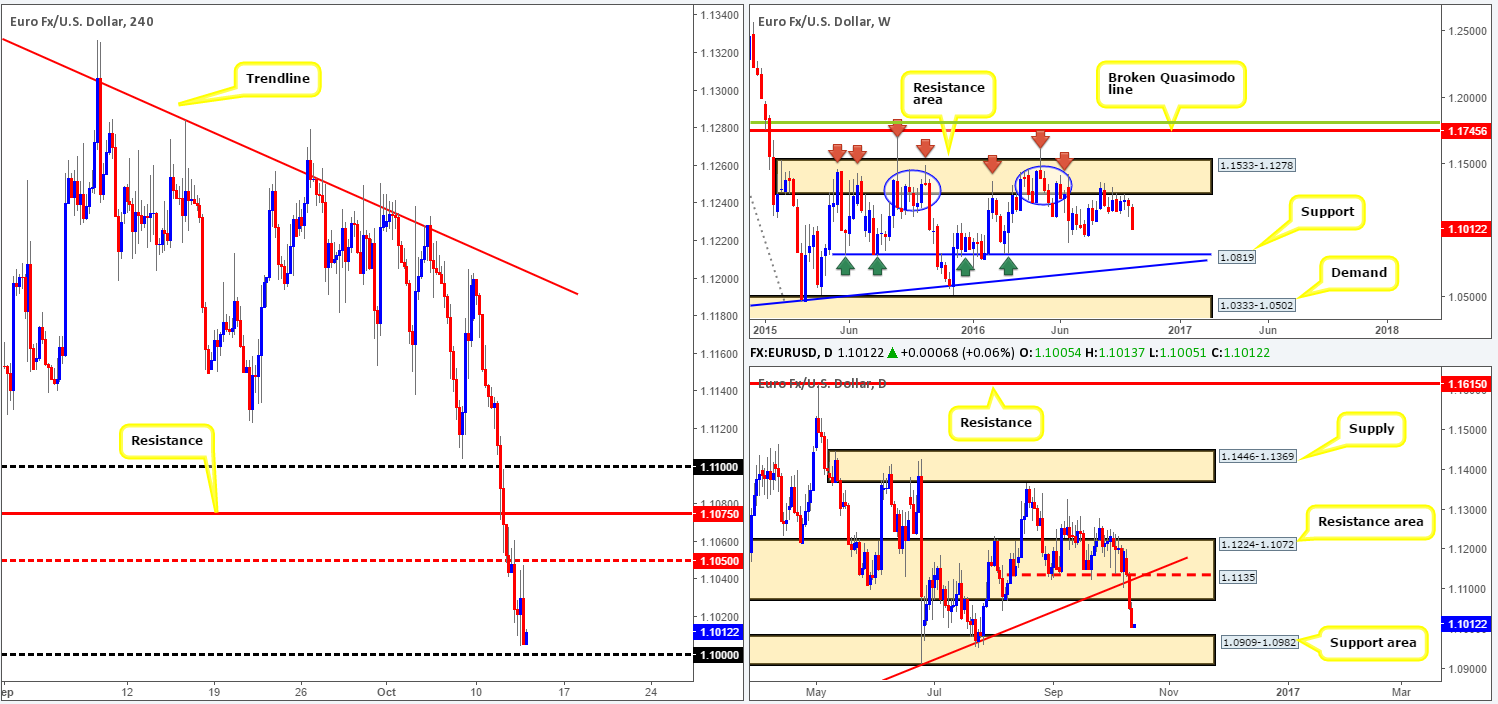
The EUR, as you can see, continued to sag against its US counterpart yesterday, consequently taking out the H4 mid-way support 1.1050 and closing the day just ahead of the key figure 1.10. Apart from one occasion on the 7th Oct, the dollar has been unstoppable since the 3rd Oct, as growing expectations of a rate hike by the year end increase post FOMC yesterday. From the technical side of things, however, the shared currency is now seen trading not only within reaching distance of the 1.10 handle, but also a key daily support area seen at 1.0909-1.0982 and ‘minor’ support seen on the weekly chart at 1.0970 .
Our suggestions: Although the market has been in a free-fall since the week’s open, we feel a correction may be on the horizon between 1.0970/1.10. This area, as you can see, comprises of the 1.10 hurdle and both the aforementioned ‘minor’ weekly support and top edge of daily demand. To avoid potentially ‘catching a falling knife’ we would only consider 1.0970/1.10 a suitable buy zone should the H4 chalk up a bullish close off of this area. Only then would we look to buy the EUR and target 1.1050 as a first take-profit target.
On the data front today, keep an eye on the US weekly jobless claims report set to be released at 12.30pm GMT.
Levels to watch/live orders:
- Buys: 1.0970/1.10 region ([H4 bullish close required prior to pulling the trigger here] Stop loss: beyond the trigger candle).
- Sells: Flat (Stop loss: N/A).
GBP/USD:
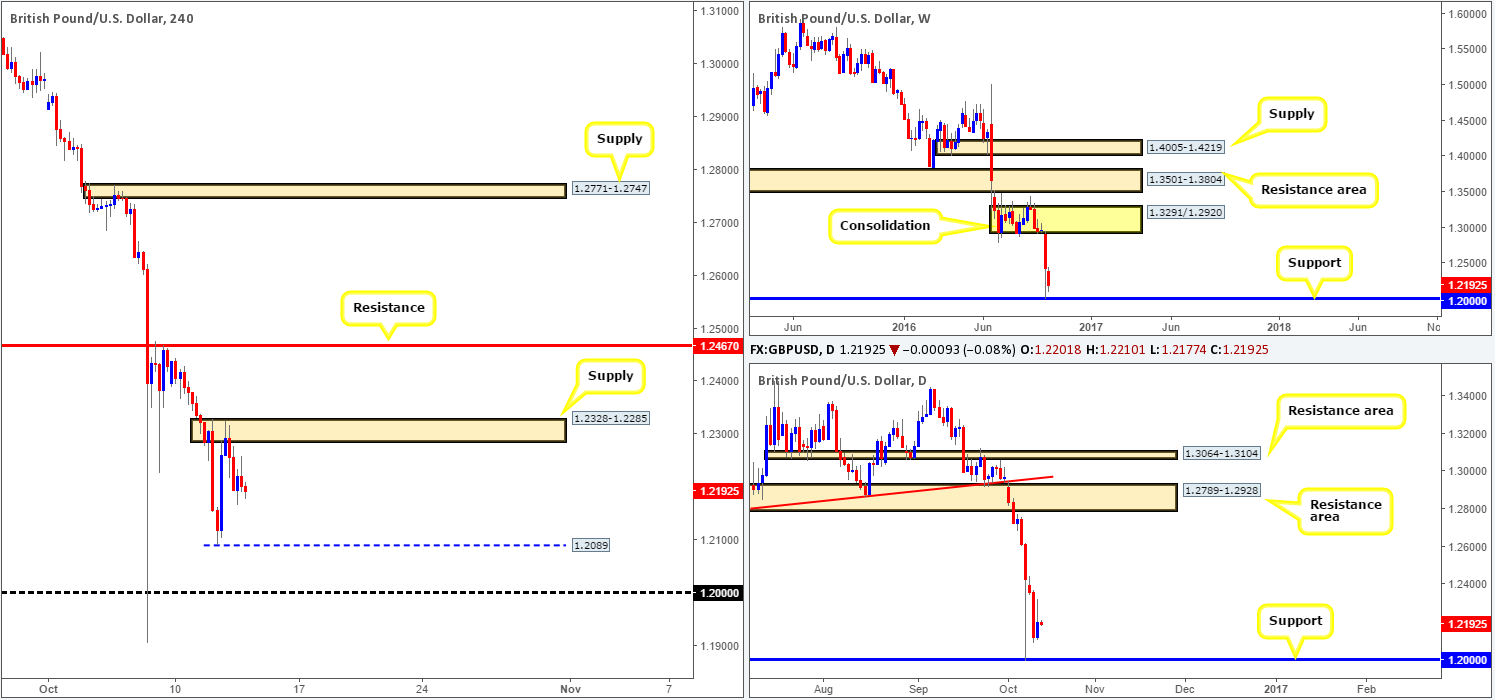
Tuesday’s recent advance from lows of 1.2089, as can be seen from the H4 chart, quickly found resistance around a supply zone coming in at 1.2328-1.2285, and has since posted lows of 1.2165. From our point of view, the technicals, as well as the fundamentals all point to further downside in the weeks to come. While there could be some support seen from Tuesday’s low, we feel that the pair will likely reach 1.20 in the not so distant future.
As far as selling this unit goes, here’s what we have jotted down so far:
- A second retest of the above mentioned H4 supply. This – coupled with a reasonably sized H4 bear candle would, at least in our opinion, be sufficient enough to permit a short from here, targeting Tuesday’s low 1.2089, followed by the 1.20 neighborhood.
- A close below and retest of 1.2089 could also be a scenario to consider. However, we would require some form of lower timeframe confirmation following the retest (see the top of this report) prior to pulling the trigger here to avoid any whipsaws through the level.
Levels to watch/live orders:
- Buys: Flat (Stop loss: N/A).
- Sells: 1.2328-1.2285 ([H4 bearish candle required prior to pulling the trigger] Stop loss: beyond the trigger candle, however, the safest location would be beyond the supply itself around the 1.2330ish area). Watch for a close below 1.2089 and look to trade any retest seen thereafter ([lower timeframe confirmation required] Stop loss: dependent on where one confirms this level).
AUD/USD:
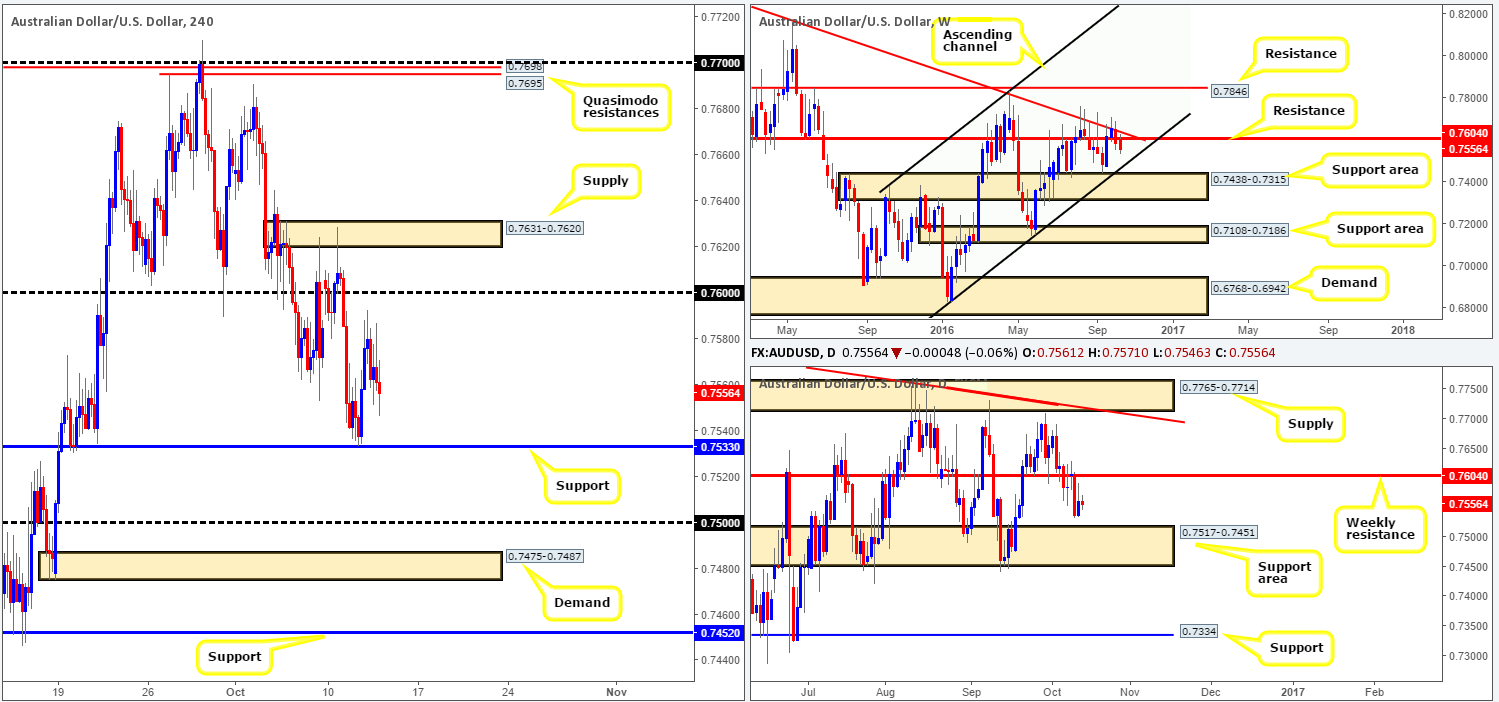
From a technical standpoint, the Aussie dollar is in a little bit of a predicament. While the weekly candles show room to continue selling off down to an ascending channel support line extended from the low 0.6827, daily action suggests avoiding shorts for the time being due to a nearby support area at 0.7517-0.7451. In addition to this daily structure, the H4 has a support level chalked up at 0.7533 (sits just above the aforementioned daily support zone), which held prices higher on Tuesday.
Therefore, if one were to wait for a close beyond this H4 support in an attempt to sell alongside weekly flow, you’d have, as we highlighted in yesterday’s report, only 30 or so pips to play with before reaching the 0.75 handle on the H4 chart, and even less on the daily chart to the top edge of the support area at 0.7517!
Our suggestions: In view of the rather cramped price action we’re seeing at the moment, our team’s position will remain flat going into today’s sessions.
Levels to watch/live orders:
- Buys: Flat (Stop loss: N/A).
- Sells: Flat (Stop loss: N/A).
USD/JPY:
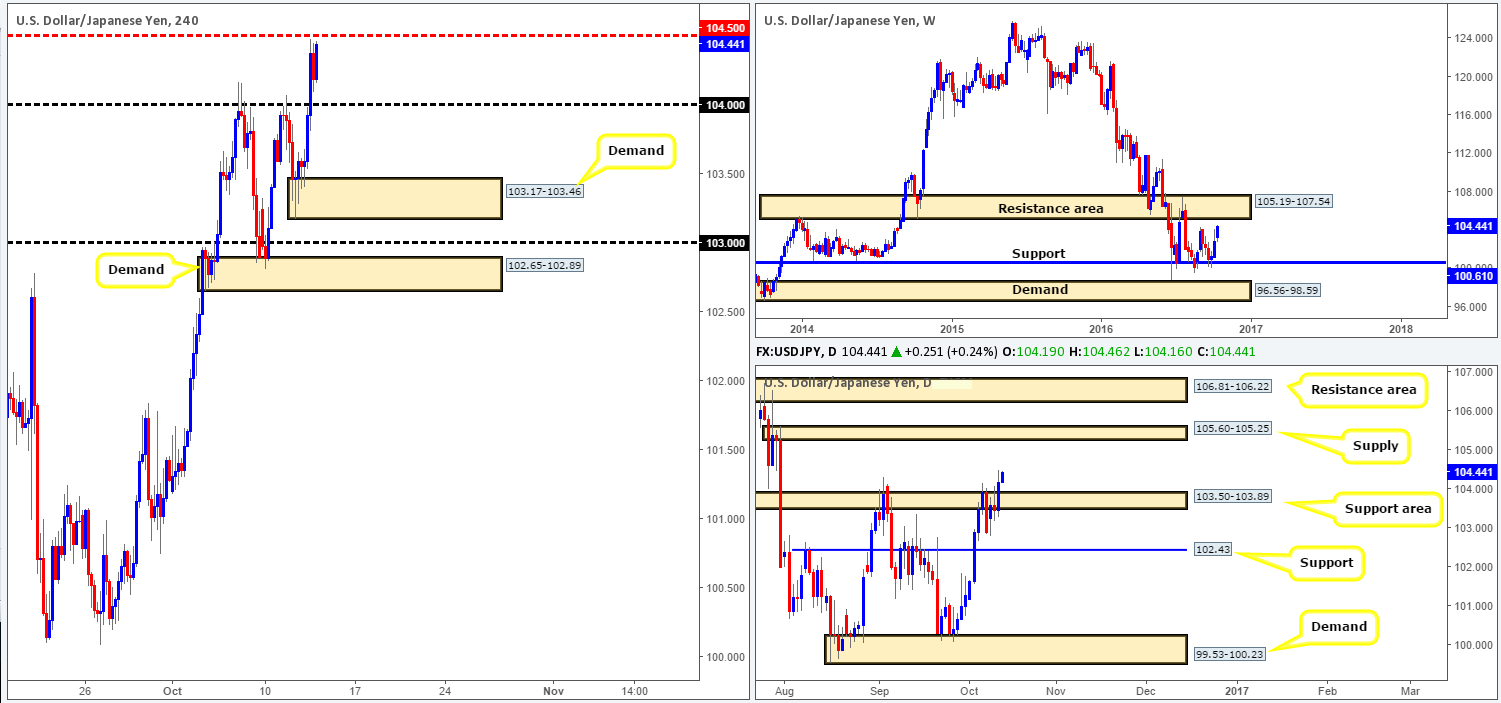
Using a top-down approach this morning, we can see that the weekly candle recently breached highs chalked up on the 29/08 around the 104.32ish range, and looks to be on course to collide with a resistance area seen at 105.19-107.54. Along the same vein, on the daily chart price closed above a resistance area coming in at 103.50-103.89 (now acting support), which has likely opened up the doors for the pair to shake hands with supply seen at 105.60-105.25 (housed within the above said weekly resistance area).
Stepping across to the H4 chart, FOMC action saw little response in this market as prices topped out just ahead of the mid-way resistance 104.50. Selling from this number is not something our team would advise given the strength of the dollar and the higher-timeframe structures on this pair.
Our suggestions: Put simply, wait for a close to be seen above 104.50 and look to trade any retest off this number, targeting the 105/105.25ish region. Given that there is not much room to play with here, we will look to enter on the lower timeframes following the retest of 104.50 (see the top of this report for lower timeframe entry techniques). This could potentially get one in at a better price and increase risk/reward.
Levels to watch/live orders:
- Buys: Watch for a close above 104.50 and look to trade any retest seen thereafter ([lower timeframe confirmation required] Stop loss: dependent on where one confirms this level).
- Sells: Flat (Stop loss: N/A).
USD/CAD:
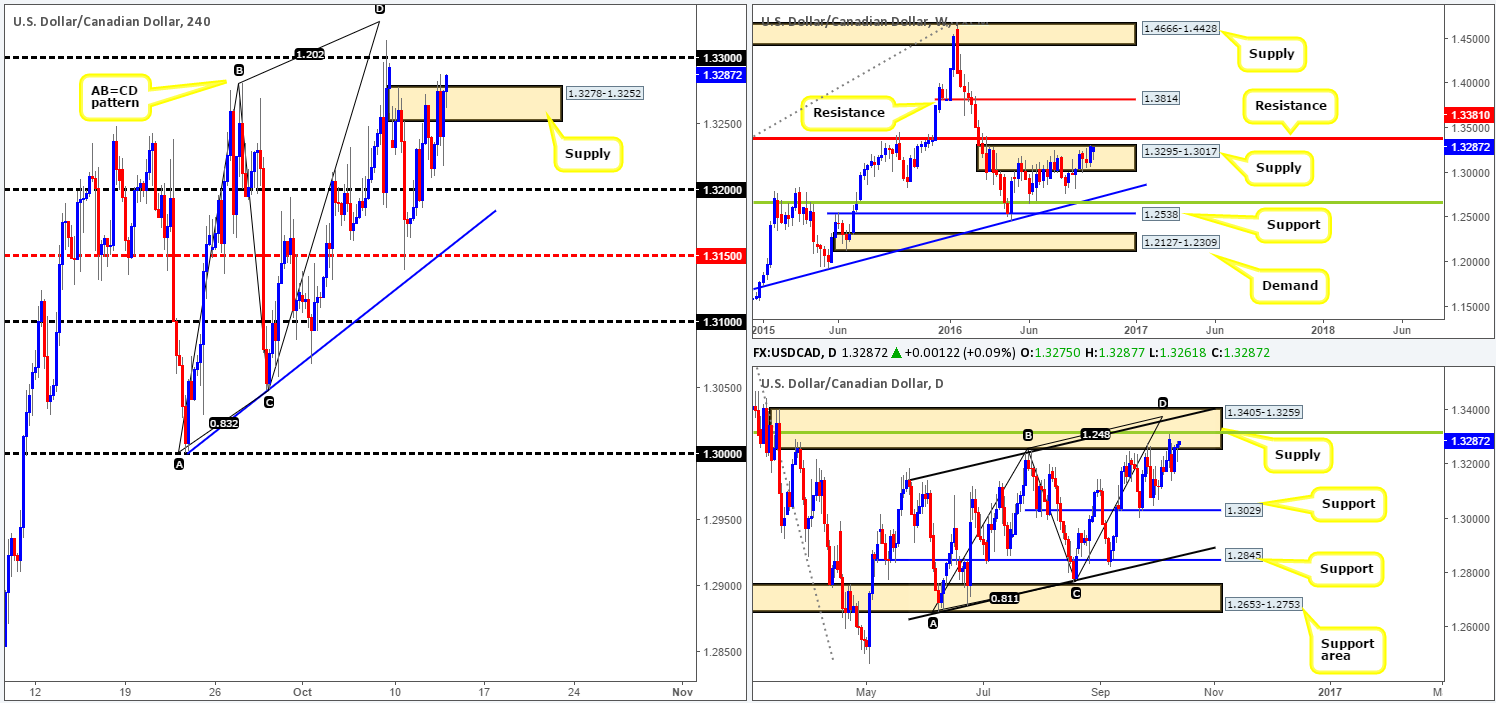
This pair warrants particular attention. As of now, H4 price is trading around the top edge of a supply area coming in at 1.3278-1.3252, which sits directly below the 1.33 handle. Seeing as how both the daily and weekly candles are trading within supply (1.3405-1.3259/1.3295-1.3017) price could effectively selloff at any time from this point. Be that as it may, there is, as we’ve mentioned countless times in the past, a daily convergence point lurking within the current daily supply which comprises of: a 38.2% Fib resistance level at 1.3315 (green line), the weekly resistance level mentioned above at 1.3381, a channel resistance taken from the high 1.3241 and an AB=CD completion point around the 1.3376ish range.
Our suggestions: In view of the above points, we would not recommend selling the 1.33 handle. Instead, we remain attracted to the 1.3315ish region. Not only does this area boast a truckload of daily/weekly confluence (see above) and a H4 AB=CD bearish completion point (1.3328), it also allows one to place their stops above the current daily supply! As a result, our team still has a pending sell order set at 1.3315 and a stop placed above at 1.3407.
Levels to watch/live orders:
- Buys: Flat (Stop loss: N/A).
- Sells: 1.3315 ([pending order] Stop loss: 1.3407).
USD/CHF:
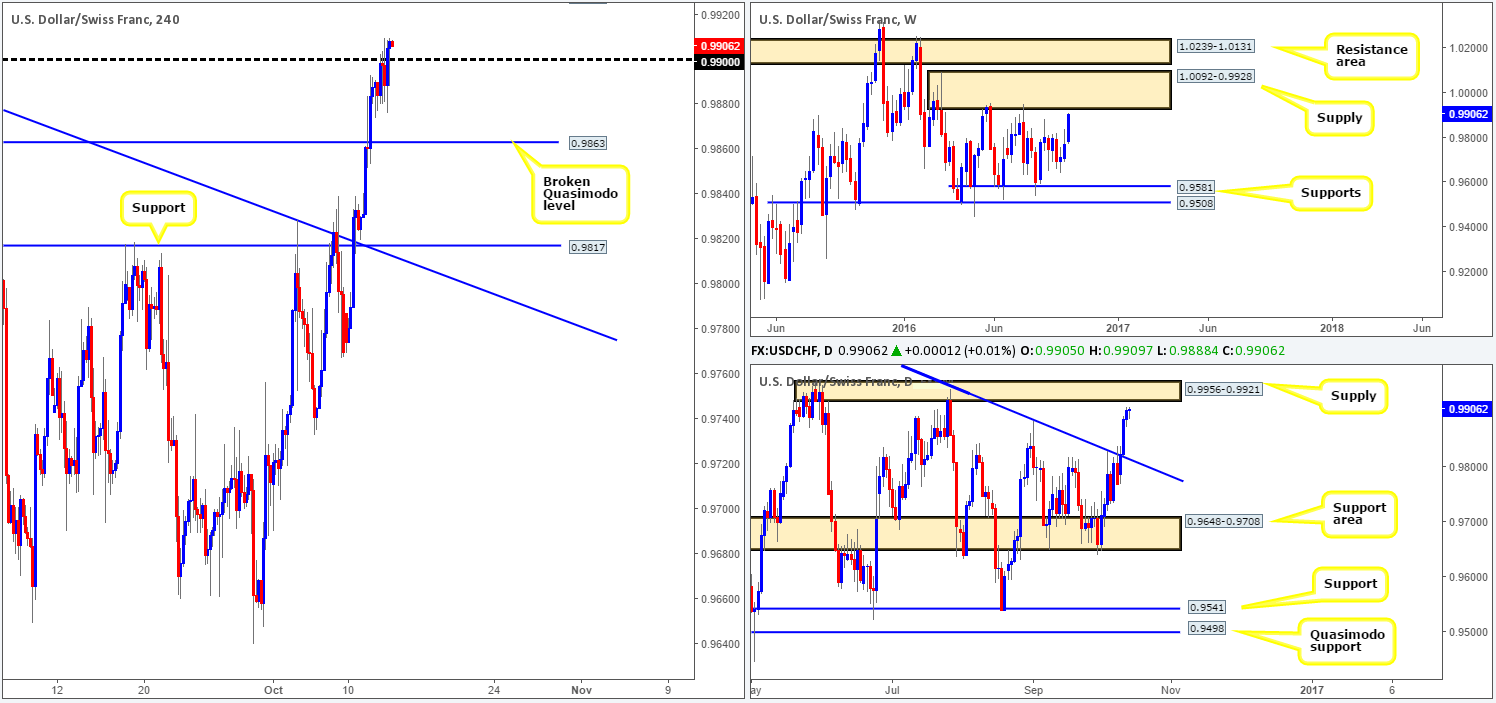
During the course of yesterday’s trading, the USD/CHF tagged the underside of the 0.99 handle and eventually pushed through these offers amid the US afternoon session. By and of itself, this is considered a bullish cue which will likely attract buyers into the market. While H4 traders are looking to buy, however, our team is looking to sell around the 0.9927 region: a H4 Quasimodo resistance (not seen on the chart).
Our rationale behind this approach stems from the higher-timeframe structures. Weekly action looks set to connect with supply coming in at 1.0092-0.9928, which has managed to cap upside in this market since mid-May 2016. In addition to this, the daily candles are currently en route to the supply seen at 0.9956-0.9921 that is glued to the underside of the aforementioned weekly supply area.
Our suggestions: Due to its connection with the higher-timeframe supplies, the aforementioned H4 Quasimodo resistance level is a high-probability sell zone. We would, dependent on the time of day, look to short from here at market with stops placed above the apex of the Quasimodo formation (0.9950) at 0.9955, targeting 0.99 as a first take-profit hurdle.
Levels to watch/live orders:
- Buys: Flat (Stop loss: N/A).
- Sells: 0.9927 ([possible area to short from at market] Stop loss: 0.9955).
DOW 30:
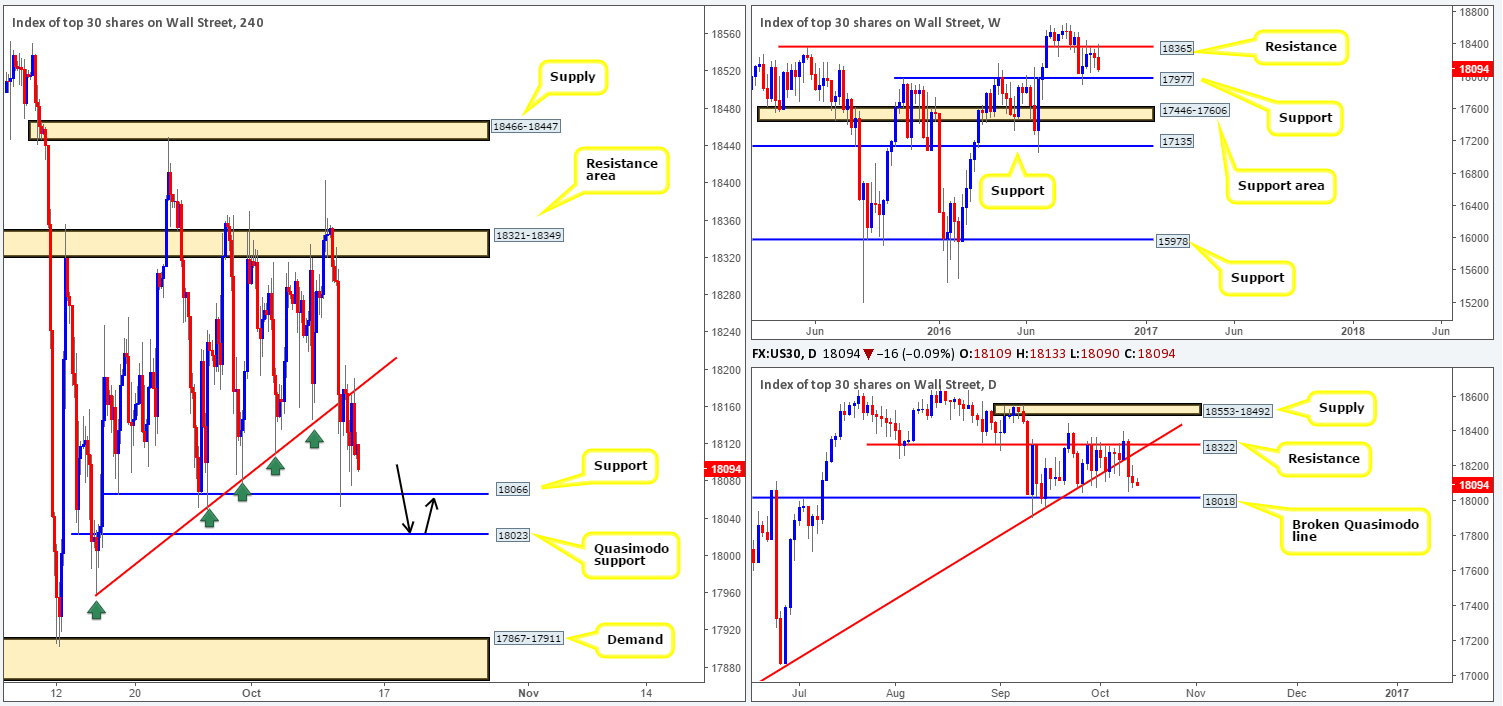
As of Thursday morning, the technical story shows that the H4 candles retested the underside of a recently broken H4 trendline support taken from the low 17959 and held firm. With the next area of support being seen at 18066, where does our team go from here? Well, with weekly price looking at though it wants to plug into support at 17977, and daily flow trading just ahead of a broken Quasimodo line at 18018, we would not be comfortable buying from the current H4 support boundary.
Our suggestions: As we mentioned in Wednesday’s report, the only area that continues to catch our eye is the H4 Quasimodo support level at 18023 for buys. The line sits just above a daily broken Quasimodo hurdle at 18018 and is also positioned nearby the current weekly support level. In light of how fresh the H4 Quasimodo is and its connection with the higher-timeframe supports, we will, dependent on the time of day and H4 approach, look to enter at market from this perimeter, with stops placed below the apex of this formation at 17953.
Levels to watch/live orders:
- Buys: 18024 ([market order] Stop loss: 17953).
- Sells: Flat (Stop loss: N/A).
GOLD:
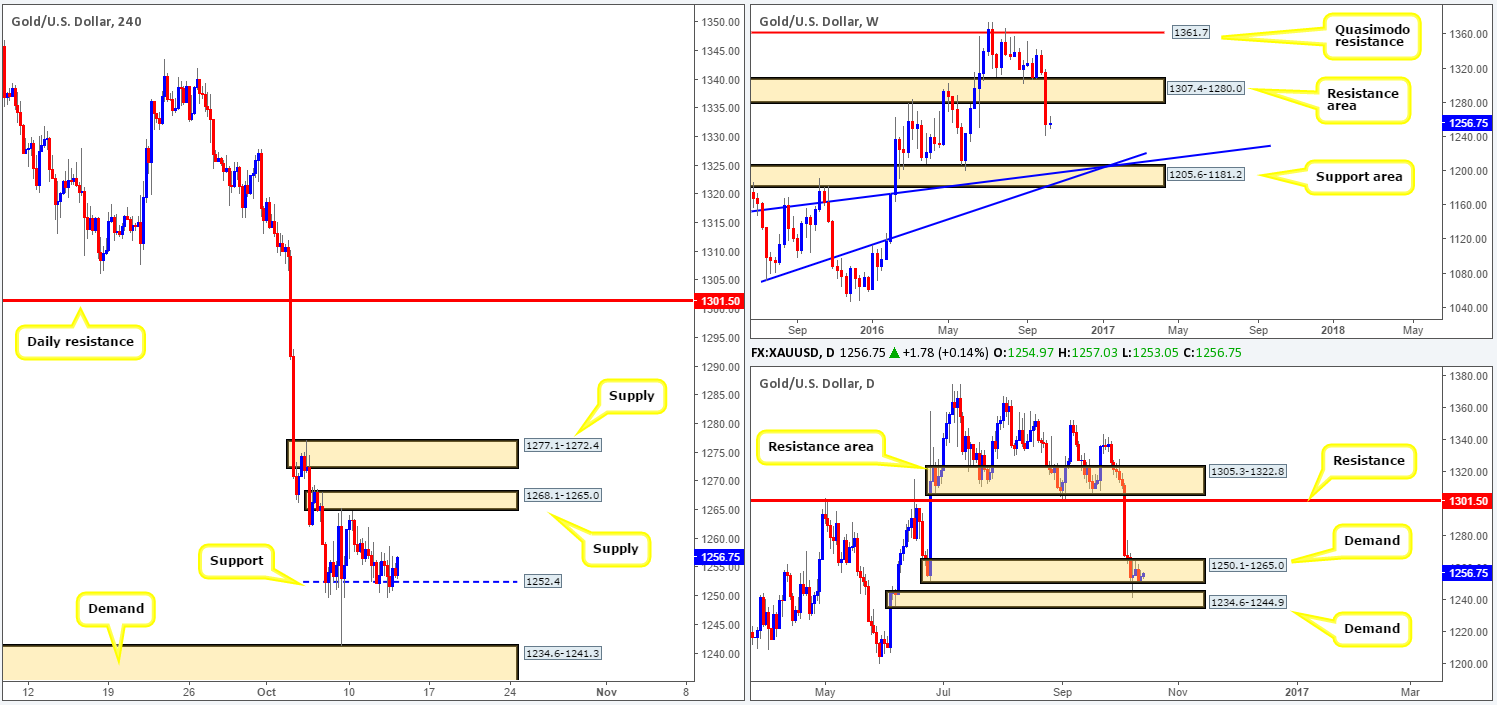
In recent sessions, the gold market has taken on a more lackluster stance, as price bounces off a minor H4 support coming in at 1252.4. As a result of this, much of the following report will echo thoughts put forward in yesterday’s analysis…
A rally from the current minor H4 support would more than likely push the yellow metal back up to H4 supply at 1268.1-1265.0, which held the markets lower on Monday. In contrast, a violation of this H4 support could potentially force price down to test H4 demand at 1234.6-1241.3 that is located deep within daily demand at 1234.6-1244.9.
Over in the bigger picture, the weekly candles took out a support area at 1307.4-1280.0 (now acting resistance) last week, and has possibly set the stage for a continuation move south this week down to the support area logged in at 1205.6-1181.2, which happens to converge nicely with two trendline supports (1130.1/1071.2). Daily price on the other hand, remains trading around demand (1234.6-1244.9/ 1250.1-1265.0).
Our suggestions: While H4 price has the potential to rally from the current minor support, and has the backing of the above said daily demands, we’re wary about buying here due to what we’ve noted on the weekly picture. By the same token, we’re also skeptical regarding shorts beyond the minor H4 support level, since this would effectively mean selling into daily demand!
In the absence of clearer price action, the team has decided to remain flat for the time being.
Levels to watch/live orders:
- Buys: Flat (Stop loss: N/A).
- Sells: Flat (Stop loss: N/A).


