EUR/USD:
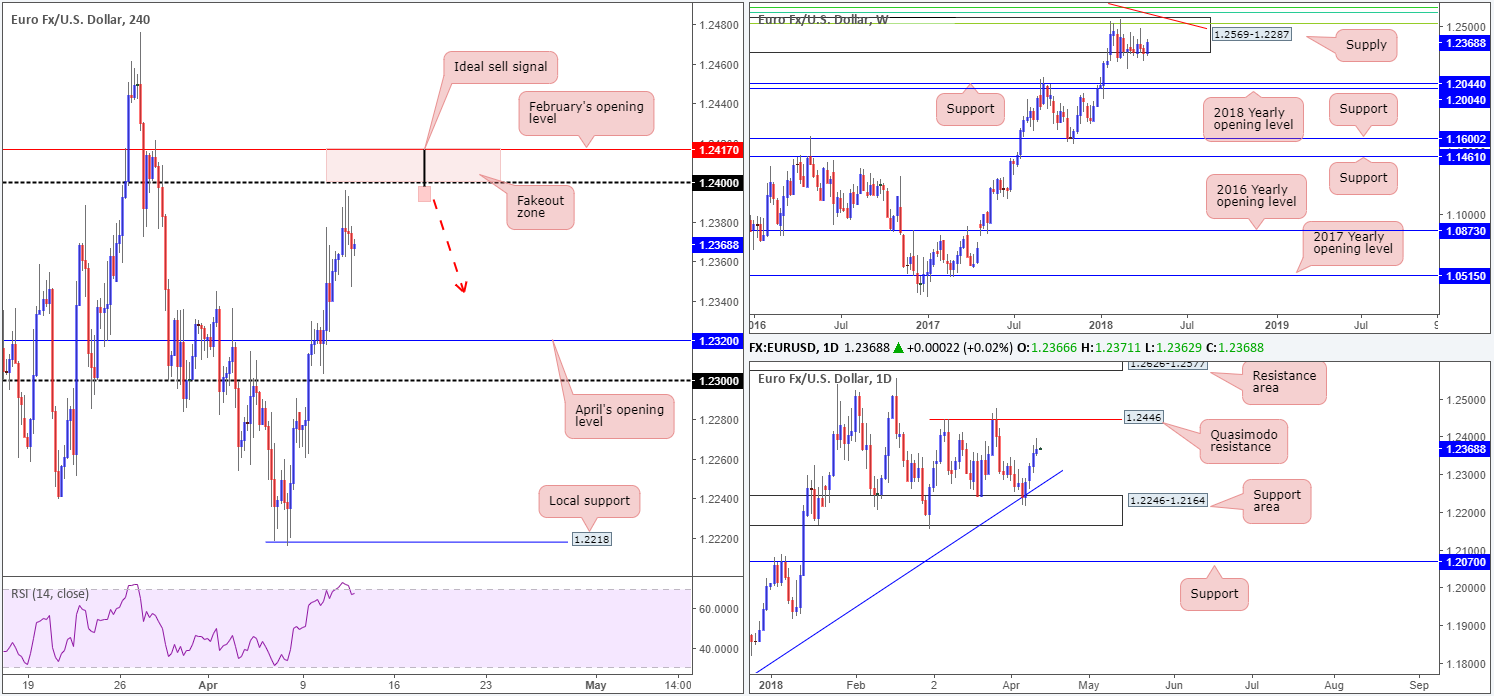
Despite topping just south of the 1.24 handle on the H4 timeframe, which we believe was due to weaker-than-expected US CPI m/m data and a somewhat hawkish FOMC, the euro registered its fourth consecutive daily gain on Wednesday.
Looking at the weekly timeframe this morning, the unit remains captive within the walls of a major-league weekly supply at 1.2569-1.2287. Daily action, as far as we can see, is on track to challenge a daily Quasimodo resistance plotted at 1.2446. H4 price, however, is seen trading in overbought territory (according to the H4 RSI indicator) just ahead of 1.24, which is shadowed closely by February’s opening level at 1.2417.
Potential trading zones:
According to the daily timeframe, further buying could be on the cards until we touch gloves with the aforementioned daily Quasimodo resistance. However, this means going up against potential weekly flow from supply!
Short-term movement, nevertheless, could see the H4 candles trip stop-loss orders above 1.24 and tag in orders sitting at February’s opening level. Psychological levels are notorious for fakeouts! An ideal sell signal, therefore, would be a H4 bearish pin-bar formation (as drawn on the H4 chart). Downside targets from this point fall in around 1.2350 and April’s opening level at 1.2320, followed closely by the 1.23 handle.
Data points to consider today: ECB Monetary Policy Meeting Accounts; German Buba President Weidmann speaks; US unemployment claims.
GBP/USD:
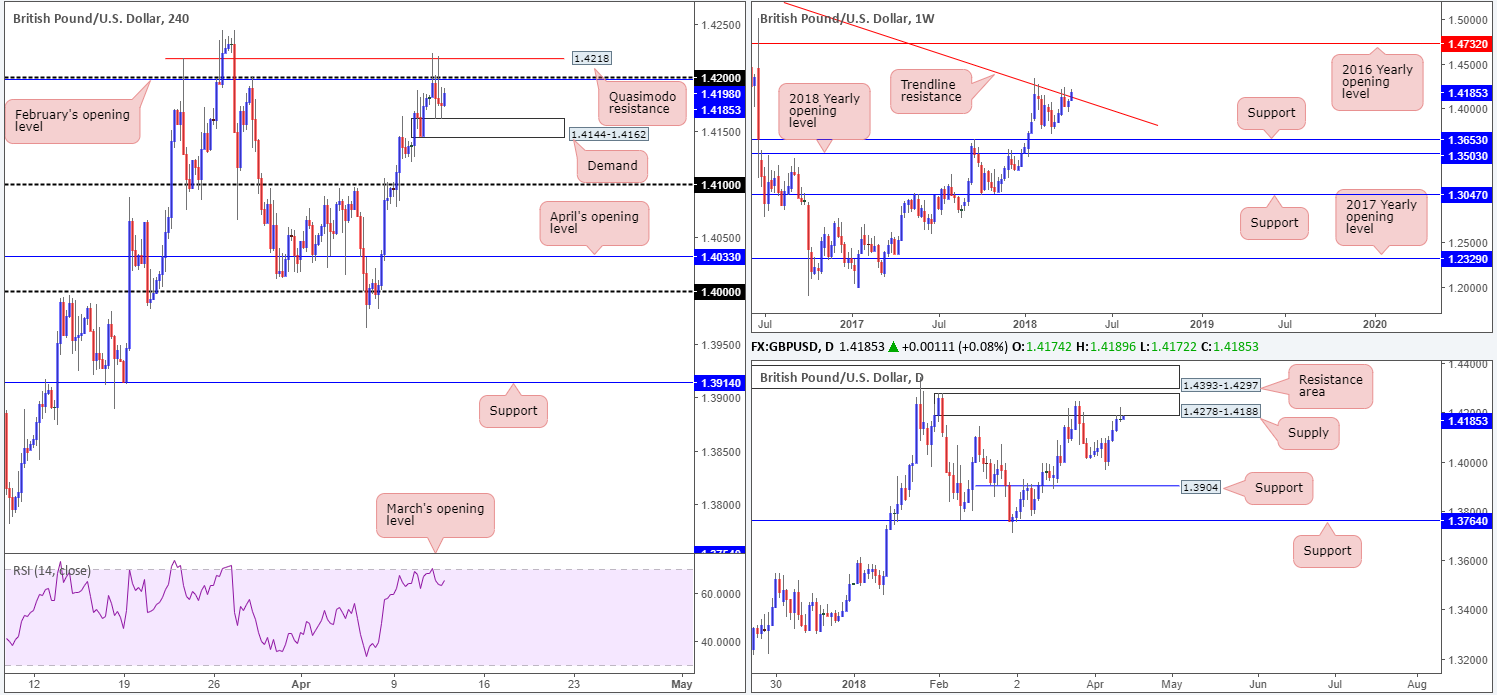
For those who read Wednesday’s report you may recall the team highlighting a potential fakeout play beyond 1.42 into orders sitting around the H4 Quasimodo resistance level at 1.4218. Influenced by lower-than-expected UK manufacturing production m/m and a somewhat hawkish FOMC, the pair behaved as expected. However, it is proving a challenge to press beyond nearby H4 demand at 1.4144-1.4162. A break of this area, technically speaking, would likely confirm further downside and clear the pathway south to the 1.41 neighborhood.
In conjunction with H4 movement, we can also see that daily price recently shook hands with a daily supply zone at 1.4278-1.4188, and printed a nice-looking daily bearish pin-bar formation. Our only concern regarding shorts is the recent bout of buying that’s pressured weekly price marginally above a long-term weekly trend line resistance taken from the high 1.5930. This line has not witnessed a close higher since late 2015!
Potential trading zones:
With H4 RSI teasing the overbought line, along with daily price touching gloves with the lower edge of a daily supply at 1.4188, we believe further (intraday) selling is on the cards, despite the current H4 demand and potentially hazardous weekly trend line resistance.
For those already short from the initial fakeout of 1.42, stop-loss orders would be best moved to breakeven following a H4 close beneath the said H4 demand.
Data points to consider today: MPC member Broadbent speaks; BoE credit conditions survey; US unemployment claims.
AUD/USD:
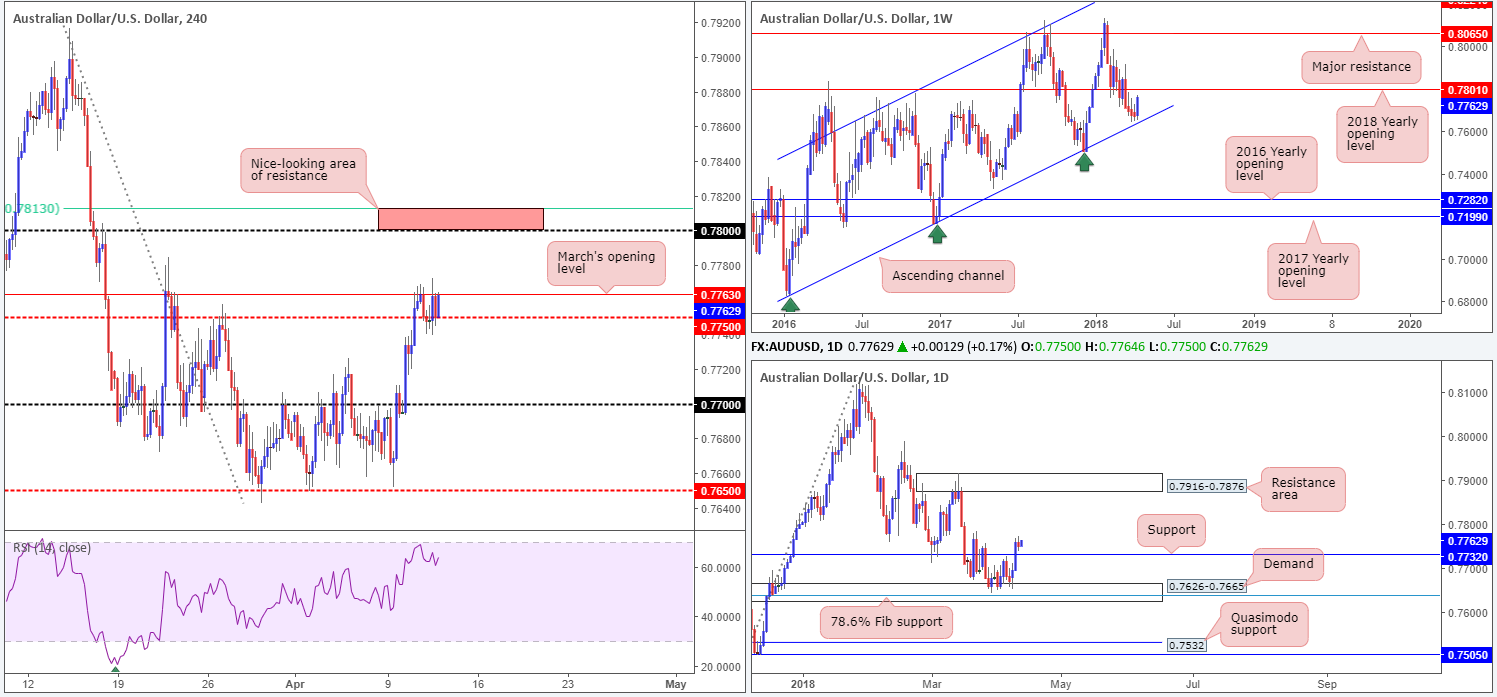
AUD/USD action was somewhat sedated on Wednesday, despite less-than-stellar Chinese inflation and a hawkish FOMC.
March’s opening level at 0.7763 seen on the H4 timeframe did a superb job in capping price, as did the H4 mid-level support at 0.7750. Beyond 0.7763, however, there’s a reasonably clear path north to the 0.78 handle, which is not only positioned nearby a 61.8% H4 Fib resistance at 0.7813 (green line), it also represents the 2018 yearly opening level on the weekly timeframe at 0.7801.
Potential trading zones:
0.7813/0.78 remains of interest for shorts this morning. Traders may also want to note that alongside the aforementioned structures, we can also see the H4 RSI hovering below the overbought value.
As 0.7813/0.78 is a relatively small zone, a fakeout through this area is possible. To help avoid getting snagged, consider waiting for H4 price to stabilize around the zone before pulling the trigger. Ideally, a H4 full or near-full-bodied bearish candle would be best. As for take-profit targets, the next logical zone, as of current price, is March’s opening level mentioned above at 0.7763.
Data points to consider today: US unemployment claims.
USD/JPY:
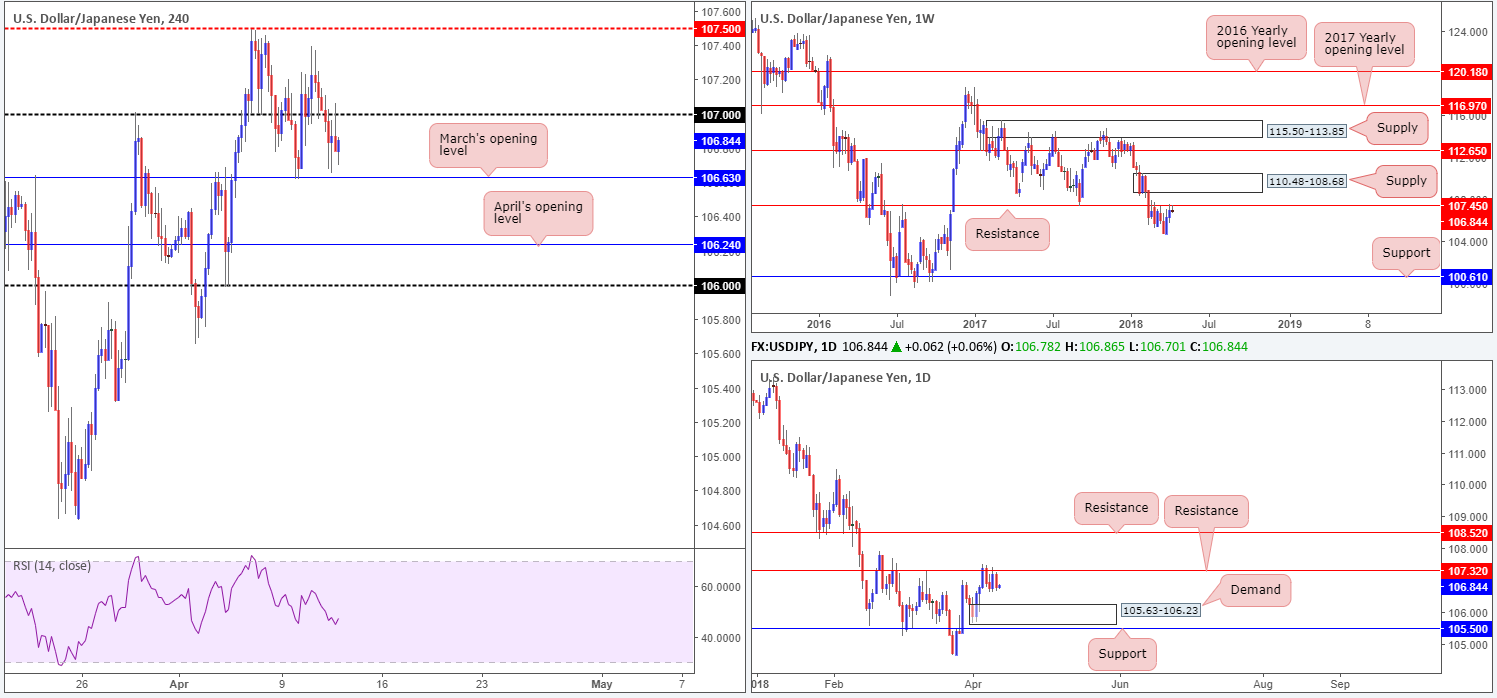
Coming in from the top this morning, we’ve slightly adjusted the technical picture on the weekly timeframe. As of current prices, we believe the pair is reflecting a strong bearish tone off of a notable weekly resistance at 107.45. In conjunction with the weekly timeframe, daily action is currently seen fading a resistance level priced in at 107.32, with the next downside target printed at 105.63-106.23: a daily demand area sited just north of a daily support level at 105.50. Across on the H4 timeframe, the USD/JPY recently crossed below the 107 handle and bottomed just ahead of March’s opening band at 106.63. Fading risk appetite aided the Japanese yen, alongside lower US Treasury yields.
Potential trading zones:
While both weekly and daily charts suggest further selling is in store, selling the market on the H4 timeframe is a challenge. As such, waiting for a break/retest of March’s opening level mentioned above at 106.63 is, in our view, a viable option. Upon retesting the underside of the monthly level, April’s opening level at 106.24 (converges with the top edge of the noted daily demand at 106.23) would be an ideal intraday support target. However, do bear in mind that price could potentially dip much lower than this level! Remember where the unit is trading from on the weekly timeframe!
Data points to consider today: US unemployment claims.
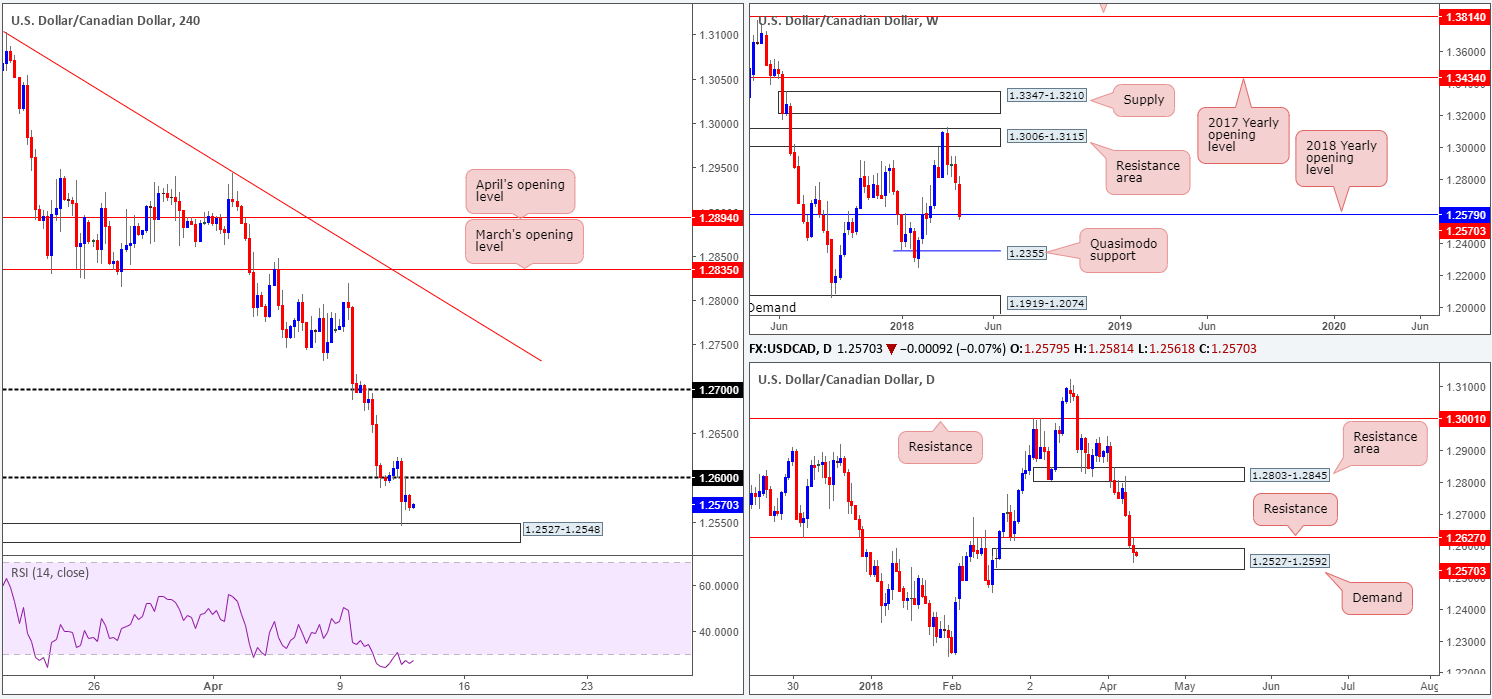
USD/CAD:
The Canadian dollar extended gains on Wednesday, following crude oil prices.
On the weekly timeframe, recent movement has seen price come into contact with the 2018 yearly opening level at 1.2579. These levels have a tendency to bounce price. Turning the focus down to the daily timeframe, we can see that the piece is seen trading within the walls of a daily demand zone at 1.2527-1.2592, following a break of daily support at 1.2627 on Tuesday.
H4 action, as you can see, initially held ground at 1.26, but failed to press higher. The pair took out 1.26 on crude oil inventories data, which in turn saw the candles connect with a H4 demand registered at 1.2527-1.2548.
Potential trading zones:
While we clearly see the pair remains entrenched within a rather dominant downtrend at the moment, we believe, according to technical structure, a recovery could be in the midst. The current daily demand, along with the 2018 yearly opening level seen within, are both considered significant barriers. To confirm upside, however, we would want to see a DAILY close beyond the daily resistance level mentioned above at 1.2627. At that point, the next upside target on the H4 timeframe would sit at 1.27.
Data points to consider today: US unemployment claims; CAD NHPI m/m.
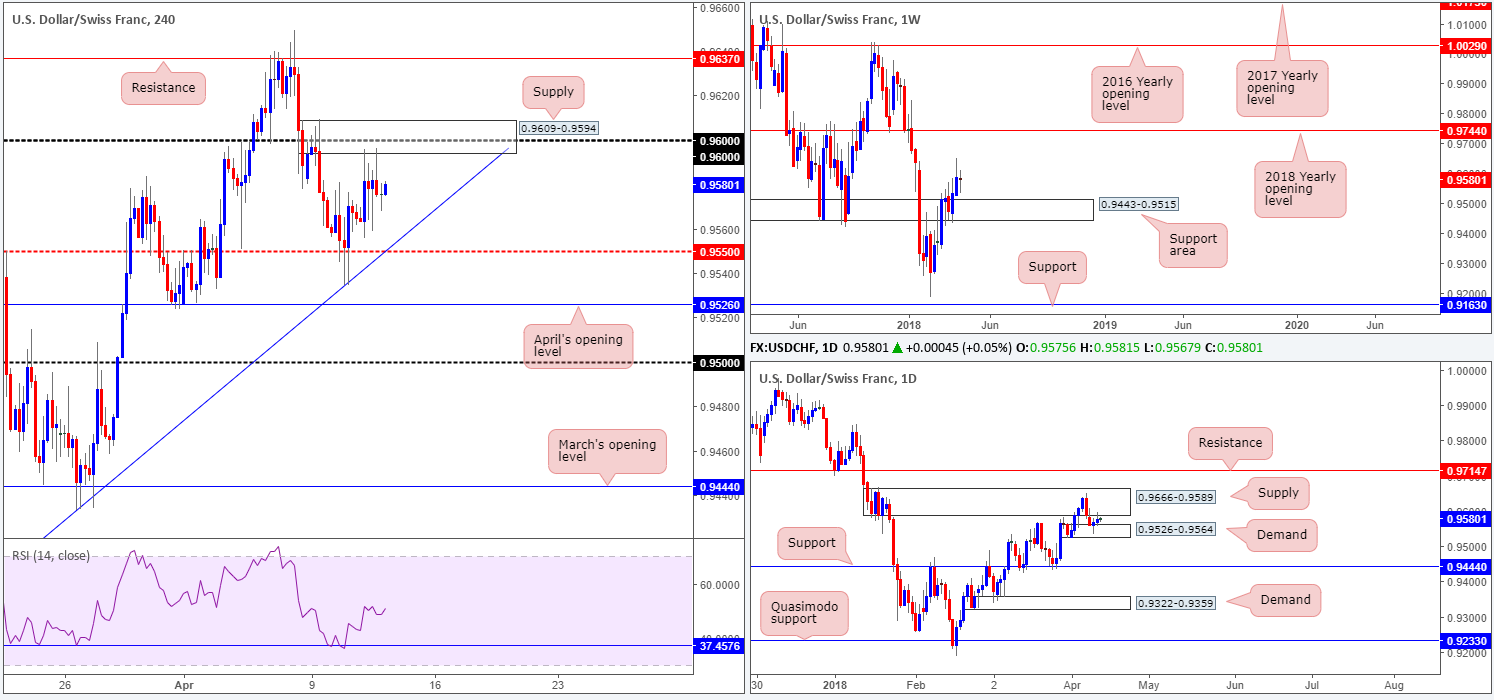
USD/CHF:
Over the course of Wednesday’s sessions, the USD/CHF was somewhat directionless. As can be seen from the H4 timeframe, the pair remains floating between a H4 supply zone at 0.9609-0.9594, which houses the 0.96 handle, and a H4 mid-level support plotted at 0.9550 that converges with a H4 trend line support taken from the low 0.9187. A move above the current supply would place H4 resistance at 0.9637 in the spotlight, whereas a move below 0.9550 has April’s opening level at 0.9526 to target.
Daily movement is in a similar boat to H4 structure, as price meanders between a daily supply zone priced in at 0.9666-0.9589 and a daily demand seen at 0.9526-0.9564.
Despite the noted indecisive price action, weekly price, after a push higher from a weekly support area at 0.9443-0.9515, shows room for the unit to punch as far north as the 2018 yearly opening level at 0.9744.
Potential trading zones:
With little room seen for H4 price to stretch its legs above 0.96, there is not really much to hang our hat on in terms of trading setups this morning. Therefore, unless you’re confident trading between 0.96/0.9550, opting to remain on the sidelines may be the better route to take.
Data points to consider today: US unemployment claims.
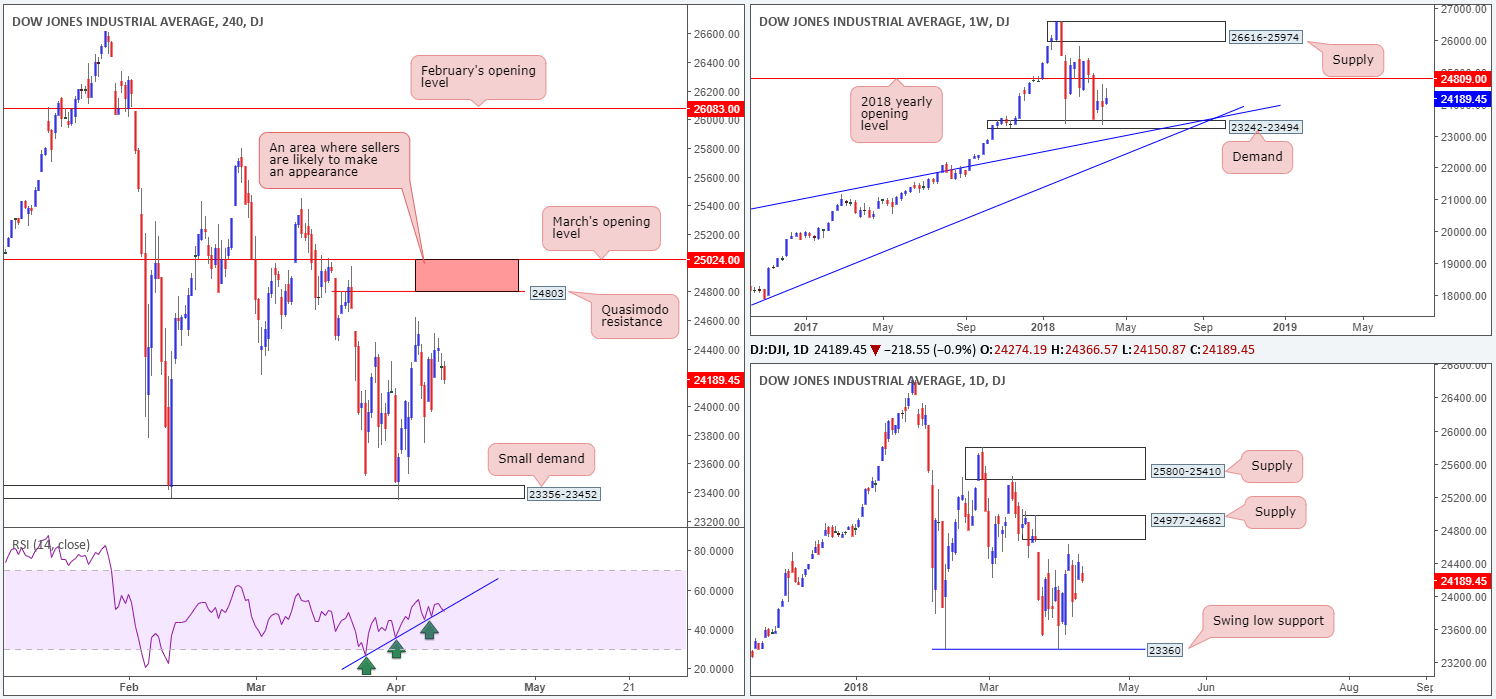
DOW 30:
The Dow Jones Industrial Average traded on the back foot amid Wednesday’s session.
Following Russia’s warning that US military action in Syria over alleged use of chemical weapons will be met with Russian assistance to Syria, US President Trump upped the rhetoric, warning Russia to ‘get ready’ for missiles. There were further reports on Wednesday that pro-government forces in Syria had begun evacuating airports and military basis in preparation for US strikes. This – coupled with a somewhat hawkish FOMC – weighed on US equities.
From a technical standpoint, the index remains unchanged in terms of structure. Weekly price continues to hover between the 2018 yearly opening level at 24809 and a weekly demand at 23242-23494. Daily movement is seen trading just beneath a daily supply zone coming in at 24977-24682, which happens to house the noted 2018 yearly opening level. On the H4 timeframe, a H4 Quasimodo resistance at 24803 continues to station itself above current price, followed by March’s opening level at 25024.To the downside, we see a small H4 demand plotted within the current weekly demand at 23356-23452. It might also be worth noting that the H4 RSI trend line support remains intact.
Potential trading zones:
The area between March’s opening level at 25024 and the H4 Quasimodo resistance at 24803 remains of interest this morning (marked in red). Not only does the area house the 2018 yearly opening level mentioned above at 24809, it also has connections with the current daily supply zone. For this reason, selling could materialize from 25024/24803.
Data points to consider today: US unemployment claims.
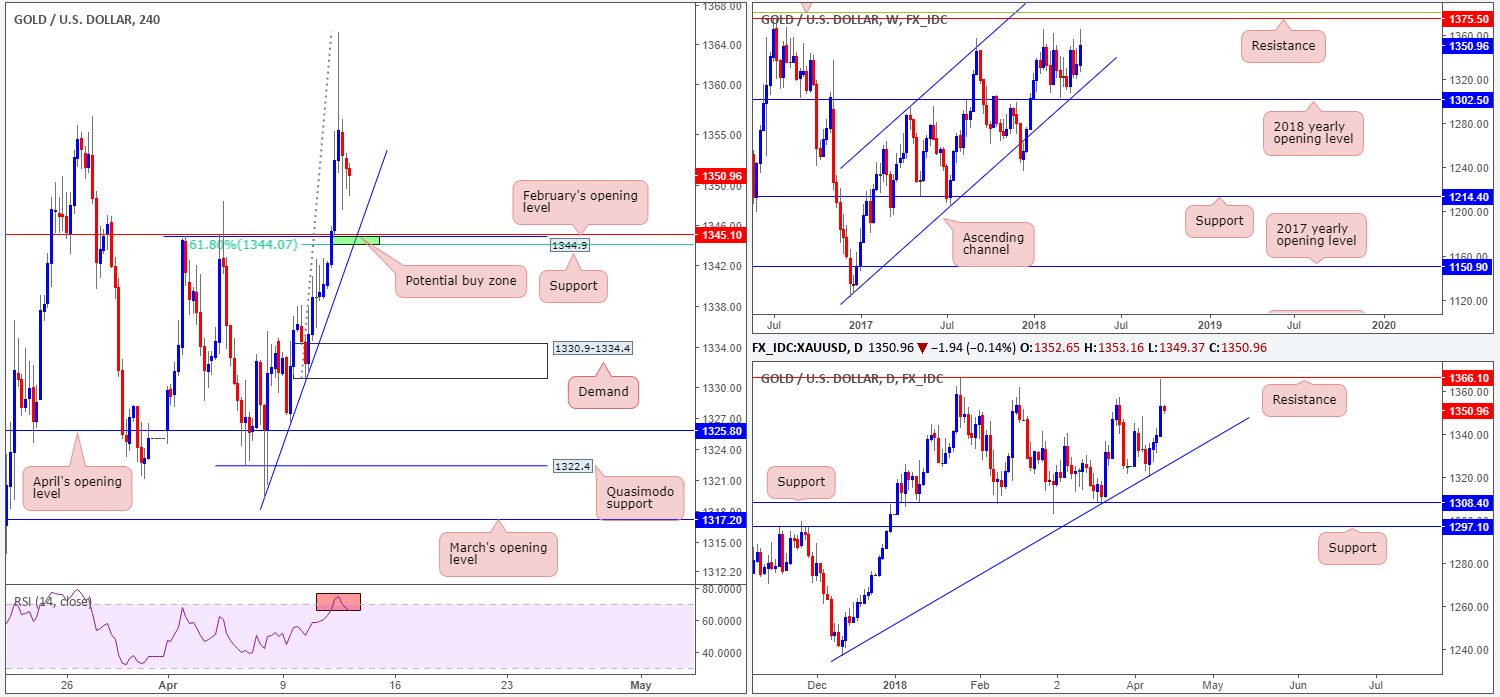
GOLD:
Kicking this morning’s analysis off with a look at the weekly timeframe, we can see that bullion remains floating between the 2018 yearly opening level at 1302.5 (fuses closely with a long-term weekly channel support etched from the low 1122.8) and a weekly resistance pegged at 1375.5/38.2% weekly Fib resistance at 1381.0 (green line).
Daily movement came within a few pips of connecting with a daily resistance level plotted at 1366.1 during Wednesday’s advance. Should price action continue to press lower, the next port of call falls in at a daily trend line support etched from the low 1236.6.
Branching across to the H4 candles, yesterday’s pullback from the aforementioned daily resistance level has brought H4 action within striking distance of a nice-looking support structure. Comprised of a H4 support at 1344.9, a H4 trend line support taken from the low 1319.2, February’s opening level at 1345.1 and a 61.8% H4 Fib support at 1344.0, this area is likely to bounce price today.
Potential trading zones:
As noted above, the 1345.0ish area on the H4 timeframe is of interest this morning. Despite its sound confluence on the H4 timeframe, traders may want to consider waiting and seeing if H4 price can chalk up a full or near-full-bodied H4 bull candle before pulling the trigger. The reason for this is simply due to where daily price is trading from: a nearby daily resistance level! Also of concern is the fact that the H4 RSI is currently trading in overbought territory.
This site has been designed for informational and educational purposes only and does not constitute an offer to sell nor a solicitation of an offer to buy any products which may be referenced upon the site. The services and information provided through this site are for personal, non-commercial, educational use and display. IC Markets does not provide personal trading advice through this site and does not represent that the products or services discussed are suitable for any trader. Traders are advised not to rely on any information contained in the site in the process of making a fully informed decision.
This site may include market analysis. All ideas, opinions, and/or forecasts, expressed or implied herein, information, charts or examples contained in the lessons, are for informational and educational purposes only and should not be construed as a recommendation to invest, trade, and/or speculate in the markets. Any trades, and/or speculations made in light of the ideas, opinions, and/or forecasts, expressed or implied herein, are committed at your own risk, financial or otherwise.
The use of the site is agreement that the site is for informational and educational purposes only and does not constitute advice in any form in the furtherance of any trade or trading decisions.
The accuracy, completeness and timeliness of the information contained on this site cannot be guaranteed. IC Markets does not warranty, guarantee or make any representations, or assume any liability with regard to financial results based on the use of the information in the site.
News, views, opinions, recommendations and other information obtained from sources outside of www.icmarkets.com.au, used in this site are believed to be reliable, but we cannot guarantee their accuracy or completeness. All such information is subject to change at any time without notice. IC Markets assumes no responsibility for the content of any linked site. The fact that such links may exist does not indicate approval or endorsement of any material contained on any linked site.
IC Markets is not liable for any harm caused by the transmission, through accessing the services or information on this site, of a computer virus, or other computer code or programming device that might be used to access, delete, damage, disable, disrupt or otherwise impede in any manner, the operation of the site or of any user’s software, hardware, data or property.


