A note on lower timeframe confirming price action…
Waiting for lower timeframe confirmation is our main tool to confirm strength within higher timeframe zones, and has really been the key to our trading success. It takes a little time to understand the subtle nuances, however, as each trade is never the same, but once you master the rhythm so to speak, you will be saved from countless unnecessary losing trades. The following is a list of what we look for:
- A break/retest of supply or demand dependent on which way you’re trading.
- A trendline break/retest. Buying/selling tails – essentially we look for a cluster of very obvious spikes off of lower timeframe support and resistance levels within the higher timeframe zone.
- Candlestick patterns. We tend to only stick with pin bars and engulfing bars as these have proven to be the most effective.
For us, lower timeframe confirmation starts on the M15 and finishes up on the H1, since most of our higher timeframe areas begin with the H4. Stops usually placed 5-10 pips beyond your confirming structures.
EUR/USD:
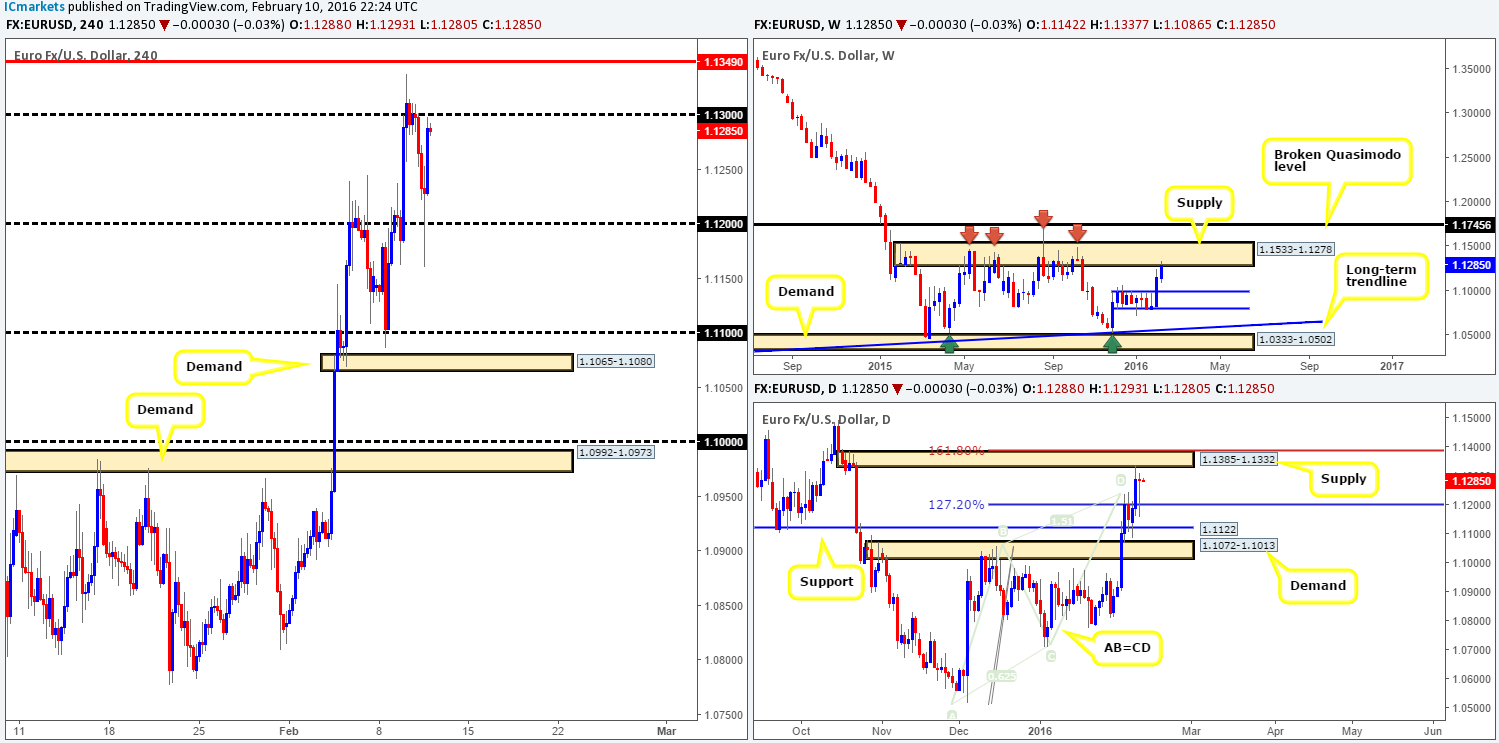
Following Yellen’s testimony yesterday, the single currency violently whipsawed through psychological support 1.1200 and rallied back up to the outskirts of psychological resistance 1.1300. In our previous report (http://www.icmarkets.com/blog/wednesday-10th-february-all-eyes-on-yellen-today-at-3pm-gmt-volatility-expected/) we mentioned that we shorted from the underside of daily supply at 1.1385-1.1332 – our pending sell order was filled at 1.1330 on Tuesday. The trade was taken due to the following reasons:
- The daily supply zone sits within a weekly supply area at 1.1533-1.1278.
- On the daily timeframe a very clear Harmonic AB=CD bear pattern is in play right now. The sell zone (for us) can be seen between the 127.2% Fibonacci level at 1.1197 and the 161.8% at 1.1387 – the daily supply sits within the upper area of our Harmonic sell zone making it a perfect barrier in which to short.
We went on to say that our first take-profit target will be the psychological support 1.1200, which also marks the top- side of a daily demand base (not marked on the chart) at 1.1086-1.1195. As shown on the chart, 1.1200 was easily reached yesterday, where we locked in 1.5 times our risk as well as moving the stop to breakeven plus three pips. Well done to anyone else who jumped in this trade alongside us!
Given 1.1300 is still in play right now, this could be enough to protect our trade from being stopped out. The next take-profit target, which seems unlikely at this point, is the 1.1100 region since 22 pips above it lurks daily support at 1.1122. If price does advance today the next port of call for a rebound will likely be the H4 resistance penciled in at 1.1349, since it is also housed within both the aforementioned daily and weekly supplies. As such, do keep a close eye on this number in the coming sessions.
Levels to watch/live orders:
- Buys: Flat (Stop loss: N/A).
- Sells: 1.1330 [LIVE] (Stop loss: breakeven). 1.1349 [Tentative – confirmation required] (Stop loss: dependent on where one confirms this level).
GBP/USD:
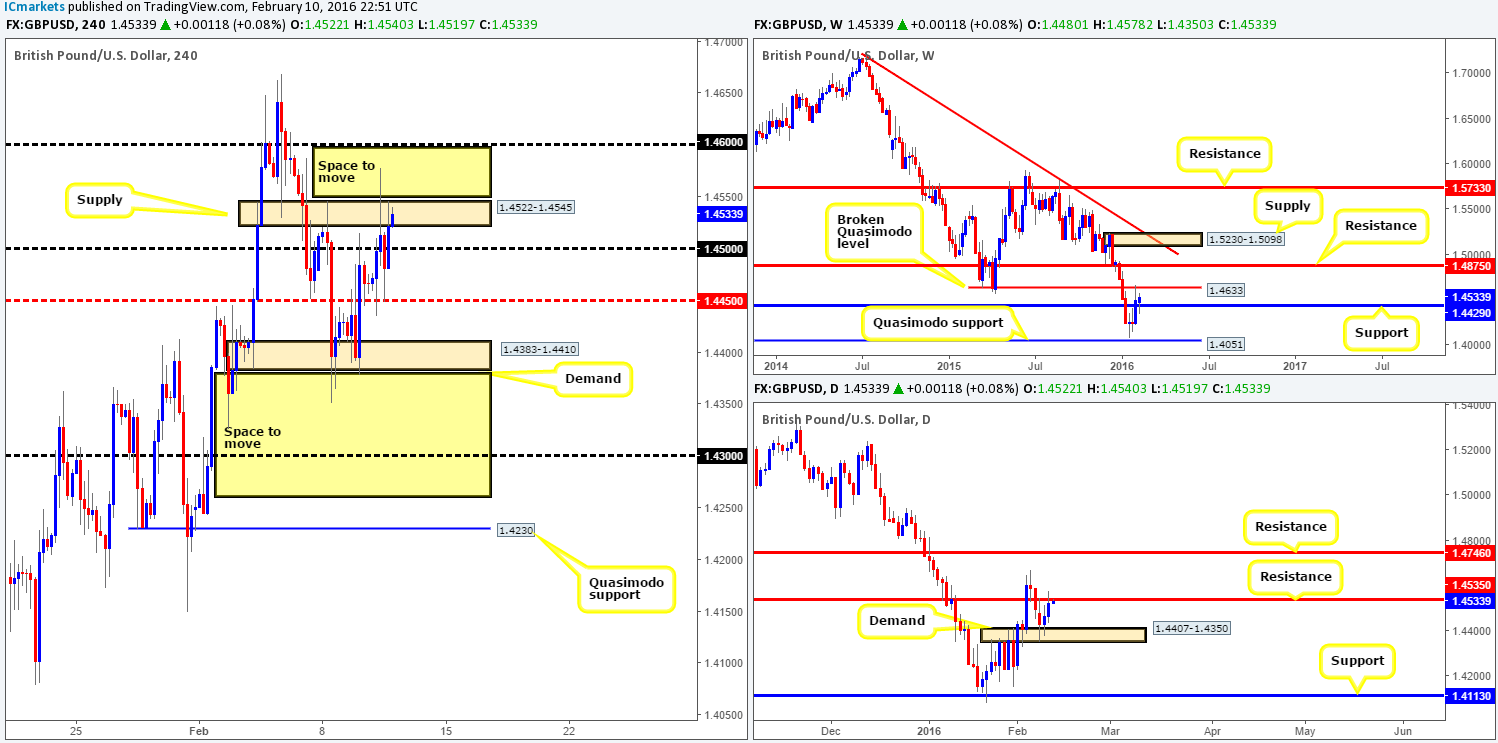
Once again we begin our analysis looking at the weekly chart, which shows support at 1.4429 being respected. To our way of seeing things here now, the bears appear to be coming in from the broken Quasimodo level (BQM) at 1.4633 and the bulls from 1.4429, and they’re about to clash in the middle!
Moving down to the pits of the daily chart, however, yesterday’s candle connected with the underside of resistance drawn from 1.4535. A sustained move above this number would likely clear the path up to the aforementioned weekly BQM level, and quite possibly the daily resistance penciled in at 1.4746.
Turning our attention to the H4 chart, one can see that supply at 1.4522-1.4545 was aggressively spiked mid-way through yesterday’s London session, likely removing a truckload of sellers from the market. As we can all see, trade ended the day rebounding from mid-level support 1.4450, consequently pushing the pair back into the above said supply.
Ultimately, what we’re looking for today is a daily close above daily resistance at 1.4535, which does not connect with psychological resistance 1.4600. Reason being is that if a sustained move above the current H4 supply takes place, there is likely going to be a retest trade opportunity at either the broken H4 supply or the psychological support 1.4500, targeting 1.4600, followed closely by 1.4633 – the weekly BQM level. Therefore, there will be no trades taken on this pair today as we need to see where the day closes.
Levels to watch/live orders:
- Buys: Currently watching for a daily close above daily resistance 1.4535 before we make any further decisions.
- Sells: Flat (Stop loss: N/A).
AUD/USD:
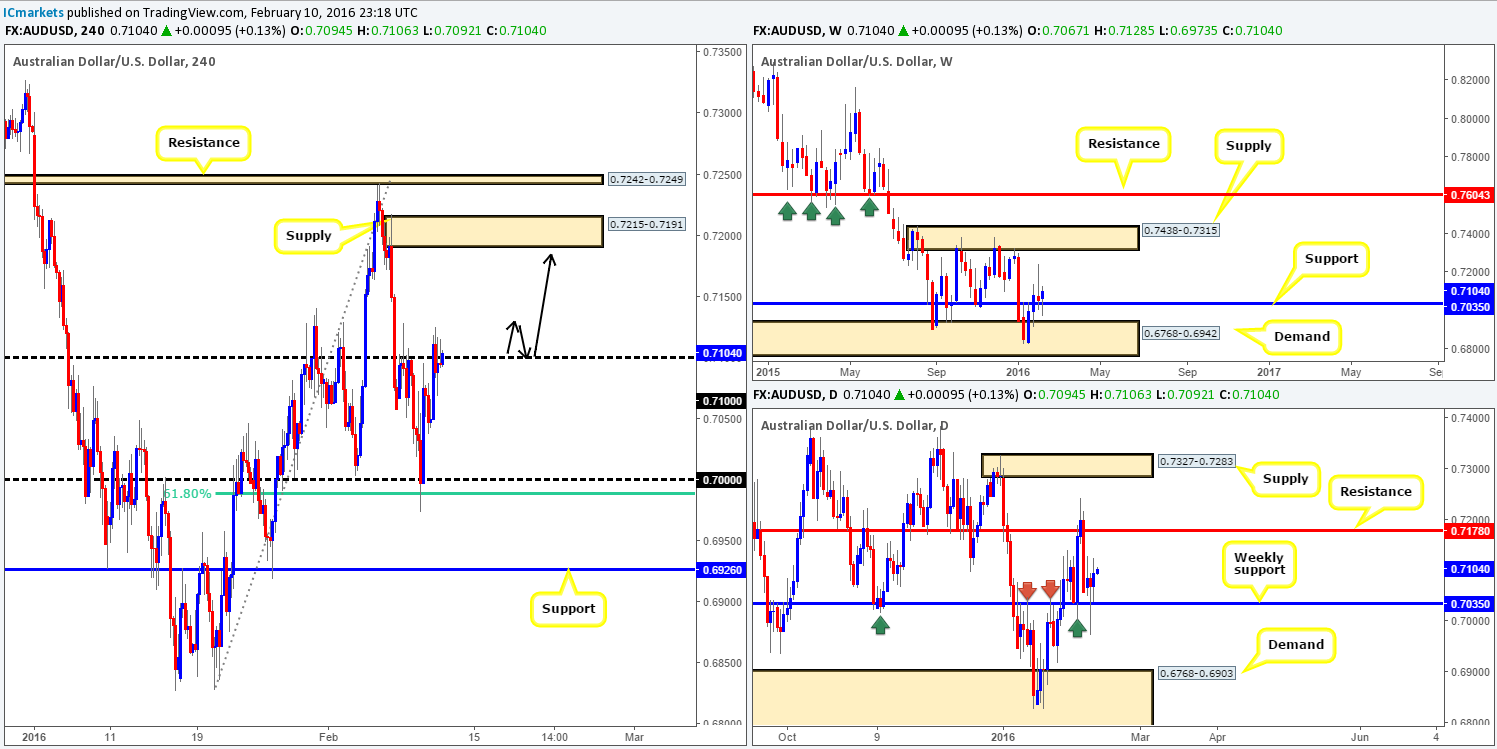
From the daily chart, yesterday’s session saw the bulls once again jab into the weekly support level drawn from 0.7035, pushing the commodity currency above both Monday and Tuesday’s candle bodies. This, at least to us, indicates that the Aussie is likely going to continue to advance during today’s trading.
H4 action on the other hand, shows that the buyers and sellers continue to exchange blows around psychological resistance 0.7100. Personally, our money is on the bulls winning this fight due to where price is positioned on the higher-timeframe picture (see above). On the assumption that our above analysis is correct and price convincingly closes above 0.7100 today, our team will look to try and enter long on any retest of this level seen thereafter (with lower timeframe confirmation), targeting H4 supply coming in at 0.7215-0.7191 first and foremost. As we mentioned in yesterday’s report, waiting for lower timeframe buying confirmation at 0.7100 is something we insist on here since it is very difficult to know how aggressively this number will be challenged on the retest.
Levels to watch/live orders:
- Buys: Watch for offers to be consumed around 0.7100 and look to trade any retest seen thereafter (lower timeframe confirmation required).
- Sells: Flat (Stop loss: N/A).
USD/JPY:
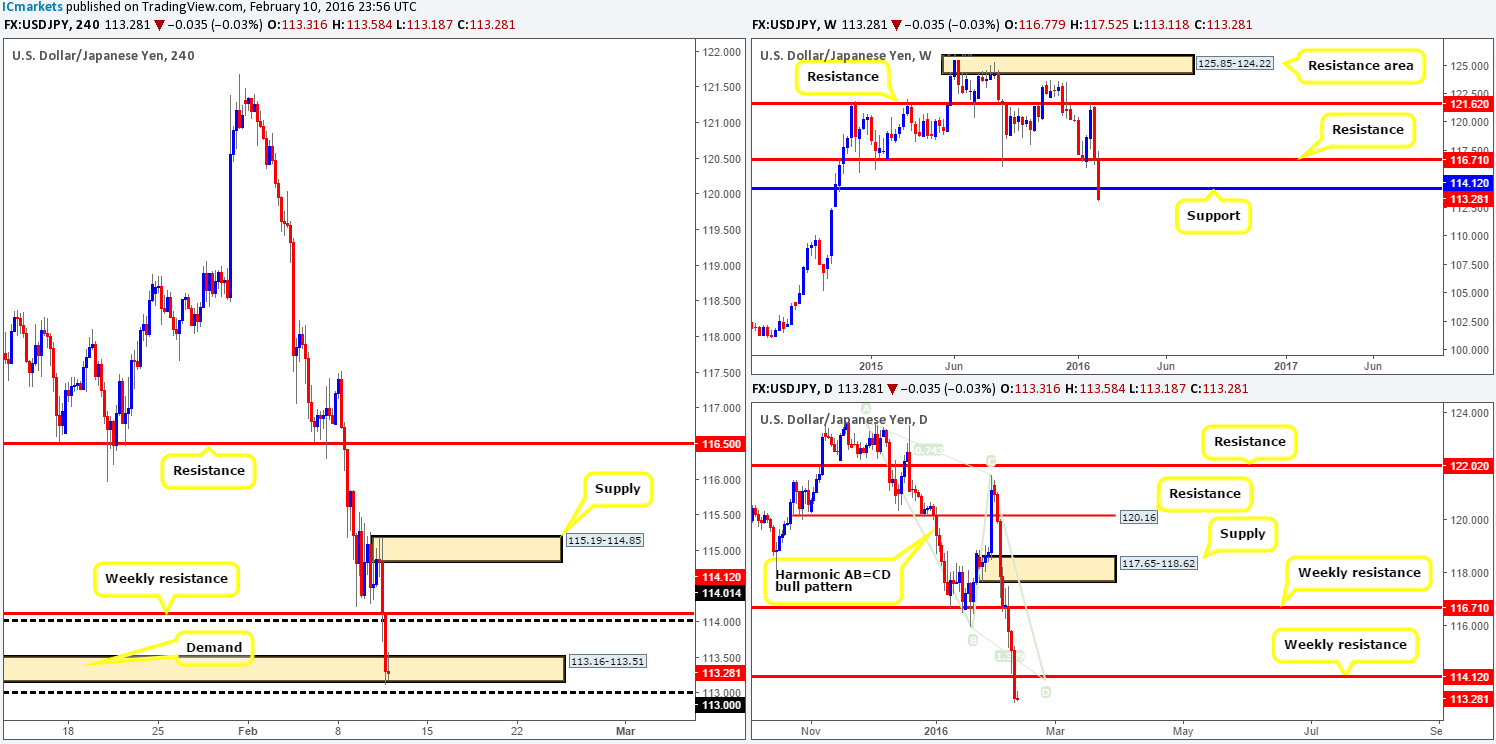
The USD/JPY took yet another blow to mid-section during yesterday’s sessions, losing close to 180 pips. Consequent to this, price is now seen trading below weekly support at 114.21. However, it may be worth waiting for the weekly candle to close up shop before presuming that this support is consumed.
Scrolling down to the daily chart, one can see that yesterday’s action closed below weekly support, and also swept past the D leg of the bullish AB=CD pattern. This has, as far as we can see, potentially opened up the path south all the way down to support penciled in at 110.15. Be that as it may, before we all begin looking to short, let’s keep in mind that the break below weekly support could simply be a fakeout to rally higher – only time will tell!
Stepping down one more level into the H4 chart, we can see that yesterday’s bearish assault ended with a slight whipsaw through demand coming in at 113.16-113.51. Now, going long from this barrier would be a little scary in our opinion due to how aggressively the Aussie was sold yesterday, and not to mention that fact that psychological support 113.00 lurks just below, potentially acting as magnet to price.
Going over all of the points made above, we feel the best course of action is to wait. As we just mentioned, entering long from the base of the current H4 demand is not something we’d be comfortable with. A close below 113.00 would be interesting though, since this suggests that further selling could be on the cards today. That being the case, a close below and retest of 113.00 together with a lower timeframe sell signal would be enough of a case for us to join in this selling momentum, targeting mid-level support 112.50 as our first take-profit target.
Levels to watch/live orders:
- Buys: Flat (Stop loss: N/A).
- Sells: Watch for bids to be consumed around 113.00 and look to trade any retest seen thereafter (lower timeframe confirmation required).
USD/CAD:
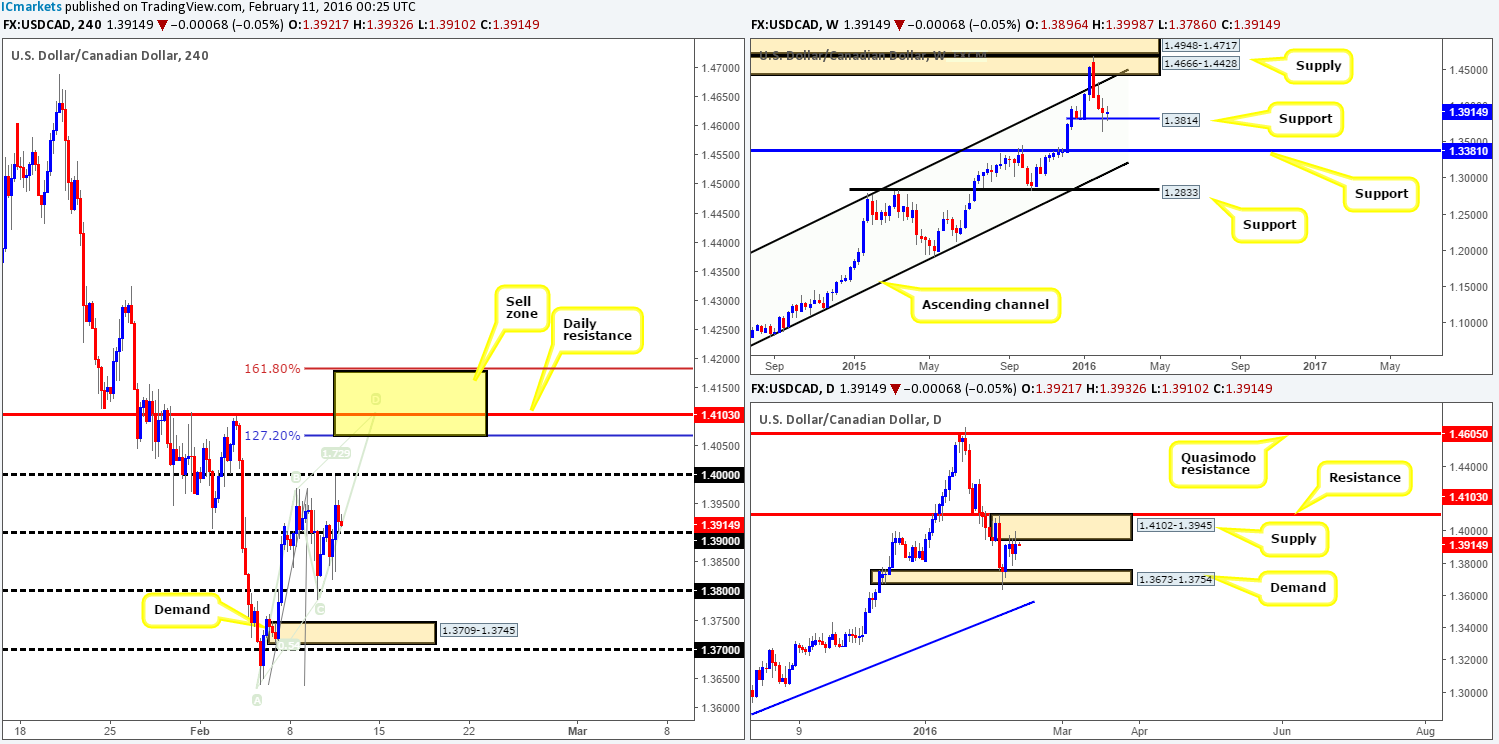
Initial H4 action saw psychological resistance 1.3900 offered, bringing price down to lows of 1.3820 mid-ways through London trading. It was not until the U.S session began, however, did we see 1.3900 breached, pushing prices to highs of 1.3998 before selling off into the close 1.3921. Despite this recent movement, our outlook for this pair remains the same as in our previous report…
We can see that weekly price remains loitering just above support at 1.3814, whilst down on the daily chart, price is seen capped between supply at 1.4102-1.3945 and demand drawn from 1.3673-1.3754. Now, bearing this in mind, H4 flow is currently seen painting a nice-looking AB=CD bearish pattern which completes between 1.4177/1.4067 (127.2%/161.8% Fibonacci extensions). This H4 pattern also terminates nicely at daily resistance coming in at 1.4103, which is parked one pip above the aforementioned daily supply.
Taking into account the recent selling this pair has seen, shorting the H4 AB=CD pattern is viable in our opinion. However, one must not forget that weekly action could springboard itself north from support at 1.3814 at any time and potentially take out this H4 zone. Therefore, to combat this, we have an alert set at 1.4058 which if triggered will be our cue to begin watching how the lower timeframe price (preferably higher than the M30) action behaves. Ideally, a lower timeframe sell setup that forms around the above said daily resistance would be very nice as this would allow the stop to be placed above 1.4177 (top-side of our H4 sell zone).
Levels to watch/live orders:
- Buys: Flat (Stop loss: N/A).
- Sells: 1.4177/1.4067 [Tentative – confirmation required] (Stop loss: dependent on where one confirms this area).
USD/CHF:
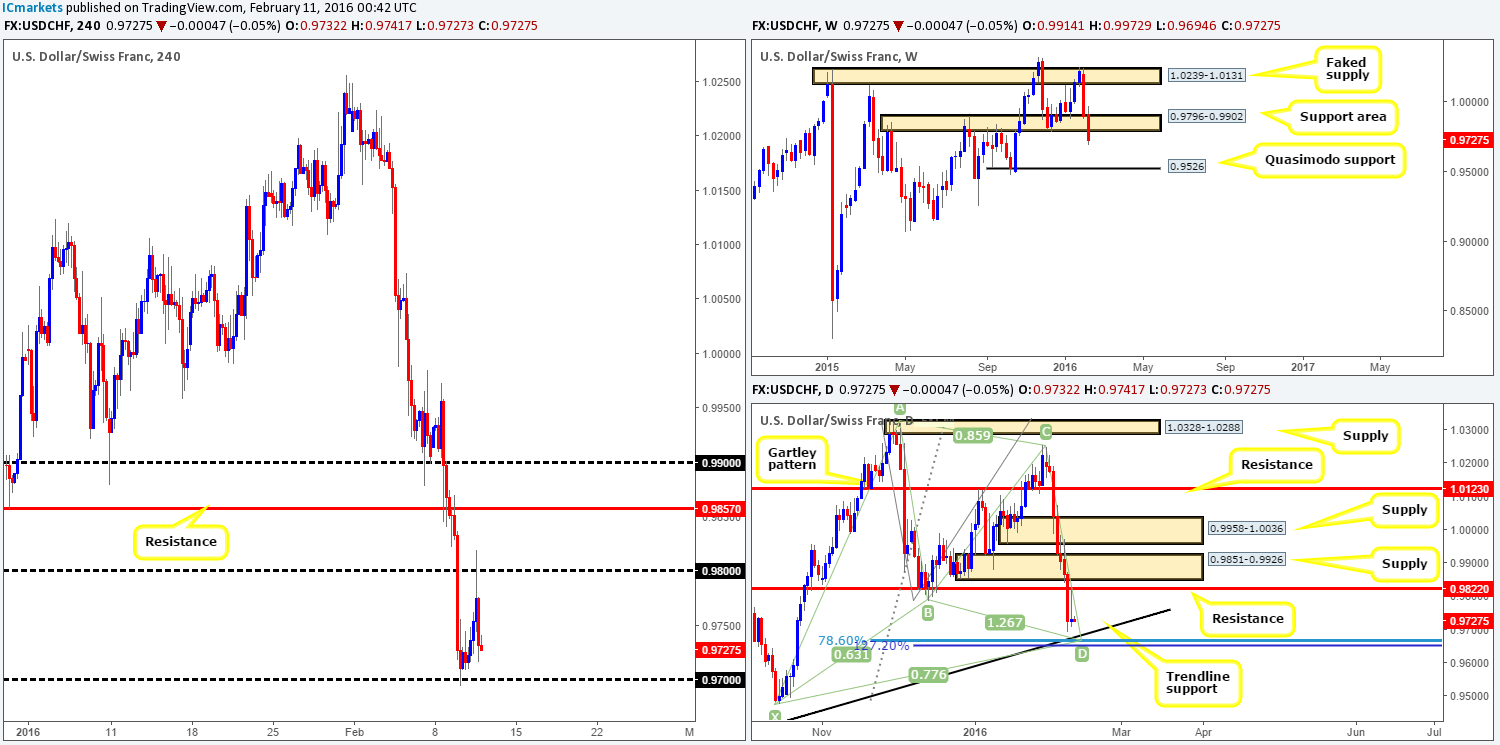
Beginning this morning’s analysis with a look at the weekly chart, one can see that price remains trading below the support area at 0.9796-0.9902. In the event that this week’s candle closes below this barrier, this could potentially open the path south for further selling down to a Quasimodo support level at 0.9526.
Breaking into the daily chart, resistance at 0.9822 came so very close to being hit during yesterday’s session, falling shy by a mere three pips before selling off into the close 0.9732. As we mentioned in yesterday’s report, we feel that the runway is now clear down to test trendline support extended from the low 0.9078 and the Harmonic Gartley reversal zone (78.6% Fibonacci level at 0.9669/127.2% Fibonacci extension at 0.9651).
Looking at the H4 chart, the bounce from psychological support 0.9700 was far more aggressive than we anticipated. Nevertheless, this still looks to be only a short-covering ascent, thus we expect prices to continue lower today. 0.9700 may cause a little hesitation for a while today, but not for long in our opinion as the market is likely being drawn to the daily trendline support and its converging structures mentioned above. Due to the confluence seen at this daily area (0.9651/0.9669), we are confident a profitable bounce will be seen from here. However, we would recommend waiting for lower timeframe confirmation to form before committing capital to this idea since the buy zone is relatively small and likely prone to a fakeout. With regards to targets, our first port of call is the daily resistance level mentioned above at 0.9822.
Levels to watch/live orders:
- Buys: 0.9651/0.9669 [Tentative – confirmation required] (Stop loss: dependent on where one confirms this area).
- Sells: Flat (Stop loss: N/A).
DOW 30:
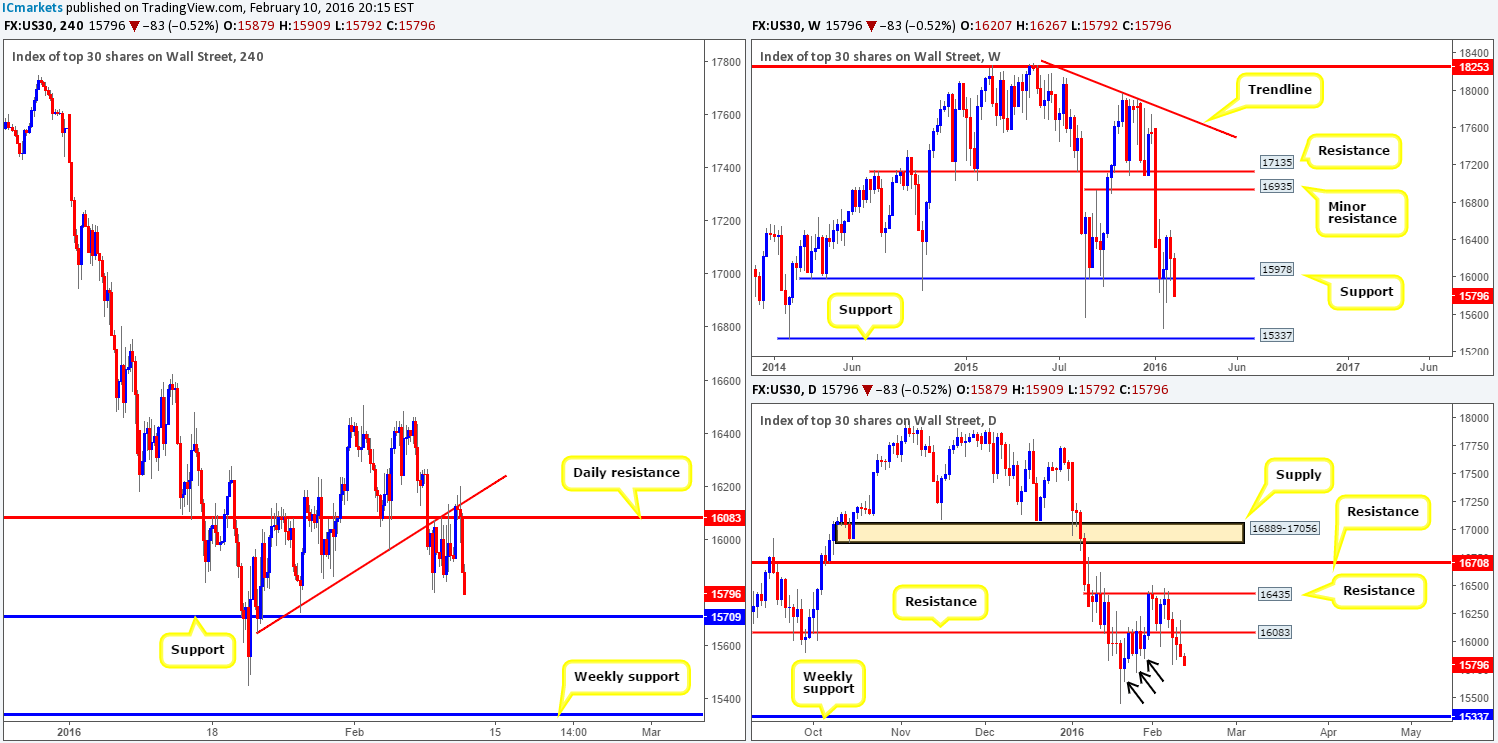
Weekly support penciled in at 15978 once again came under pressure yesterday, consequently forcing prices below this barrier. Although this support has remained intact for the past month, one can almost feel the bids drying up here! In the event that this level does eventually cave in, price will likely look to cross swords with support formed at 15337.
Daily resistance at 16083 was retested again yesterday, only this time the market plowed much lower than the previous retest, closing the day on its lows at 15879. Providing that this barrier continues to hold firm, we see little active demand to the left of current price to stop the index from reaching the weekly support at 15337. Check out the demand consumption tails marked with black arrows at 15853/15725/15647. To us these tails indicate most of the buy orders here have already been filled.
From the H4 chart, however, we can see that since Monday, price has been hugging the underside of the recently broken trendline support as resistance (15735). This – coupled with daily resistance at 16083 was clearly too much for the buyers to overcome as the DOW plummeted lower going into the American afternoon session.
With the above points in mind, buying is out of the question for the time being. Even if H4 support at 15709 comes into play today, buying from here is risky considering what we’re seeing on the higher-timeframe picture (see above). Therefore, the best, and in our opinion, most logical path might be to wait for price to CLOSE below this H4 support since this would likely clear the road south for prices to challenge the weekly support discussed above at 15337. To trade this move, however, we’d need to see two things happen. Firstly, a retest of 15709 as resistance, and secondly a lower timeframe sell signal following the retest.
Levels to watch/live orders:
- Buys: Flat (Stop loss: N/A).
- Sells: Watch for bids to be consumed around 15709 and look to trade any retest seen thereafter (lower timeframe confirmation required).
XAU/USD: (Gold)
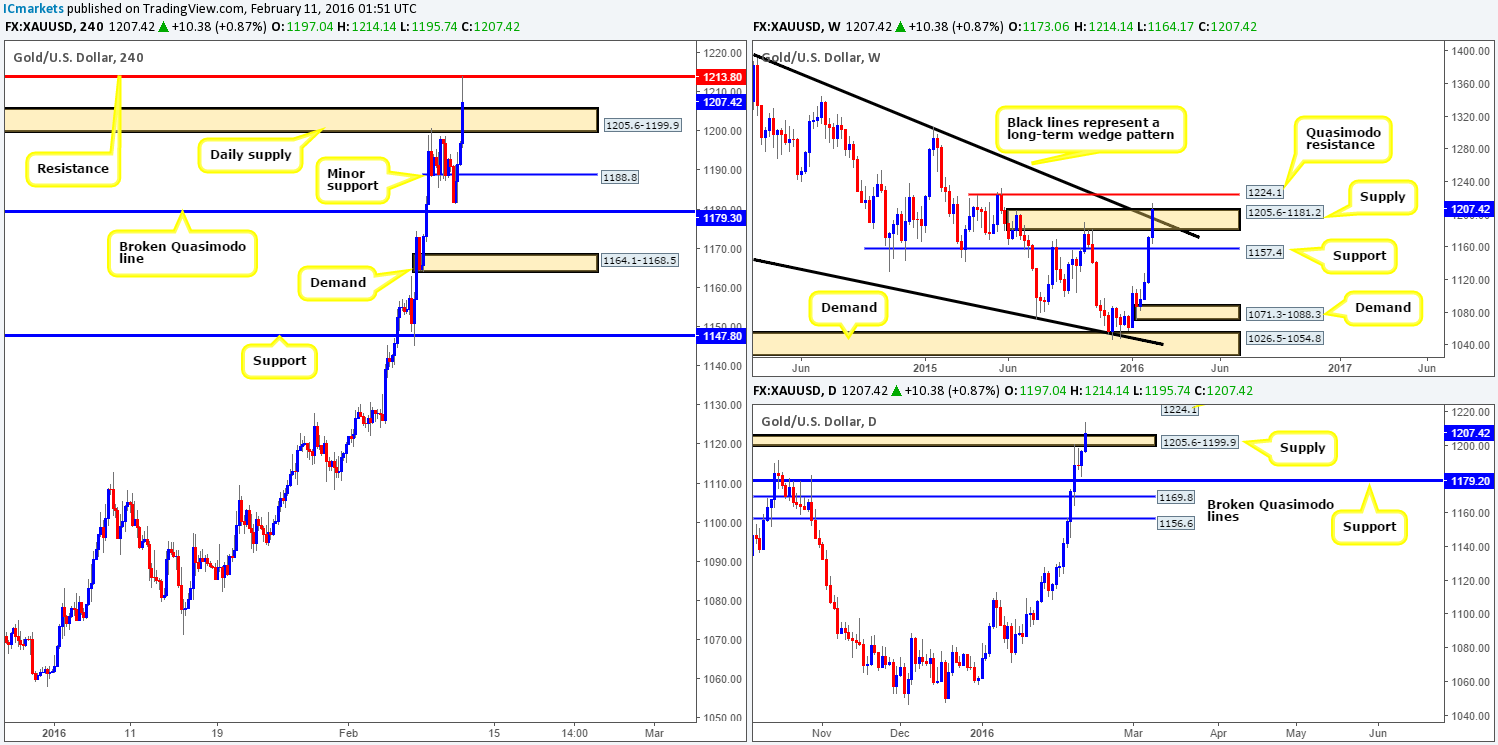
The bullish pulse continues to beat in the Gold market as investors flock to the safe-haven metal. During the most recent bullish assault, price broke above both the weekly supply at 1205.6-1181.2 and its converging wedge resistance taken from the high 1488.0. Providing that the bulls remain dominant above here, the next objective to reach can be seen at 1224.1 – a Quasimodo resistance level. In-line with this, daily supply at 1205.6-1199.9 was taken out, which, as far as we can see, also indicates further buying is possible up to the aforementioned weekly Quasimodo resistance base.
Scrolling across to the H4 picture on the other hand, shows that following the break above daily supply, price collided with H4 resistance drawn from 1213.8, which is currently holding firm. Despite this, there is not a chance that we are going to look to short this market from here, instead we’re actually going to look for the recently broken daily supply to act as demand! Should the bulls defend this area and push price above 1213.8 today without touching the weekly Quasimodo resistance 1224.1, there’s scope for a long position in our opinion. A small close above 1213.8 along with a confirmed retest of this number would be enough for our team to jump in long, targeting the 1224.1 as our first take-profit target.
Levels to watch/live orders:
- Buys: Watch for offers to be consumed around 1213.8 and look to trade any retest seen thereafter (lower timeframe confirmation required).
- Sells: Flat (Stop loss: N/A).


