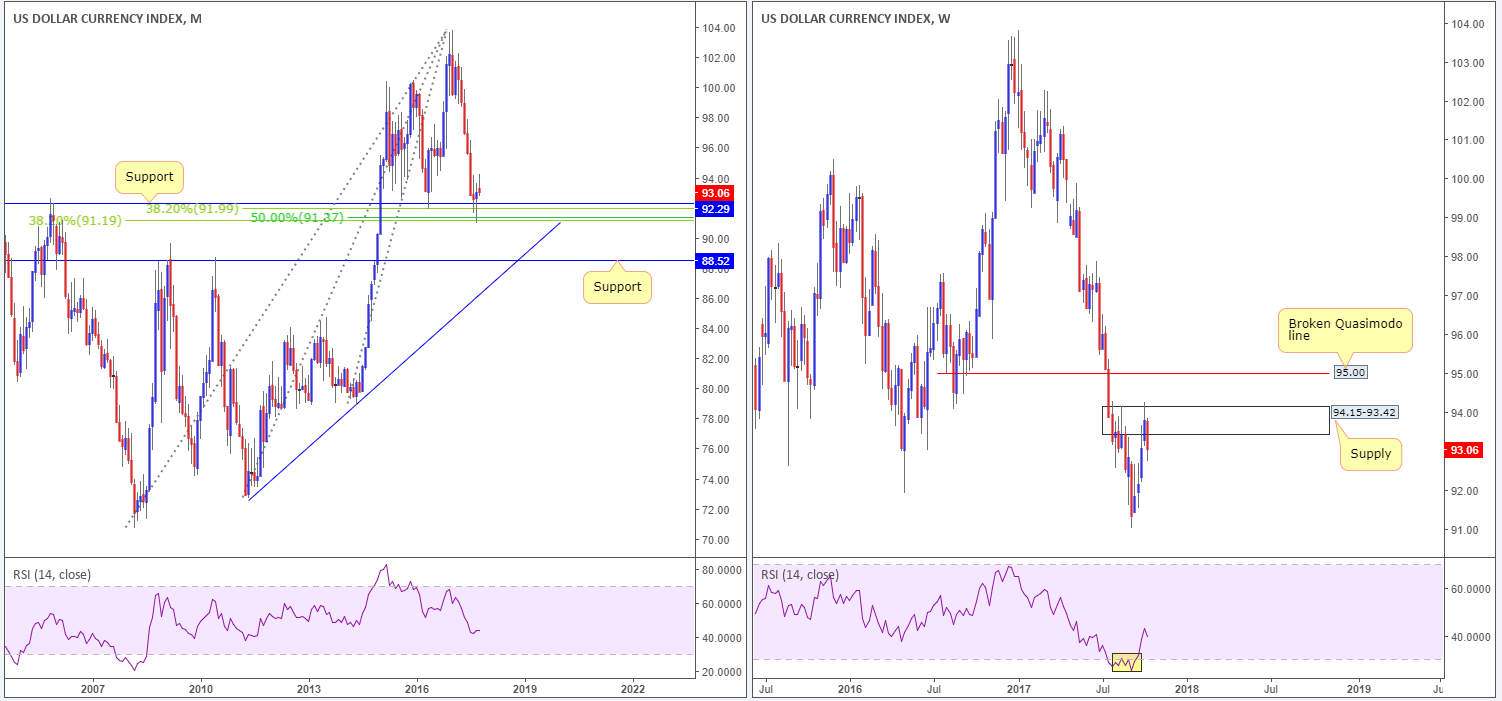
US dollar index:
Since the dollar shook hands with monthly support at 92.29, the unit has remained bid. Not only does this level stretch as far back as 1998, it is bolstered by a strong-looking Fibonacci support cluster seen between 91.19/91.99. A violation of this level would likely place monthly support at 88.52 (converges with monthly trendline support taken from the low 72.70) in the spotlight. Bouncing across to the weekly timeframe, supply at 94.15-93.42 came under pressure at the beginning of the month, potentially filling stop-loss orders above the area. This, as you can see, triggered a selloff last week, consequently breaking a four-week bullish phase.
Bias: The dollar, despite geopolitical tensions between North Korea and the US, will likely remain firm at the current monthly support for the time being. As a result, there’s a possibility that the aforementioned weekly supply will likely be taken out in the near future, which theoretically should open up the trail north to the broken weekly Quasimodo line at 95.00.
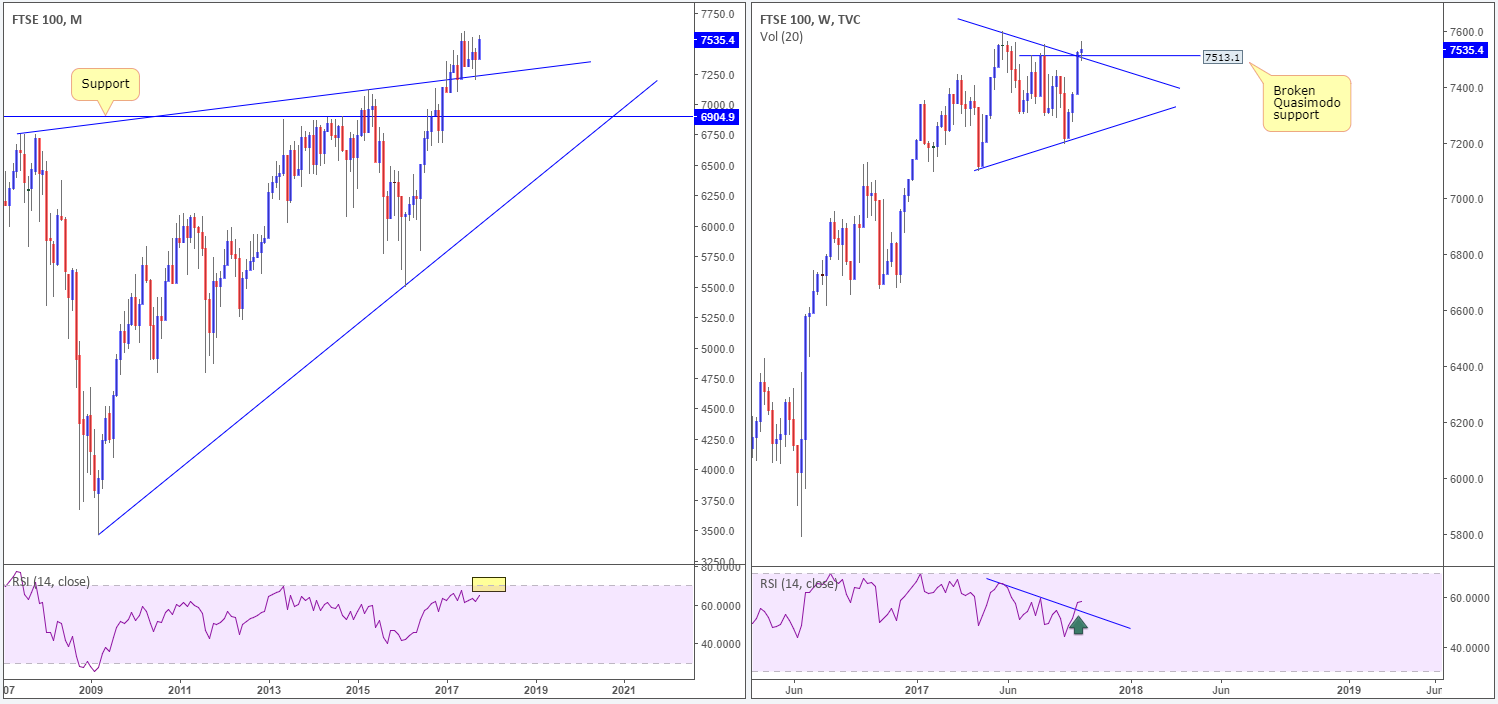
FTSE100:
The FTSE advanced 163 points this month, recording its fourth consecutive bullish (weekly) close and placing the UK index within striking distance of record highs of 7599.0.
Monthly technicals show price recently bounced off a trendline support etched from the high 6754.1, with little resistance in view. In support of this, weekly price is also seen supported by both a recently broken trendline resistance taken from the high 7599.0 (now acting support) and a broken Quasimodo line fixed at 7513.1. Also noteworthy on this scale is the RSI trendline break and indecision candle.
Bias: With little technical resistance on the horizon, UK shares will likely be tapping fresh record highs in the near future.
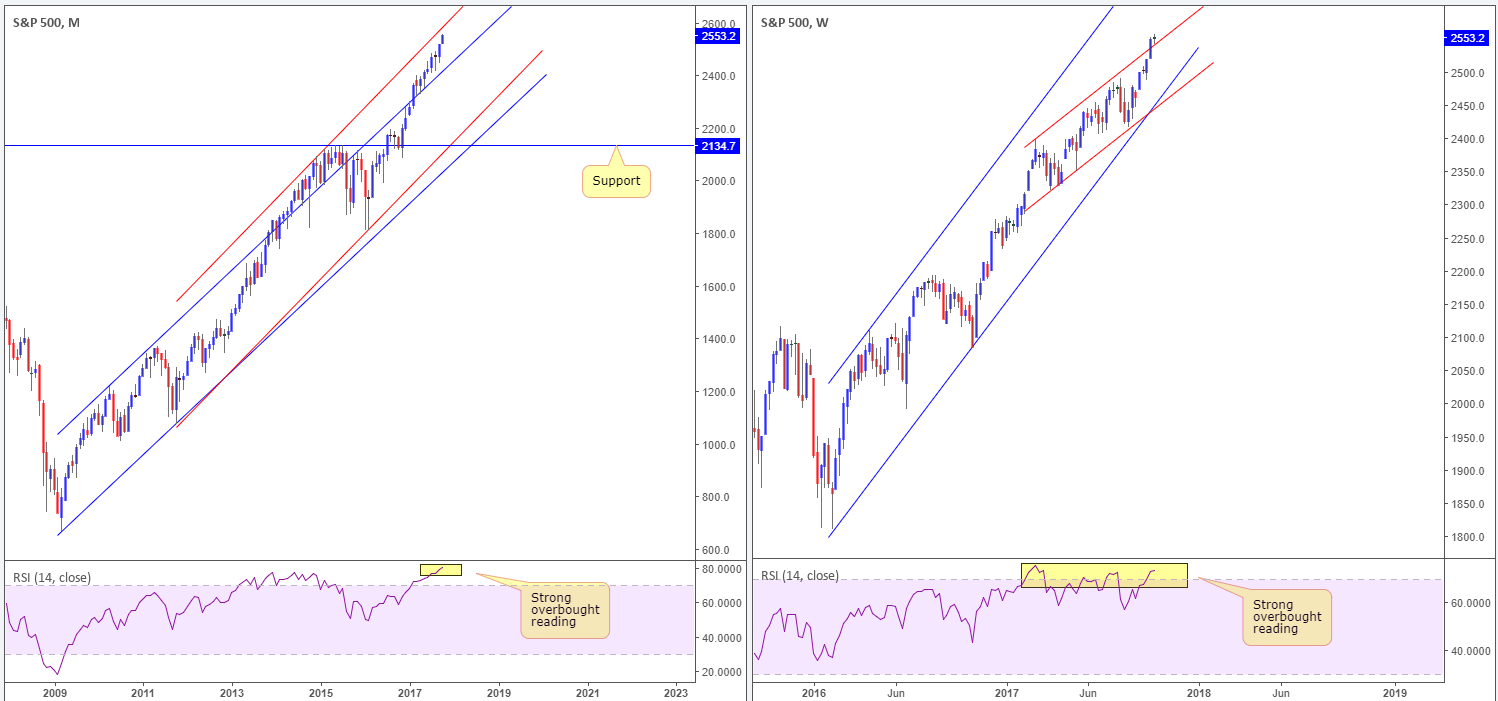
S&P500:
So far, October has seen US equities punch to a fresh high of 2557.7, registering its fifth consecutive weekly gain in what seems a never-ending uptrend.
The monthly timeframe shows the index is currently poised to challenge channel resistance (red) etched from the high 2093.6, coupled with a strong overbought RSI reading of 80.83. On the weekly timeframe, price recently ran through channel resistance (red) extended from the high 2401.0 and retested the line as support. In addition to this, weekly RSI has been overbought since Feb 2017.
Bias: Although last week’s candle was somewhat indecisive and both charts are seen highlighting (RSI) overbought conditions, structure shows room for price to extend gains in the coming weeks and connect with the aforementioned monthly channel resistance.
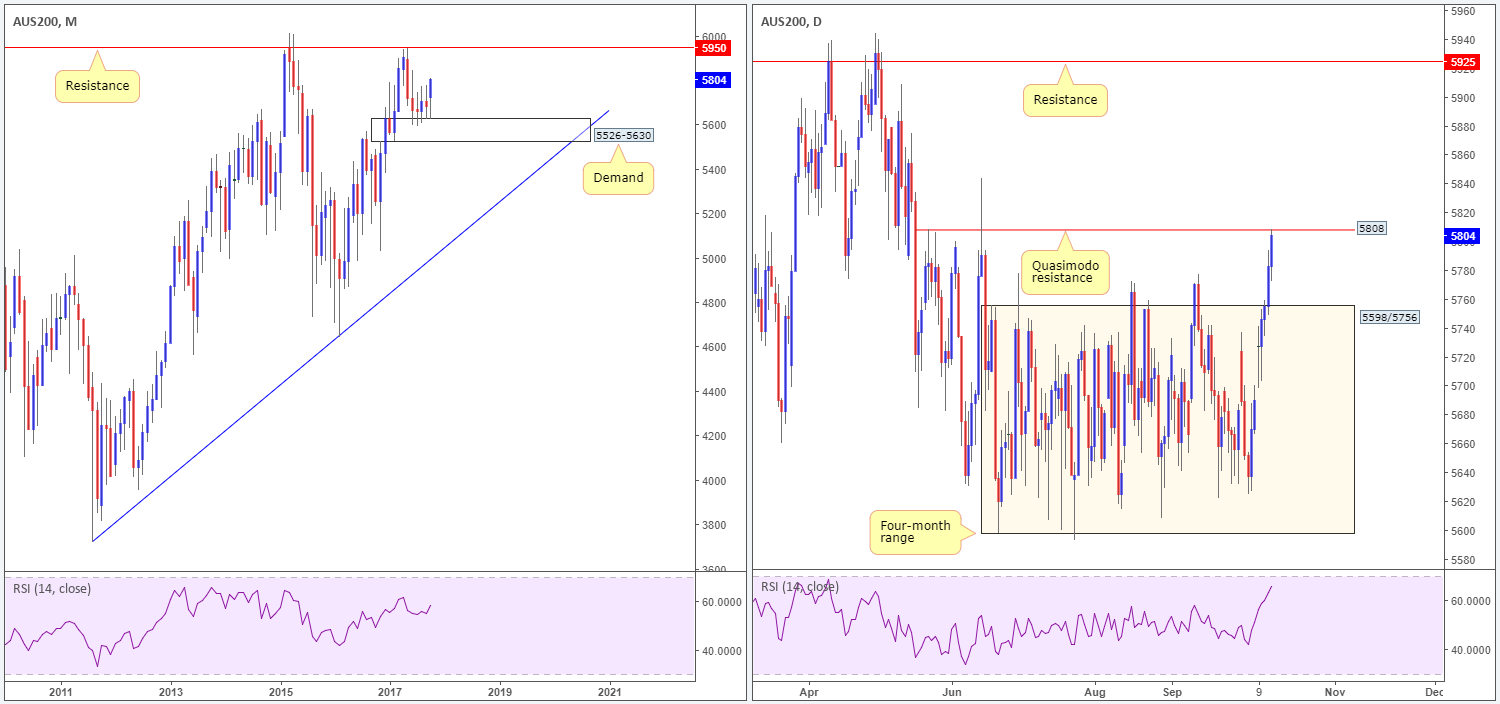
AUS200:
For the past four months, Aussie shares have been confined between 5598/5756 (see daily chart). Given that this consolidation formed around the top edge of a monthly demand area at 5526-5630, last week’s upside break should not really come as too much of a surprise. The week ended with the index kissing the underside of a daily Quasimodo resistance at 5808.
Bias: With monthly price showing room to press up to resistance at 5950, a break above the current daily Quasimodo resistance is a possibility this week.
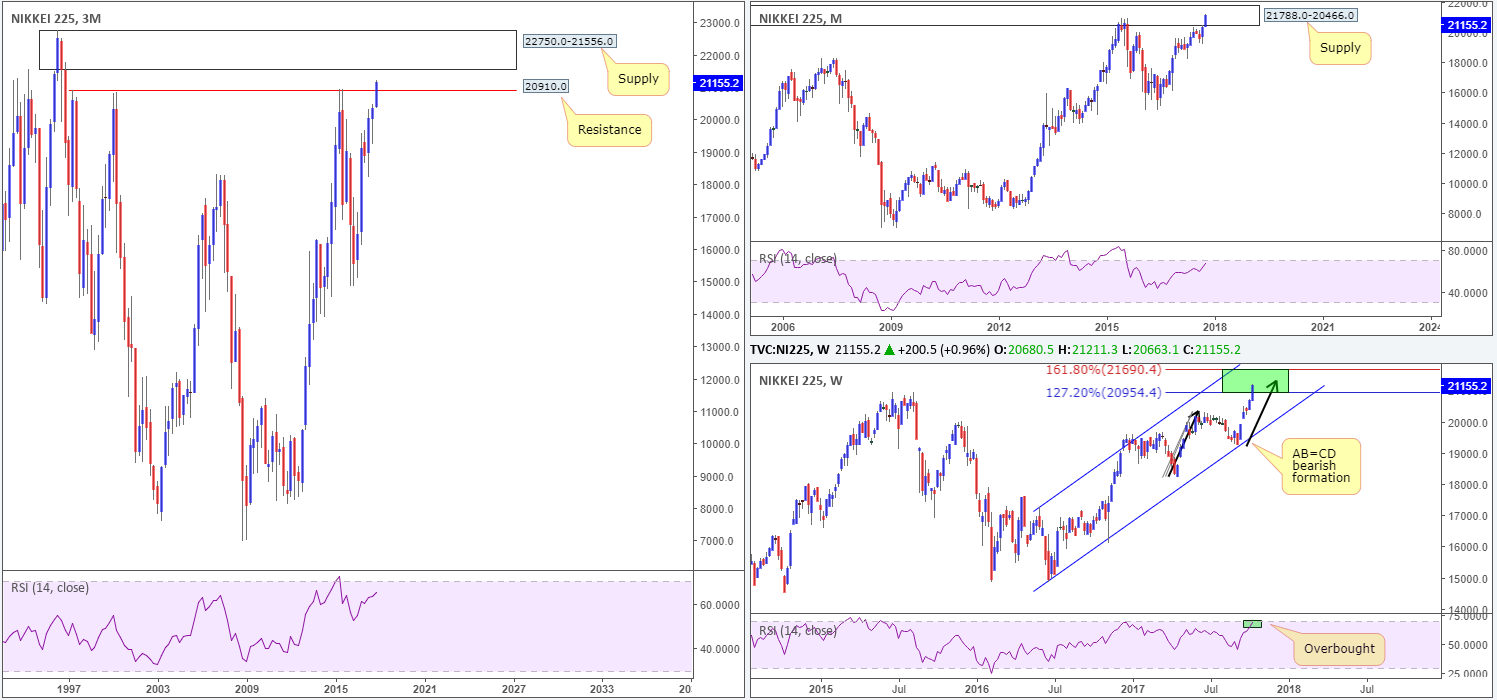
Nikkei225:
October has seen the Nikkei gain over 750 points thus far, tapping highs of 21211.3 – a price level not seen since 1997!
- On the 3 month timeframe, the recent push has helped the index cross beyond a clear-cut resistance at 20910.0. Directly overhead, however, is a supply coming in at 22750.0-21556.0.
- Monthly price entered into the walls of a supply base drawn from 21788.0-20466.0, with the RSI seen nearing the overbought line.
- Weekly action is currently trading within the confines of an AB=CD bearish reversal zone (green) at 21690.4-20954.4 taken from the low 18224.7, coupled with the RSI tapping the overbought 70.0 value.
Bias: May see a pullback in the near future. The current monthly supply not only boasts a strong history, it is also seen glued to the underside of the three-month noted supply zone, along with the aforementioned weekly AB=CD bearish pattern.
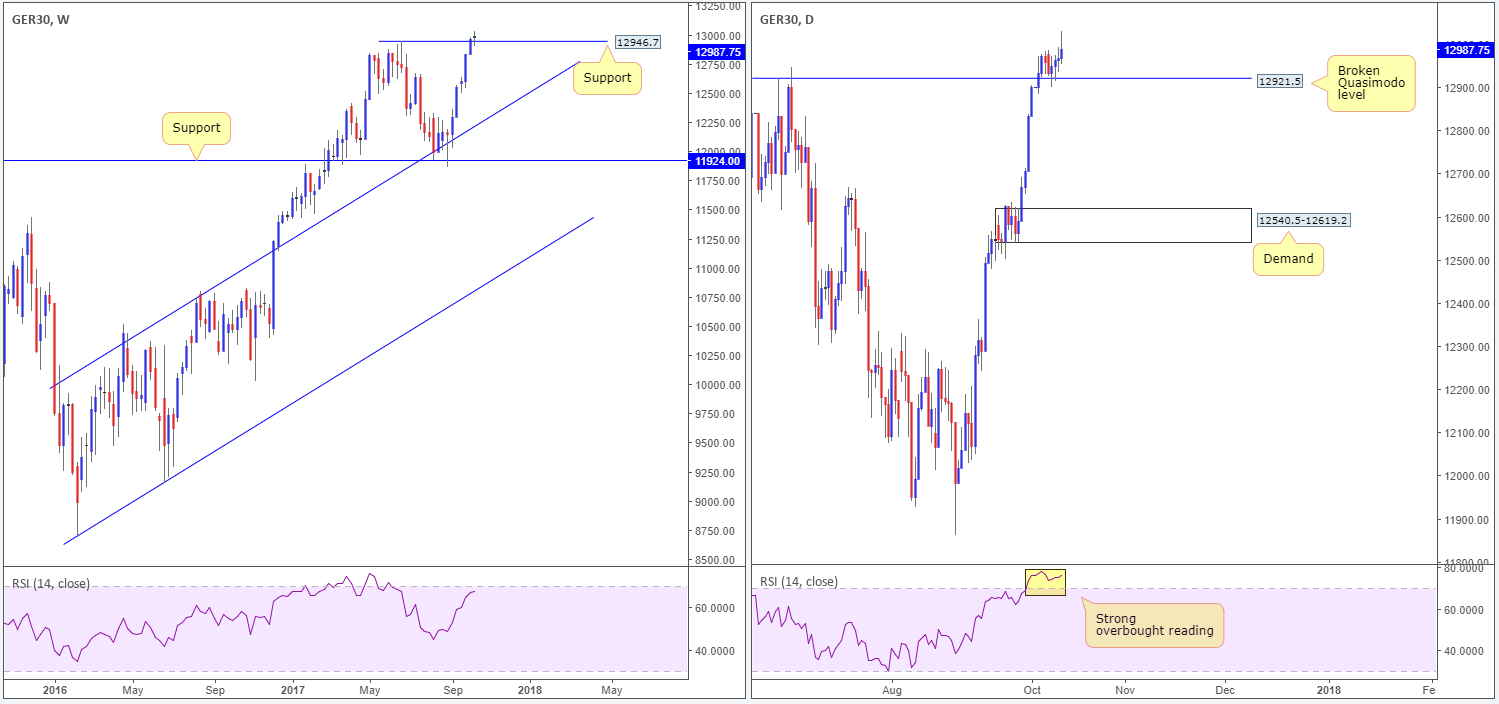
DAX 30:
Printing its sixth consecutive weekly gain, Germany’s stock market recently rose to fresh record highs of 13029.7. Should the index pullback, weekly support is positioned nearby at 12946.7, as is the broken daily Quasimodo line at 12921.5. RSI values show a strong overbought reading on the daily timeframe, with the weekly seen not too far behind.
Bias: Remains bullish above 12921.5. A daily close beyond here could lead to a move being seen down to daily demand printed at 12540.5-12619.2.
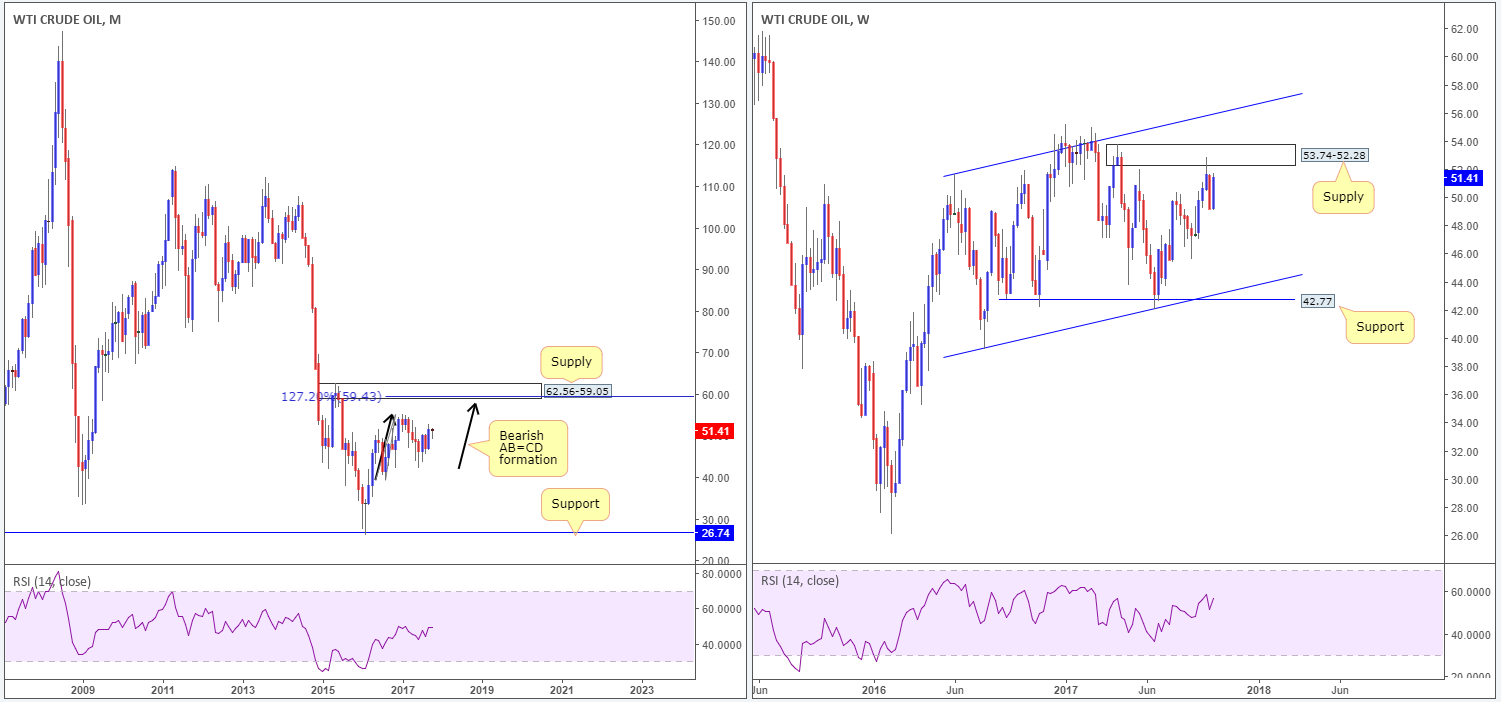
WTI Crude Oil:
Oil’s monthly timeframe shows price in the process of chalking up a bearish AB=CD formation that should, assuming the bulls continue to push higher, complete around the underside of a supply base at 62.56-59.05. Weekly structure on the other hand, is currently capped by supply seen at 53.74-52.28 and encased within an ascending channel (39.23/51.64).
Last week’s segment ended with price reversing the prior week’s losses, thus little change has been seen thus far in October.
Bias: Buying restricted by the said weekly structures. A break through these areas will lead price to the aforesaid monthly supply, which given the possible AB=CD approach, is prime for selling.
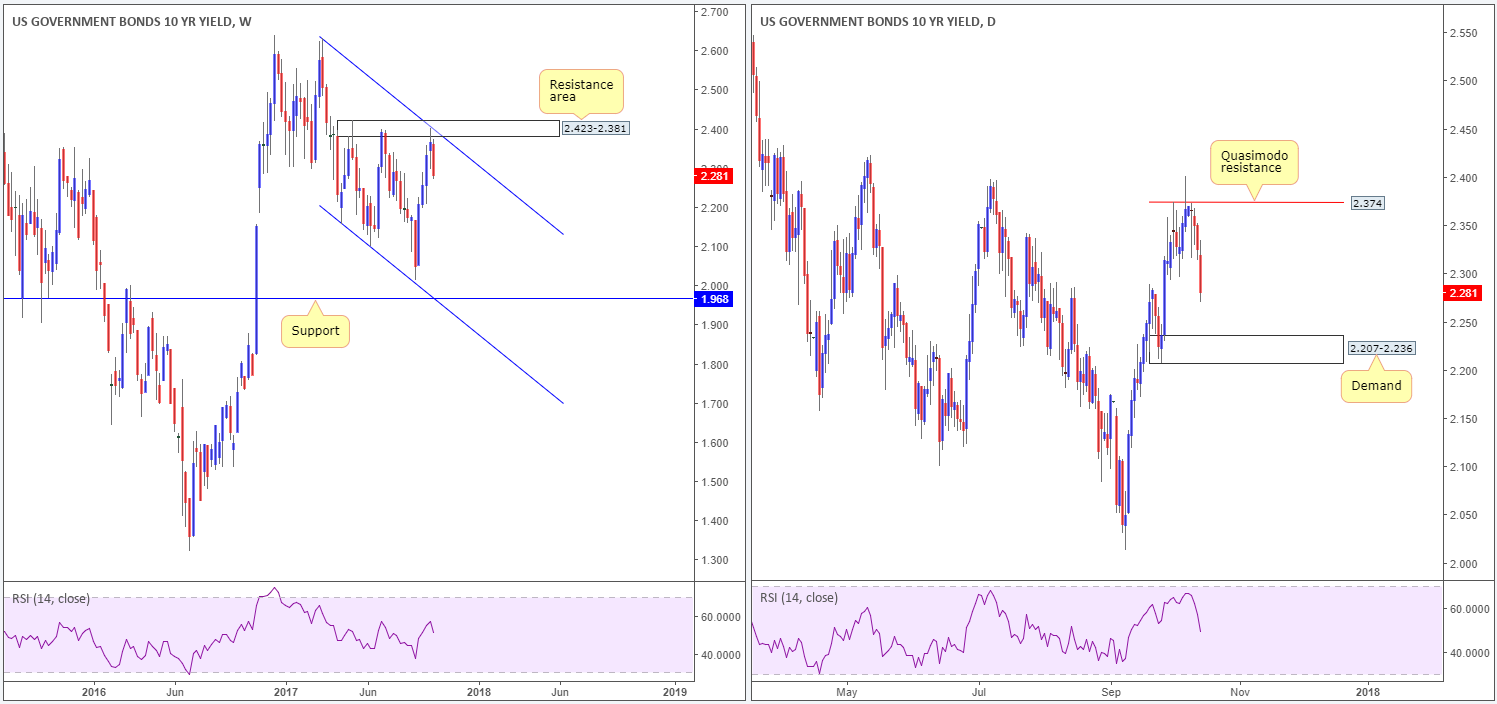
US 10-Year Treasury Yield:
After an impressive four-week run, US yields turned south last week and closed more than 8 basis points lower at 2.28%. According to the weekly timeframe, further selling could be seen in future trade down to as far as support coming in at 1.96%. While the daily picture also shows further downside may be on the cards, the next support target is seen a little closer at demand drawn from 2.207%-2.236%.
Bias: Near term, yields will likely continue pressing south. Expect the bulls to make an appearance at the noted daily demand. Time will tell whether weekly sellers intend on pushing down to the 1.96% neighborhood.
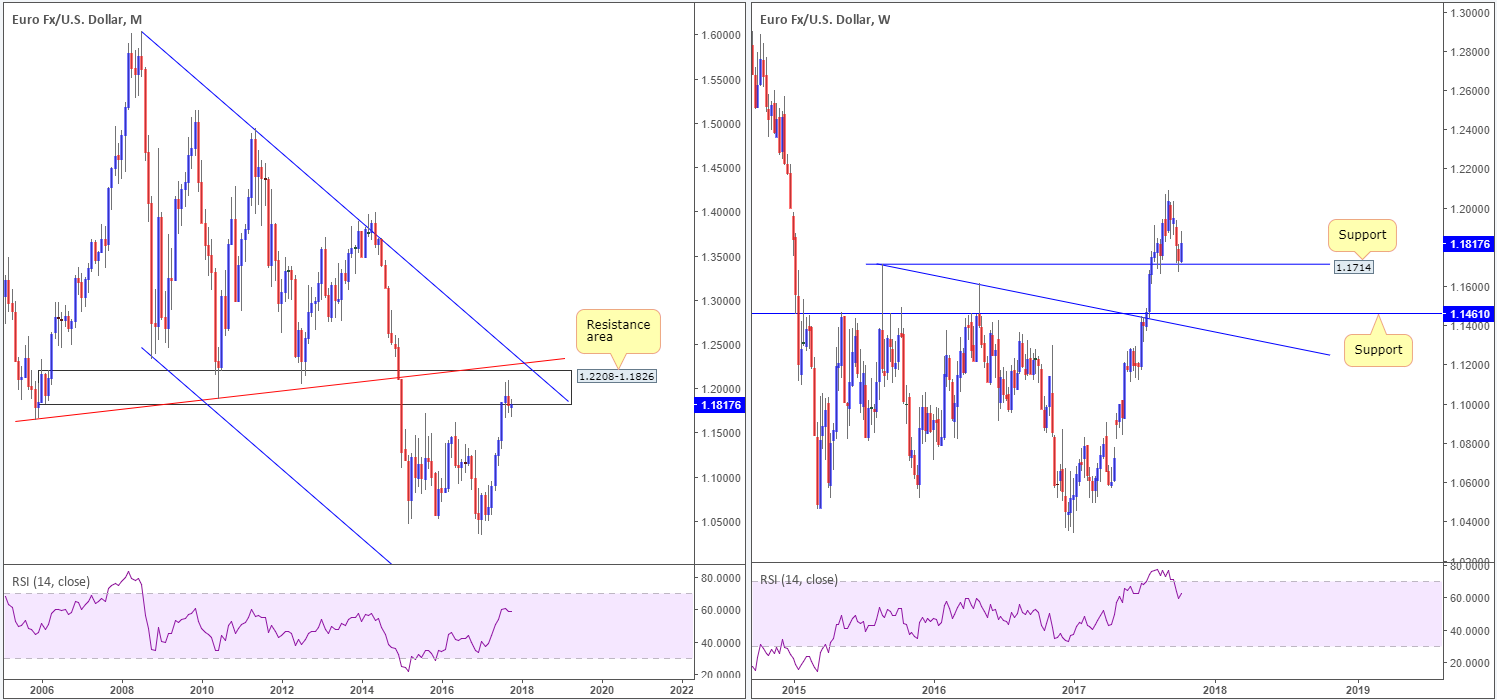
EUR/USD:
Along similar lines to the US dollar index monthly support at 92.29 (see above), monthly price on the EUR is capped by a resistance area penciled in at 1.2208-1.1826. A move lower from here would likely bring weekly price beyond current weekly support at 1.1714 into weekly support at 1.1461, which can also be seen on the monthly scale.
Bias: For the time being, the bears will likely remain in the driving seat given the history that the noted monthly resistance area claims. A break beneath the current weekly support would be a strong indication that further selling is on the horizon.
AUD/USD:
The past couple of months has seen the commodity currency challenge monthly resistance at 0.8065. Boasting a relatively strong history and also representing a minor monthly Quasimodo resistance (black arrow), this may force monthly price to test channel support extended from the low 0.6827. Despite this, the weekly bulls printed a strong recovery candle from a weekly support area at 0.7676-0.7759 last week, engulfing prior week’s losses and breaking a four-week bearish phase, as well as closing in the shape of a near-full-bodied candle.
Bias: In view of the upside push last week, the AUD/USD may, once again, attempt to attack monthly resistance in the coming weeks. However, it is unlikely that the monthly base will be engulfed this year.
It may also be worth noting that the next upside target on the weekly chart is a Quasimodo resistance that aligns perfectly with the noted monthly resistance.

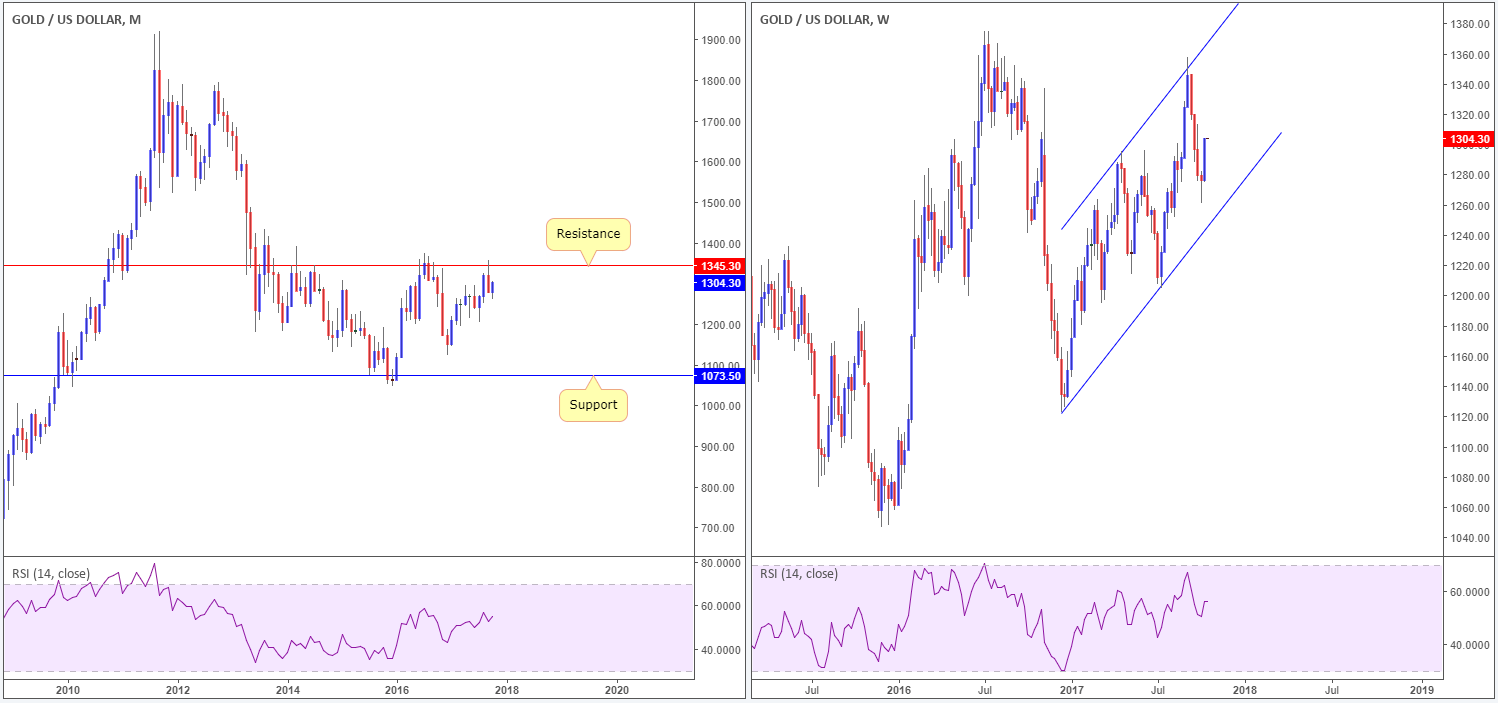
GOLD:
October has been relatively good to the yellow metal, almost reclaiming 50% of the prior month’s losses already. Before the bulls get too excited, it might be a good idea to note where monthly price came from: a strong-looking resistance level that has held the unit lower on numerous occasions since 2003! Meanwhile, weekly price is currently encapsulated within the walls of an ascending channel (1122.8/1295.4).
Bias: Despite a positive start to the month, the metal is likely heading lower in the long run. Not only because of the monthly resistance in play but also because of the major-league USDX monthly support at 92.29 (gold and the US dollar are typically inversely correlated). A break through the lower edge of the weekly channel will confirm this.