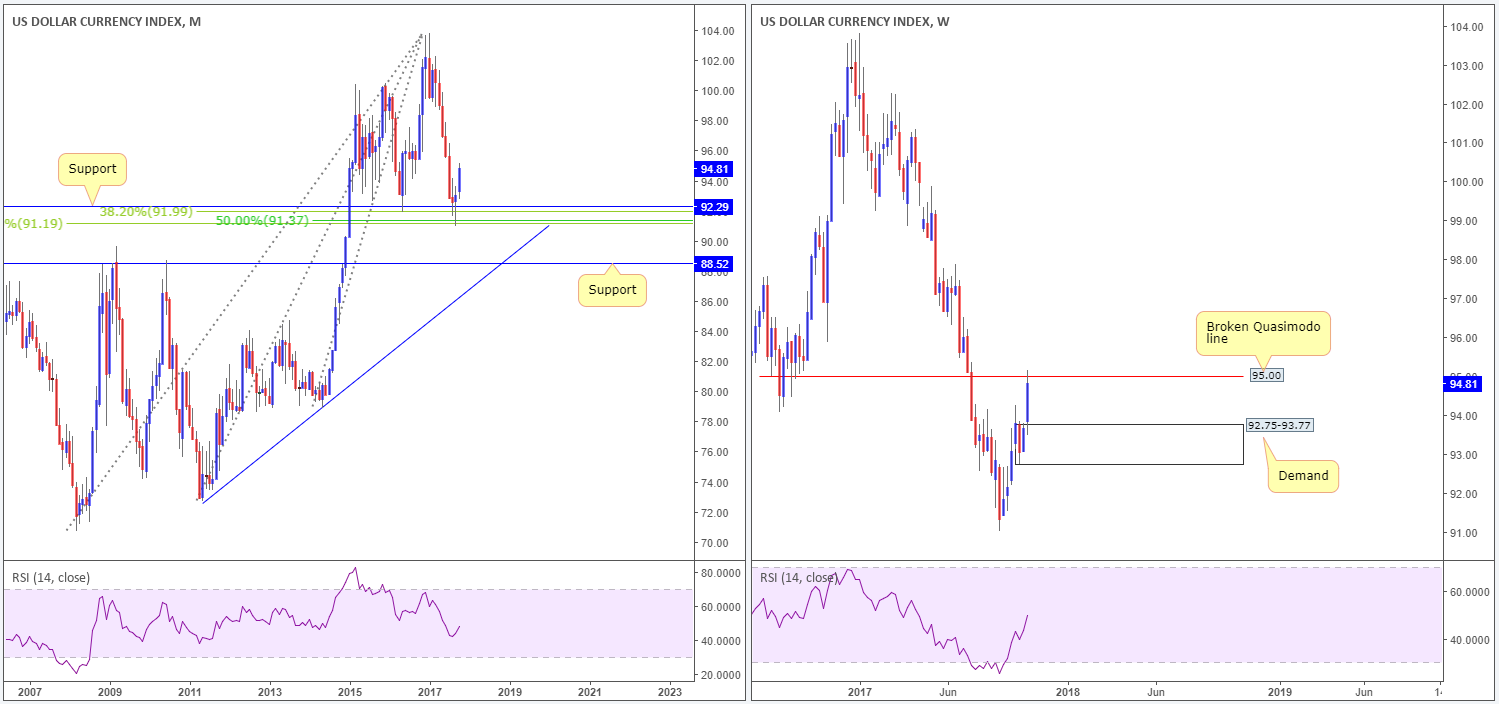
US dollar index:
October’s action shows that the US dollar extended September’s bounce from the monthly support at 92.29, consequently printing a near-full-bodied bullish candle. This support level is considered strong given that it merges with a nice-looking Fibonacci support cluster seen between 91.19/91.99.
Bouncing across to the weekly timeframe, it’s clear to see that there may be trouble ahead. Last week’s strong push to the upside brought the index into contact with a broken Quasimodo line at 95.00, which could result in price pulling back and challenging nearby demand at 92.75-93.77 in November.
Bias: Despite the recent bullish tone, the dollar will likely experience some resistance from 95.00.
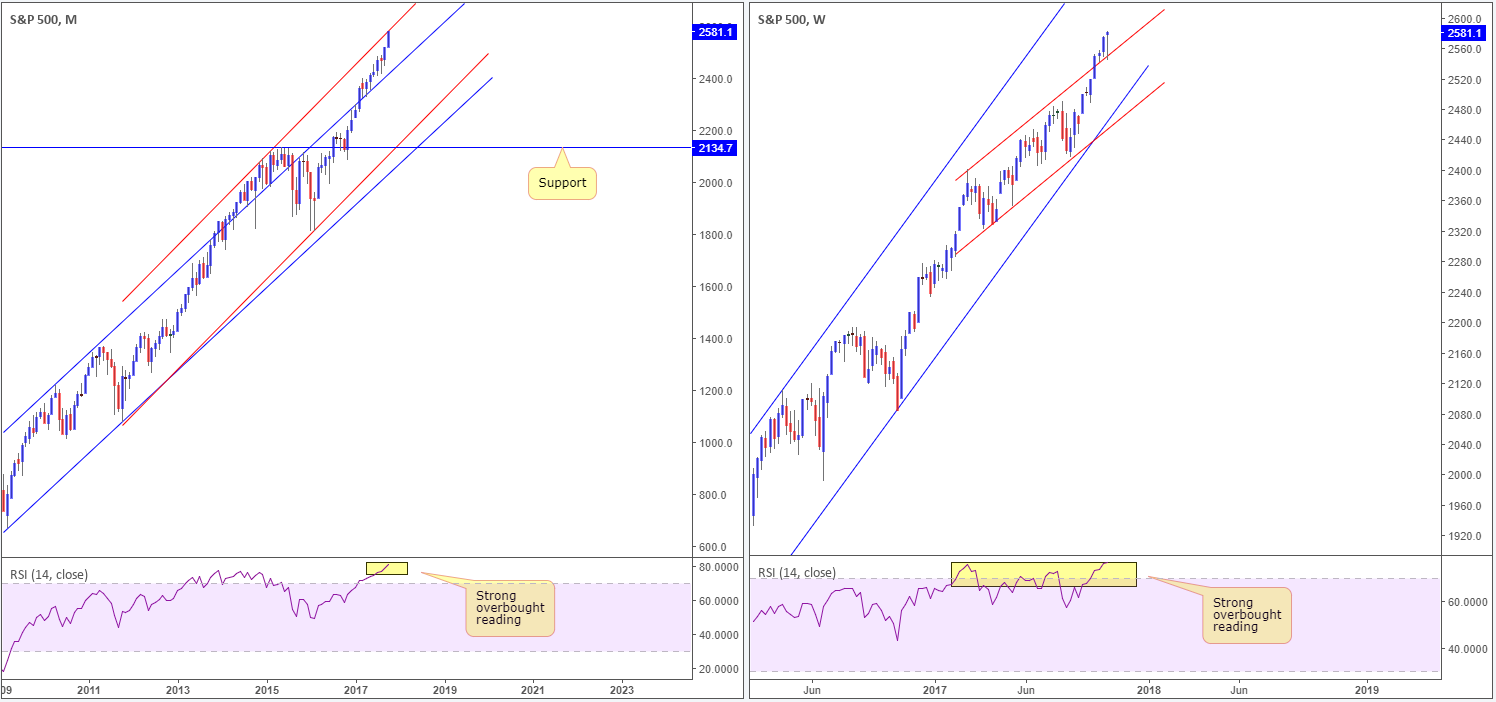
S&P 500:
October has seen US equities punch to a fresh high of 2,583.0, registering its seventh consecutive weekly gain in what seems a never-ending uptrend.
The monthly timeframe shows that the index is currently teasing the underside of a channel resistance (red) etched from the high 2093.6, coupled with a particularly strong overbought RSI reading. On the weekly timeframe, price recently ran through channel resistance (red) extended from the high 2401.0 and retested the line as support in the shape of a buying tail (pin bar). Also notable from this scale is weekly RSI has been overbought since Feb 2017.
Bias: Although last week’s bullish pin bar likely caught the eye of candlestick traders, buying this market, knowing that monthly flow is testing channel resistance, would be chancy.
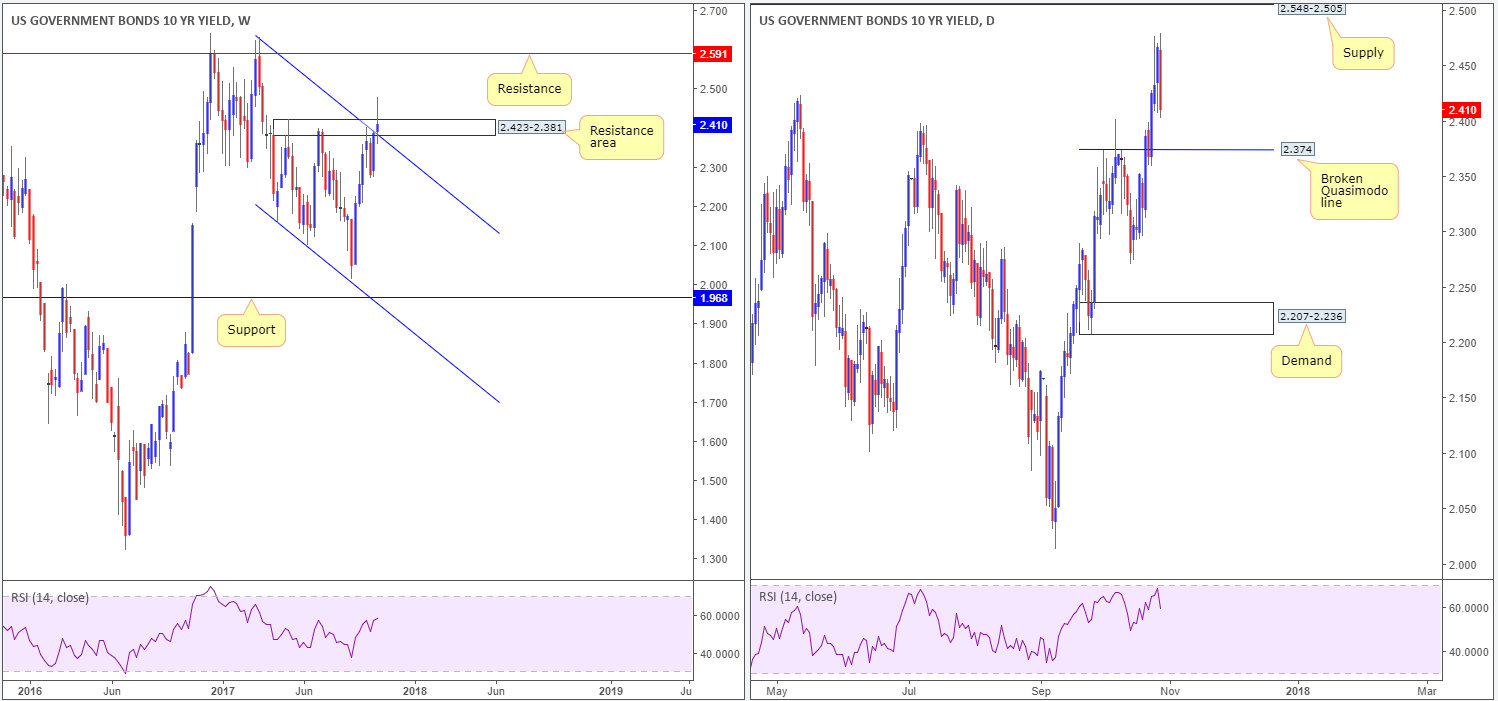
US 10-Year Treasury Yield:
Despite a brief pause seen around the underside of the weekly resistance area at 2.423%-2.381%, US yields resumed its upside trajectory going into the end of October. Reaching a high of 2.479% last week, stop-loss orders above both the weekly channel resistance (taken from the high 2.632%) and the noted weekly resistance area have likely been filled. The next upside target beyond these structures can be found at 2.591%: a weekly resistance level.
Over on the daily picture, the unit is currently caught between a broken Quasimodo line at 2.374% and a strong-looking supply at 2.548%-2.505%.
Bias: Near term, yields will likely test the aforementioned daily broken Quasimodo line. This is largely because of the strong bearish candle formed on Friday, which engulfed both Wednesday and Thursday’s action! Should this area hold ground, this could be an ideal spot to buy, targeting the noted daily supply, which is actually located just beneath the weekly resistance mentioned above at 2.591%.
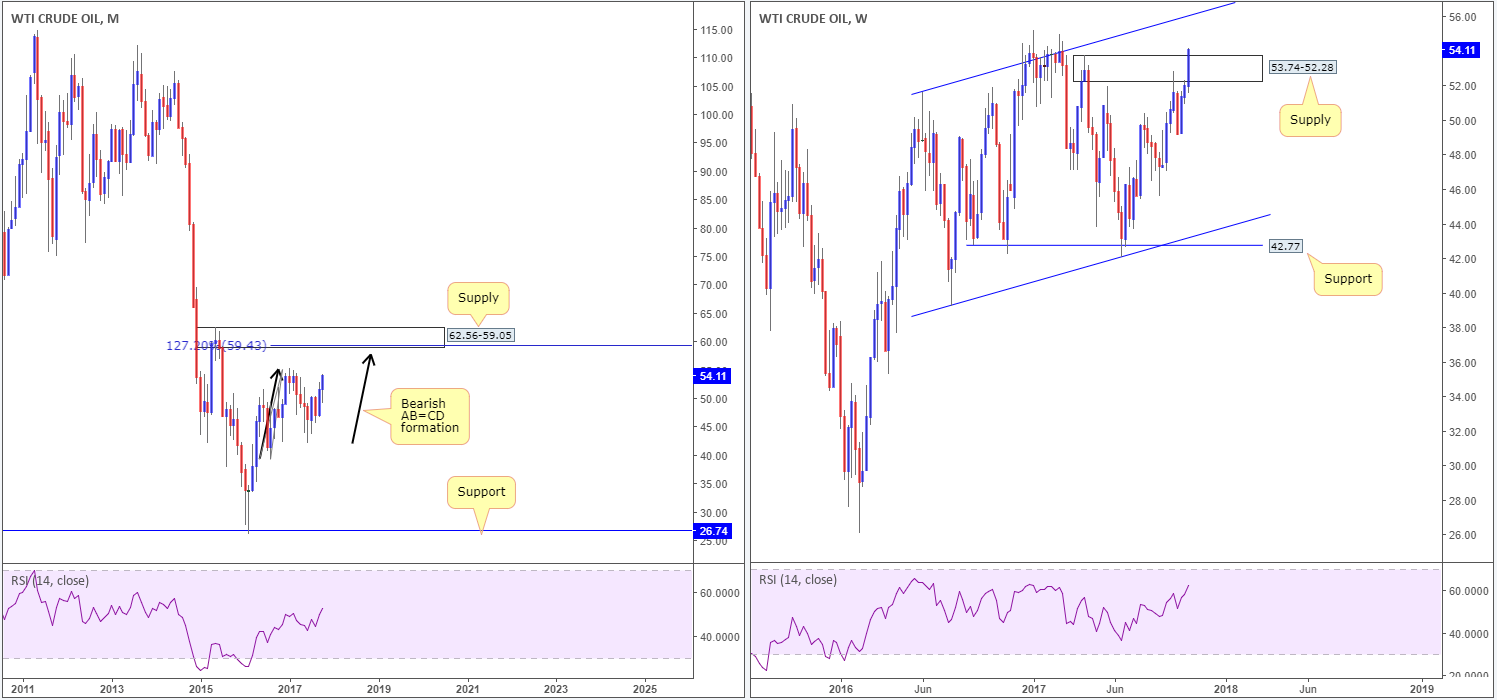
WTI Crude Oil:
WTI rose higher over the last couple of weeks, reaching a high of 54.16 on the month.
Monthly price, as you can see, is in the process of chalking up a bearish AB=CD formation that should, assuming the bulls continue to push higher, complete around the underside of a supply base at 62.56-59.05. Weekly structure on the other hand, recently ran through the top edge of supply seen at 53.74-52.28, forming a strong near-full-bodied bull candle. In the event that sellers are consumed here, WTI may look to cross swords with a channel resistance extended from the high 51.64 in upcoming trade.
Bias: Long-term buying is restricted by the said weekly channel resistance. A break through this area will also almost immediately lead price to the aforesaid monthly supply, which given the possible AB=CD approach, is prime for selling.
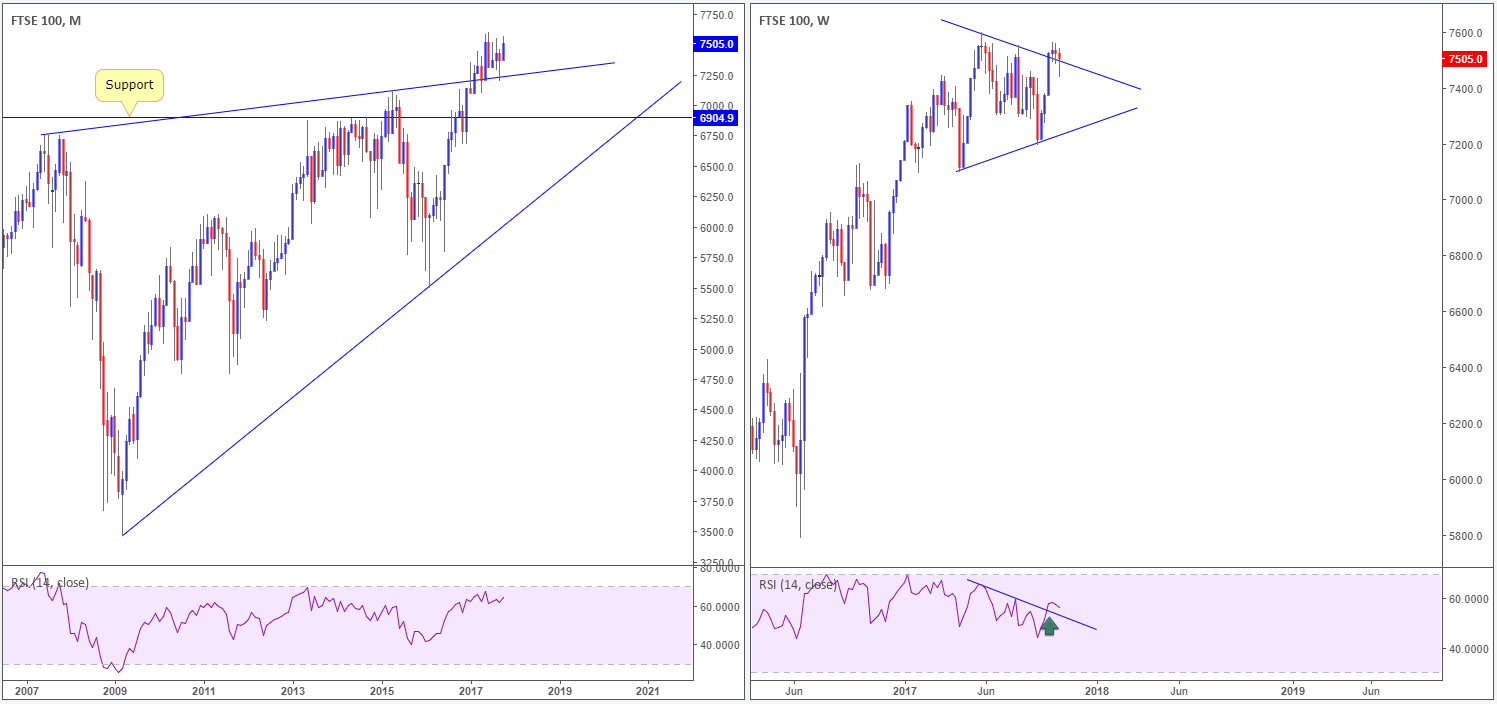
FTSE 100:
UK shares are effectively unchanged over the last two weeks.
Monthly technicals show price recently bounced off a trendline support etched from the high 6754.1, with little resistance in view. In support of this, weekly price is also seen reinforced by the top edge of a recently broken pennant taken from the high 7599.0. Also important on this scale is the RSI trendline break (green arrow) and last week’s buying tail.
Bias: With little technical resistance on the horizon, the FTSE will likely be tapping fresh record highs in the near future.
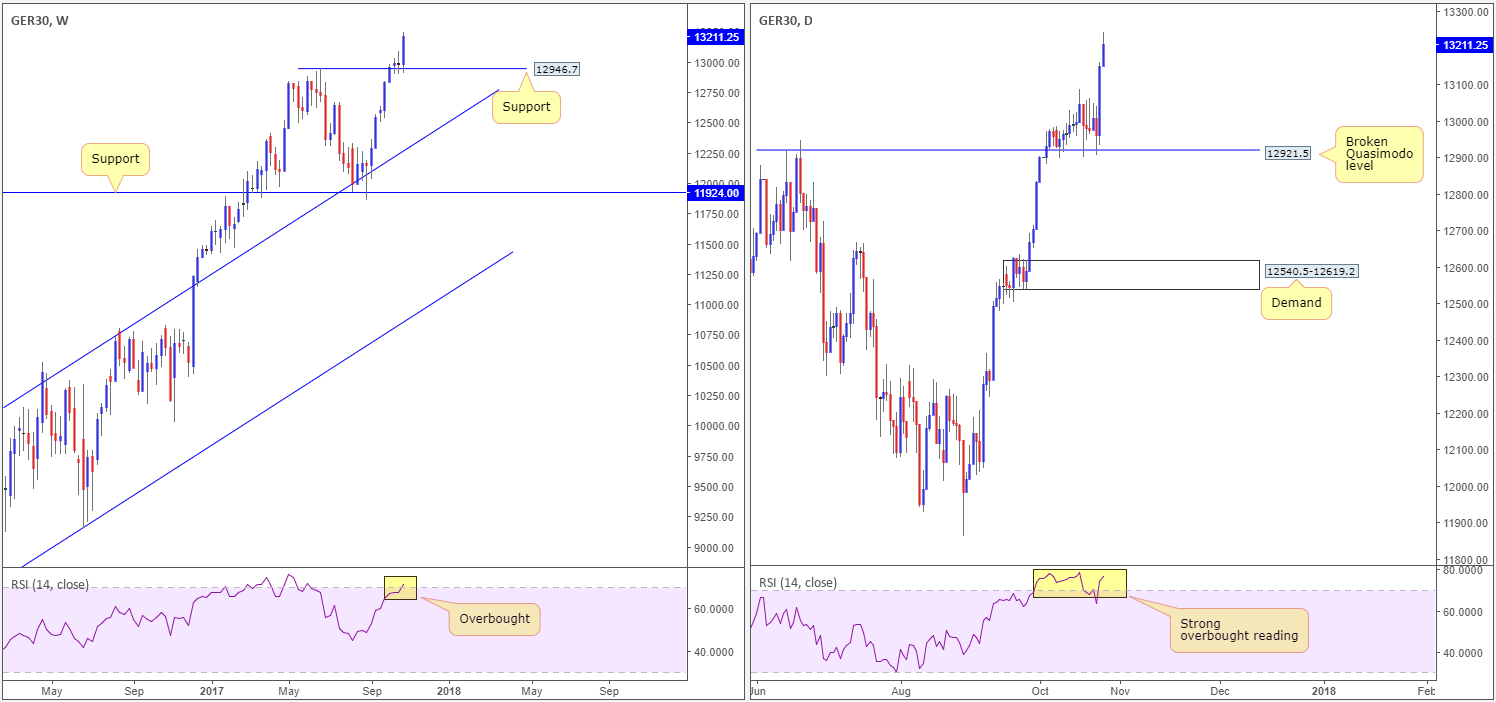
DAX 30:
German shares rose to a fresh record high of 13243.5 last week, following two weeks of indecision just above weekly support at 12946.7. The move was influenced by the ECB’s recent dovish tone, and also bolstered by a broken daily Quasimodo support seen at 12921.5. RSI values show strong overbought readings on both timeframes.
Bias: Remains bullish above 12921.5.
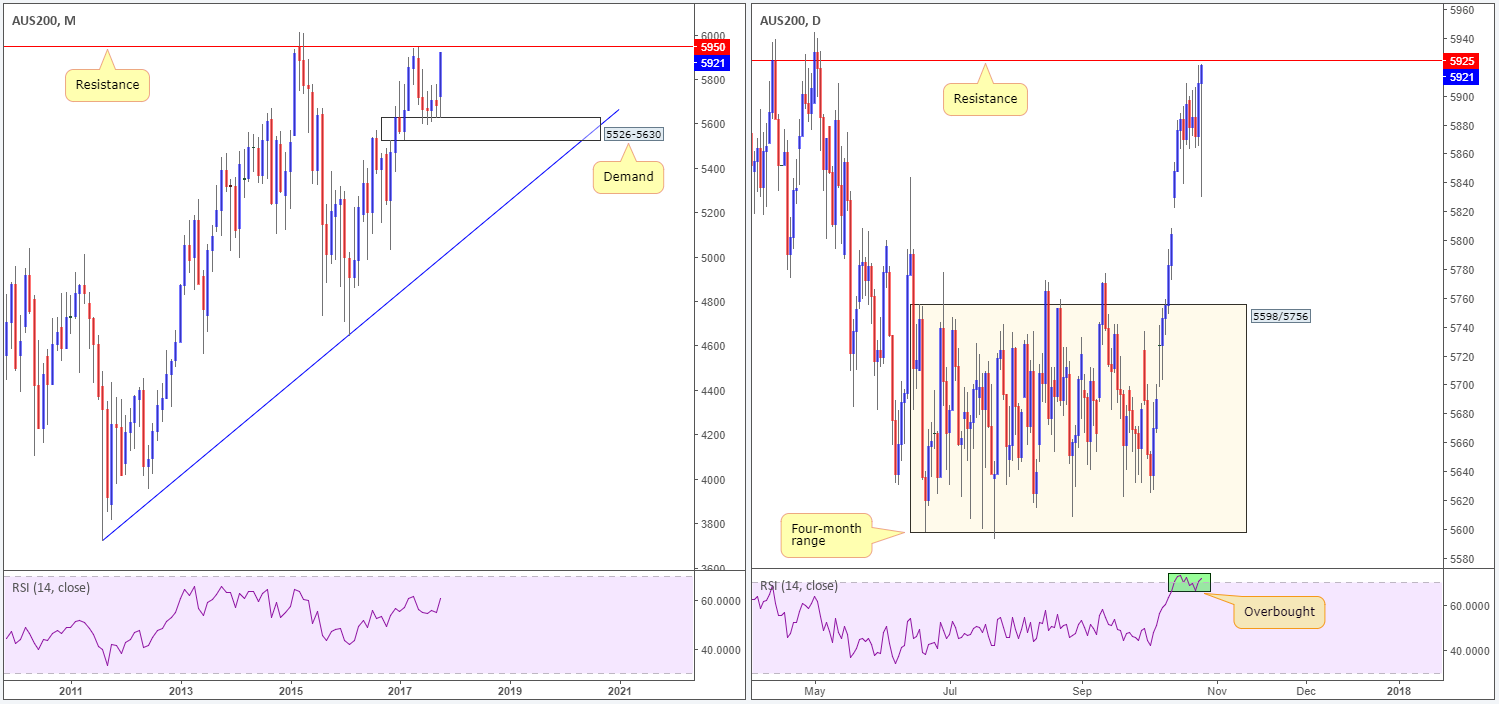
AUS 200:
After four months of consolidation around the top edge of a monthly demand at 5526-5630, Australian shares have been exceptionally bullish in October, consequently printing a full-bodied bull candle. The flipside to this is the unit is now seen trading within striking distance of both a daily resistance pegged at 5925 and a monthly resistance seen just above it at 5950, as well as the daily RSI emphasizing overbought conditions.
Bias: Given the nearby noted resistances on the radar, the unit could be met with selling pressure as we move into November.
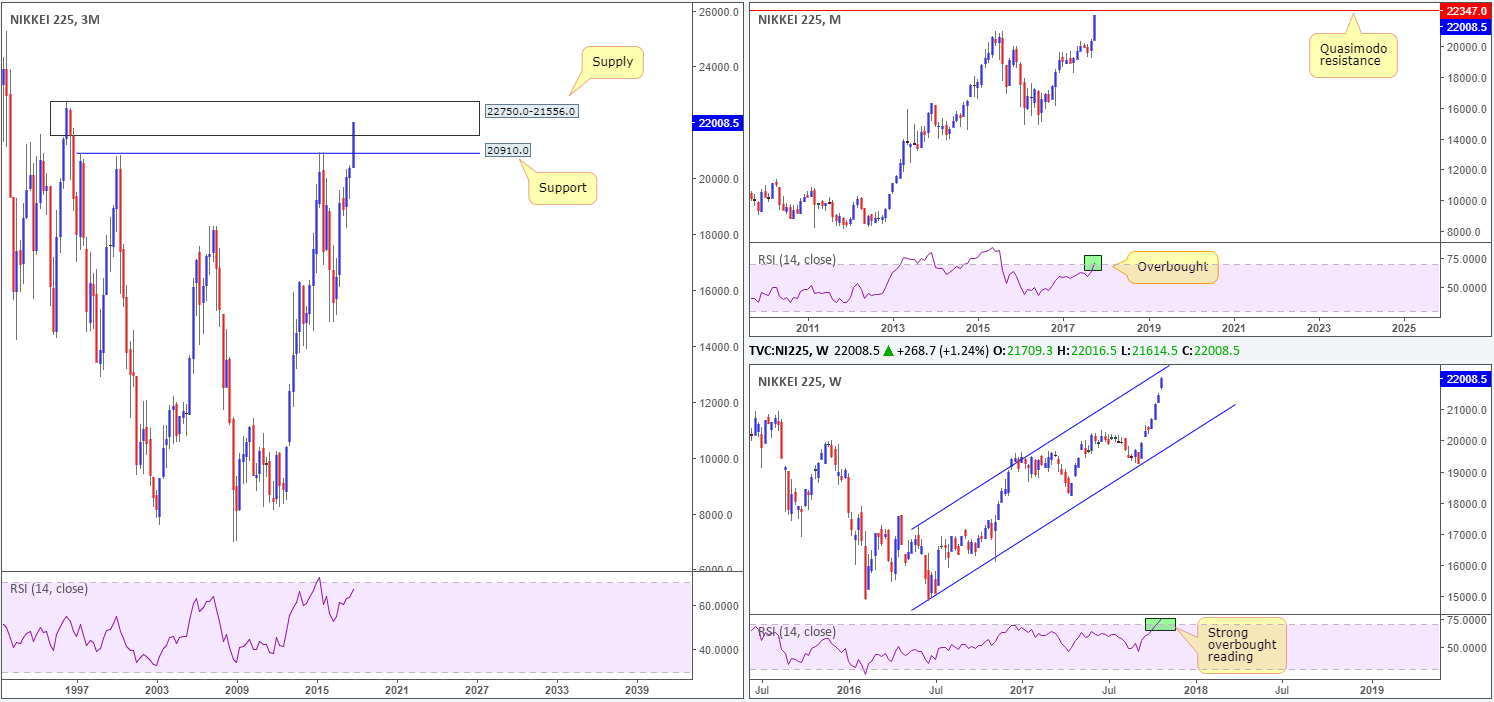
Nikkei 225:
Japan’s Nikkei has been on a tear during the month of October, up a staggering 8.12%. Reaching highs of 22016.5 last week – a price level not seen since 1997 – the index is now facing considerable long-term resistances.
- On the 3 month timeframe, the recent push has forced price into the walls of a muscular supply coming in at 22750.0-21556.0.
- Monthly price looks poised to challenge a Quasimodo resistance at 22347.0, with the RSI seen tapping the overbought line.
- Weekly action is seen trading within shouting distance of a channel resistance taken from the high 17251.4, coupled with the RSI recording a strong overbought reading.
Bias: The Nikkei may see a pullback in the near future, as the noted monthly and weekly resistances converge nicely within the aforesaid 3-month supply zone.
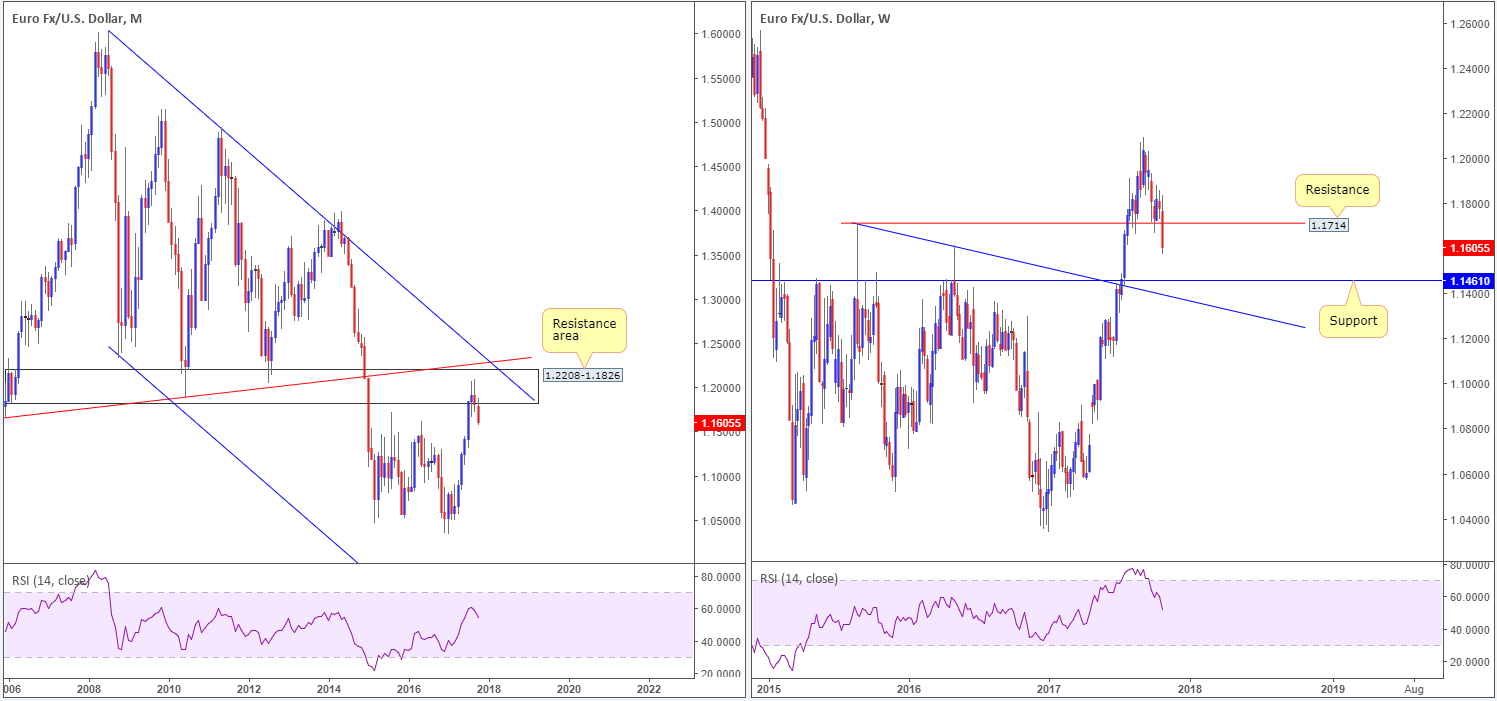
EUR/USD:
The single currency is on track to register its second consecutive monthly loss, largely due to dollar strength (see USDX chart above).
Along similar lines to the US dollar index monthly support at 92.29, monthly price on the euro is capped by a resistance area penciled in at 1.2208-1.1826. Further selling from this neighborhood would likely bring weekly price down to shake hands with support at 1.1461 (also visible on the monthly scale).
Bias: For the time being, the bears will likely remain in the driving seat given the history that the noted monthly resistance area claims. It’ll be interesting to see the direction the pair takes once/if weekly support at 1.1461 is brought into the fray.
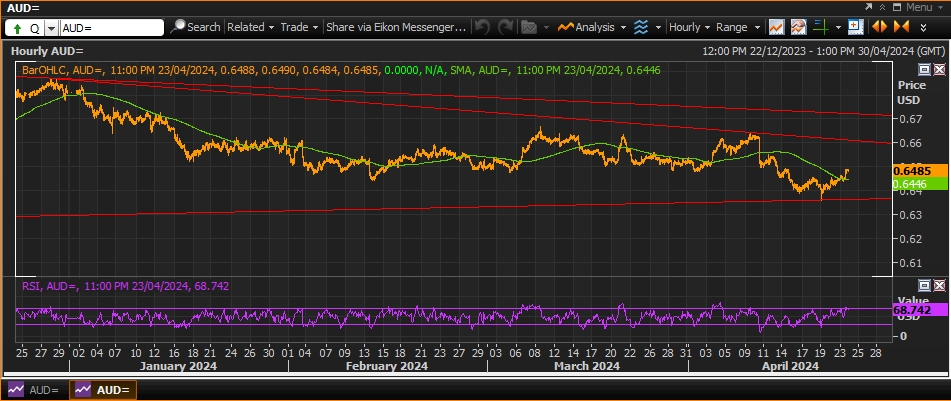
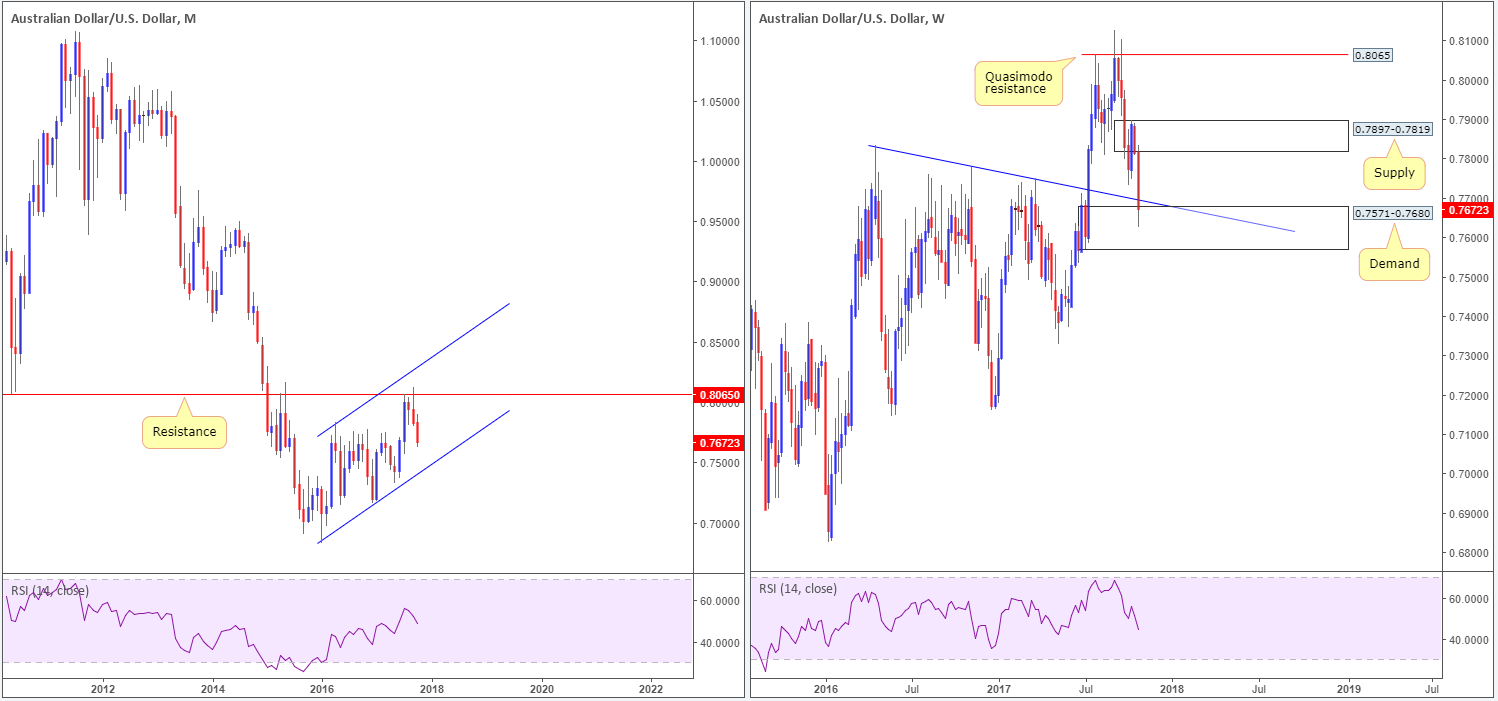
AUD/USD:
The past couple of months saw the commodity currency fall sharply from monthly resistance at 0.8065. From a technical standpoint, further selling could still be on the cards as the next downside target on this scale does not come into vision until the channel support extended from the low 0.6827. On the other side of the field, however, weekly demand at 0.7571-0.7680 was brought into play last week. Boasting strong momentum and a solid base which fuses closely with a trendline support taken from the high 0.7835, there’s a chance that buyers may make an appearance from here as trade moves into November.
Bias: Buyers will likely attempt to make a stand from the aforementioned weekly demand early November, and may even challenge weekly supply seen overhead at 0.7897-0.7819. Overall though, the pair is likely headed lower at least until the monthly channel support is in the game.
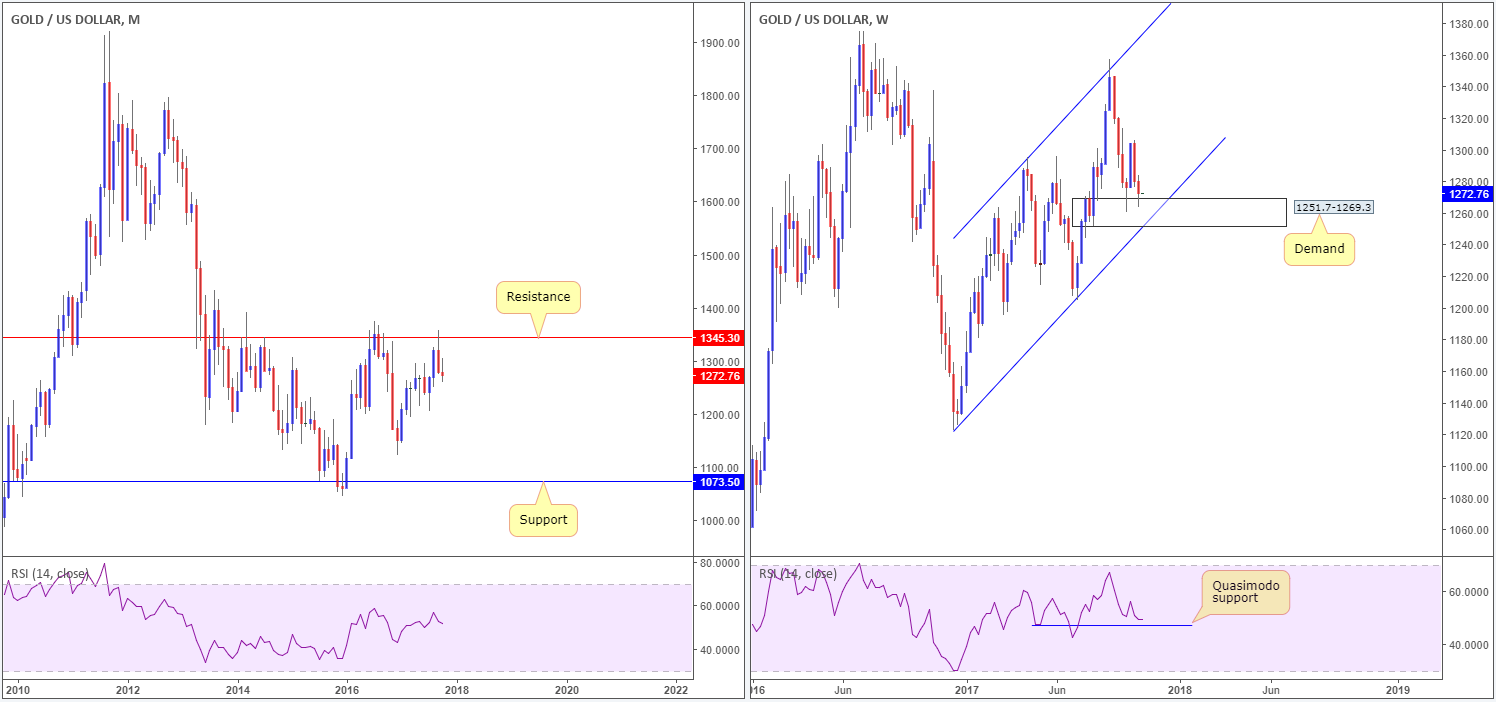
GOLD:
Despite an earnest attempt from the bulls to lift the yellow metal higher at the beginning of October, gold is down 0.49% on the month. This is likely due to where monthly price came from: a strong-looking resistance level that has held the unit lower on numerous occasions since 2003! Meanwhile, weekly price is currently encapsulated within the walls of an ascending channel (1122.8/1295.4), using the top edge of a demand area at 1251.7-1269.3 as support at the moment.
Bias: The broken weekly Quasimodo line at 95.00 on the USDX weekly chart will likely hold the price of the dollar lower in the near term. Consequent to this, upward pressure could be seen in the gold market, meaning the current weekly demand may continue to hold ground in upcoming trade. Also noteworthy is the Quasimodo support line seen lurking just below current price on the weekly RSI.
Economic indicators to watch today:
Times based on GMT –
7am
- German retail sales m/m (prior -0.2% – expected: 0.5%).
8am
- KOF leading indicator (prior 105.8 – expected: 106.6).
9.30am
- UK consumer credit (prior 1.583B – expected: 1.5B).
- UK mortgage approvals (prior 66.58K – expected: 66K).
12.30pm
- US core PCE price index m/m (prior 0.1% – expected: 0.1%).
- US personal spending m/m (prior 0.1% – expected: 0.8%).
Central bank action scheduled this week:
Tuesday, Oct 31
2am
- BoJ interest rate decision.
3am
- BoJ outlook report.
3.50am
- BoJ monetary policy statement.
6.30am
- BoJ press conference.
7.30pm
- BoC Gov. Poloz due to testify before the House of Commons Standing Committee on Finance.
Wednesday, Nov 1
5.15pm
- CHF Gov. Board member Zurbrugg due to deliver a speech at the University of Bern.
6pm
- FOMC statement and federal funds rate decision.
8.15pm
- BoC Gov. Poloz due to testify before the Standing Senate Committee on banking, trade and commerce.
Thursday, Nov 2
12pm
- BoE inflation report.
- MPC official bank rate votes.
- BoE monetary policy summary.
- BoE official bank rate.
- BoE asset purchase facility.
- MPC asset purchase facility votes.
12.30pm
- BoE Gov. Carney due to hold a press conference about the inflation report.
- FOMC member Powell due to deliver opening remarks at an event hosted by the Federal Reserve Bank of New York.
Friday, Nov 3
- FOMC member Kashkari due to speak about monetary policy.