In the right hands, moving averages (MAs) are an exceedingly influential approach. Statisticians categorise moving averages as part of a family of tools for time series analysis.
Technical analysts employ moving averages to smooth data over time, allowing a clearer interpretation of the underlying trend. Moving averages are particularly potent in markets that have a tendency to trend.
Undeniably, moving averages have stood the test of time and remain a fan favourite within the technical community.
The simple moving average (SMA)
The SMA, like most moving averages, base calculations on closing prices. Calculating based on highs, lows and daily means, or any other consistent value, however, is also possible.
Sometimes referred to as an arithmetic moving average, the SMA is the most commonly used base in technical analysis. Calculated by summing a set of equally weighted data points, and then dividing the value by the number of observations in the period, it offers a single value representing a net of pre-determined past values.
To calculate a 3-day SMA, with previous data points of 80.62, 80.65 and 81.02, is straightforward. Simply sum the three previous values – which equates to 242.29 – and divide the resulting value by 3, giving a mean of 80.76. Fortunately, traders do not have to perform this calculation manually as most modern trading platforms compute moving average values automatically. Still, it’s always good to know the dynamics behind the indicator’s function.
The linearly weighted moving average (LWMA)
Unlike the SMA that applies an equal weighting to each data point, a linearly weighted moving average (LWMA) applies more weight to recent price figures. This is useful if a trader notes recent observations encompass more pertinent information than earlier values.
A 3-day LWMA, a relatively straightforward calculation, forms its value by multiplying the 3rd data point by 3 – this is the most recent observation. The 2nd value is then multiplied by 2 and the 1st by 1. The total is summed and then divided by the sum of all the multipliers; in this case it is 6 (3+2+1). Using the same data points as the SMA calculation, with 81.02 representing the most recent value, the trader multiplies 3 by 81.02, 2 by 80.65 and 1 by 80.62. Take this value (484.98) and divide by 6 to get a LWMA of 80.83.
To perform rolling calculations for each successive day, both the SMA and LWMA drop off their earliest data point and replace it with the more recent observation.
The exponential moving average (EMA)
For some traders, dropping off earlier data, which could represent substantial market action, is difficult as it may unduly affect the moving average’s calculation – referred to as the drop-off effect. To address this issue and maintain earlier information, as well as adding more weight to recent data, traders generally opt for the exponential moving average (EMA).
The calculation is slightly more complex. The first step is to find the current weighting factor, which is applied to the most recent data point. For this example, using a 3-day EMA, the weight selected is 2, calculated as (2 / [3 + 1]), where 3 represents the number of days averaged and 2 signifies the weight applied. The calculation gives a 50% weighting (2 / 4 = 0.5) to the most recent value. The formula for generating the weight given to the EMA, however, calculates as 100% – current weight (50%), consequently allocating a 50% weight to the EMA.
Using a closing price of 80.90 and a previous EMA value of 81.02, the EMA calculates as follows:
EMA day 3 = Current weight (.50) * Closing price (80.90) + EMA weight (.50) * Previous EMA value (81.02) = 80.96
To calculate the EMA for the next day, only two data points are required: the previous EMA value and the current closing price. In a rolling calculation, the current weight and EMA weight remain unchanged.
The Wilder Method (WM)
Used to calculate the average true range (ATR), the relative strength index (RSI) and the directional movement indicator (DMI), Wilder’s moving average, also weighs on the most recent data, calculates as follows:
3-day WM = (3-1) * (Previous MA) + (Current close) / 3
Moving average trading strategies
Trend identification
Some traders, particularly those new to the business, favour moving averages as a way of identifying a trending market, or one potentially on the verge of reversing. When price action crosses above/below the selected moving average, a possible trend change is in store.
Although the calculations in this article denote a short-term 3-day moving average, time periods vary. The 200-day moving average is common, as are the 50 and 20-day moving averages. The longer the time period, the more data points included in the calculation and, therefore, a smoother average is visible. However, this also increases the lag time behind price movement. Moving averages are lagging indicators as the calculation bases its value on past prices; the longer the time period for the moving average, the greater the lag.
Figure 1.1 displays the daily price chart for crude oil (WTI). In early October, 2017, the market broke above its 200-day SMA and provided a bullish signal, and remained trending until October, 2018. Like all technical indicators, moving averages also generate false signals. Prior to the large said trend, several false signals occurred. This, unfortunately, is typical of a trend trading strategy. Traders who look to ride trends usually incur several false signals prior to witnessing a fat tail trend, which should erase prior losses and add gains.
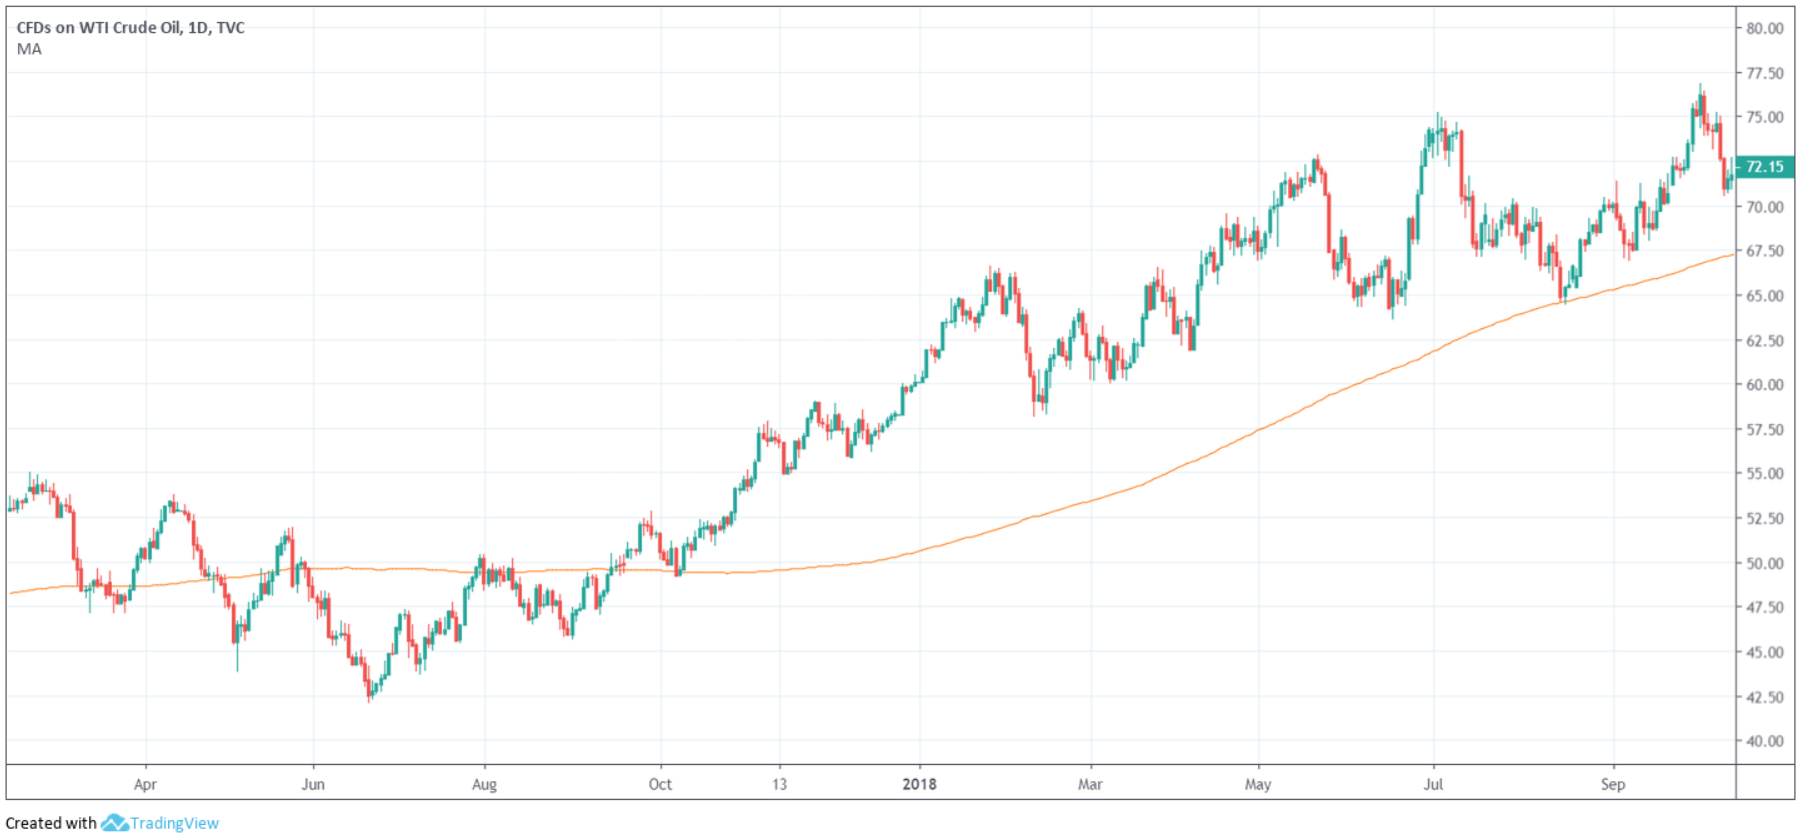
(FIGURE 1.1)
Entry confirmation – the moving average crossover
Alongside trend identification, moving averages are used as a means of entry confirmation. Having two moving averages crossover provides reliable buy and sell signals.
Long-term traders tend to opt for a 200/50 period setting (also known as the Golden Cross for an upside cross and Death Cross for downside penetration), while intraday (shorter-term traders) target lower settings in the range of 50/20. When the faster moving average crosses above/below its slower counterpart; a signal to engage is presented.
Like all moving averages, though, healthier signals are found in trending environments, offering potentially lucrative risk/reward opportunities. Using the ADX indicator alongside the crossover method remains a popular strategy – the ADX helps recognise optimal trending environments suitable for moving average crossovers.
Figure 1.2, the M15 intraday chart of crude oil, demonstrates the effectiveness in catching profitable moves using a 50/20 period SMA system. The 23rd saw the 20-period SMA (orange) cross above the 50-period SMA (blue) to confirm a potential buying opportunity, followed by an advance. The market then entered a ranging phase with the 20-SMA crossing back beneath the 50-SMA, providing a signal to exit the long. Another long signal came shortly after on the 24th with an exit signal seen at the close of trade for a profit. Essentially, if you were to simply follow crossovers – a stop/reverse system – an active position would continuously be present in the market.
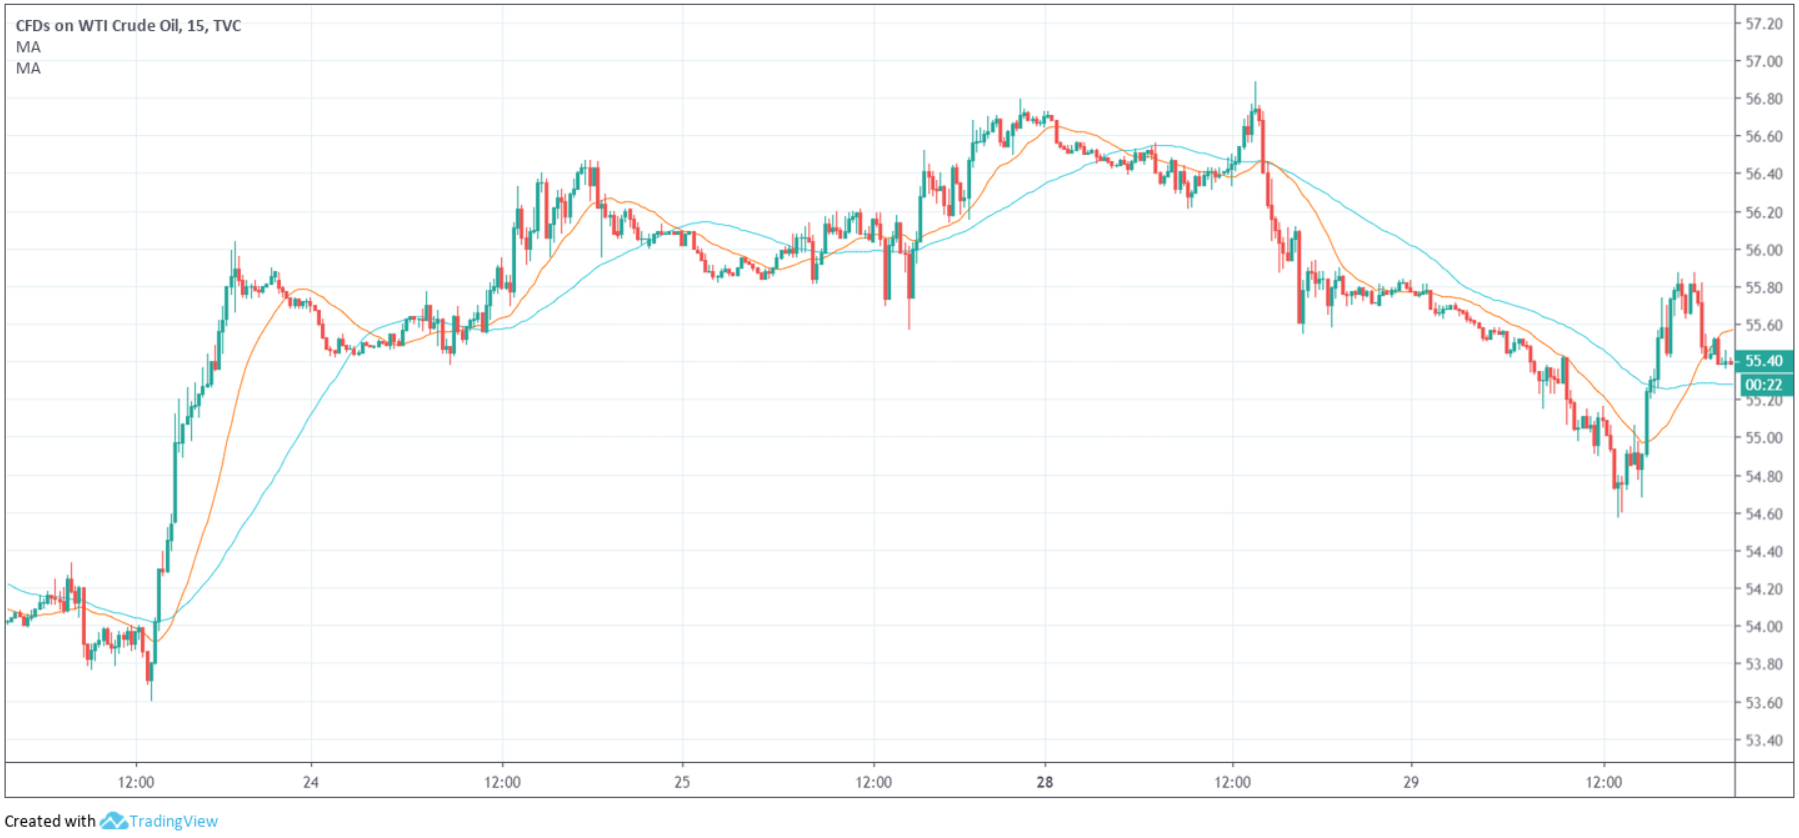
(FIGURE 1.2)
Dynamic support and resistance
When describing support and resistance levels, traders usually refer to horizontal lines. Dynamic support and resistance, however, can be found where a moving average intersects with price action.
The indicator can serve as a strong confirming point of confluence (essentially adding additional support/resistance to a setup) and also offer a trailing stop-loss line. One of the simplest uses for a moving average is determining where to place stop-loss orders when trailing a position. As the trade progresses and the moving average alters course, you can adjust the stop-loss position behind the moving average as price moves in favour.
Figure 1.3 uses a 200-period moving average to demonstrate the indicator’s ability to provide additional support and resistance in the market. Although not perfect, the moving average does tend to hold price action higher and lower when tested.
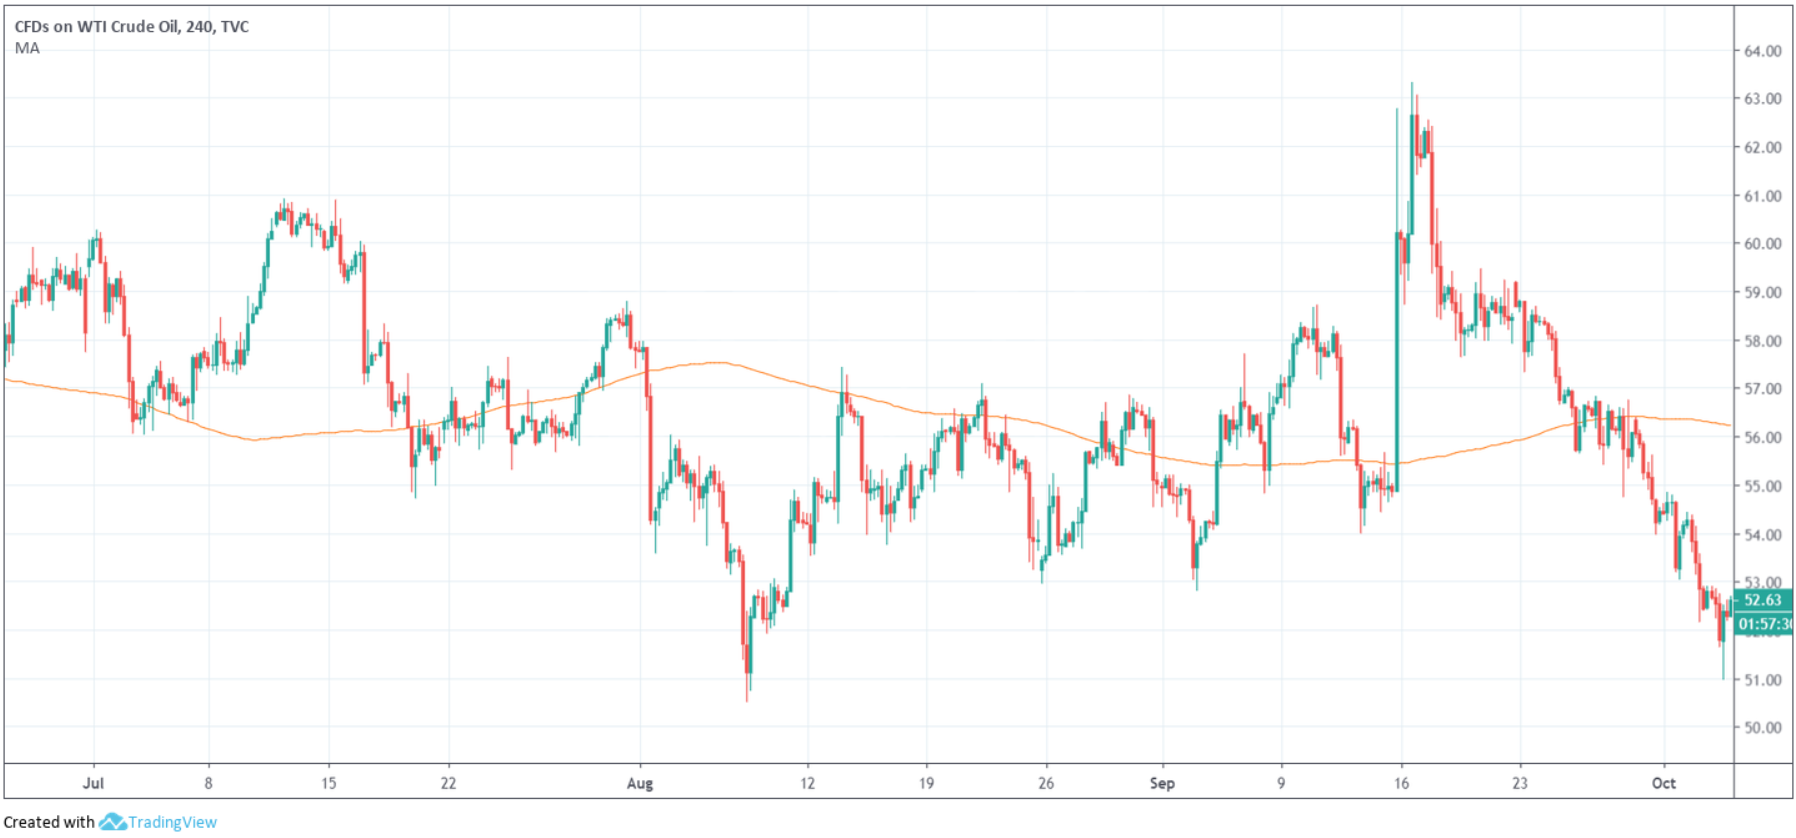
(FIGURE 1.3)
Final words
For most technical analysts, moving averages have a place. However, many believe they are secondary indicators and should only be used as additional confirming tools to chart-based structure, such as supply and demand, support and resistance, round numbers and trend lines etc.
What are the most reliable moving averages to select?
If only it were that easy. The answer is subjective and heavily debated among technical analysts. The best answer, though, is research. Explore which moving averages fits your personality and trading strategy and build from there.