A note on lower timeframe confirming price action…
Waiting for lower timeframe confirmation is our main tool to confirm strength within higher timeframe zones, and has really been the key to our trading success. It takes a little time to understand the subtle nuances, however, as each trade is never the same, but once you master the rhythm so to speak, you will be saved from countless unnecessary losing trades. The following is a list of what we look for:
- A break/retest of supply or demand dependent on which way you’re trading.
- A trendline break/retest.
- Buying/selling tails/wicks – essentially we look for a cluster of very obvious spikes off of lower timeframe support and resistance levels within the higher timeframe zone.
- Candlestick patterns. We tend to stick with pin bars and engulfing bars as these have proven to be the most effective.
We search for lower timeframe confirmation between the M15 and H1 timeframes, since most of our higher-timeframe areas begin with the H4. Stops are usually placed 3-5 pips beyond confirming structures.
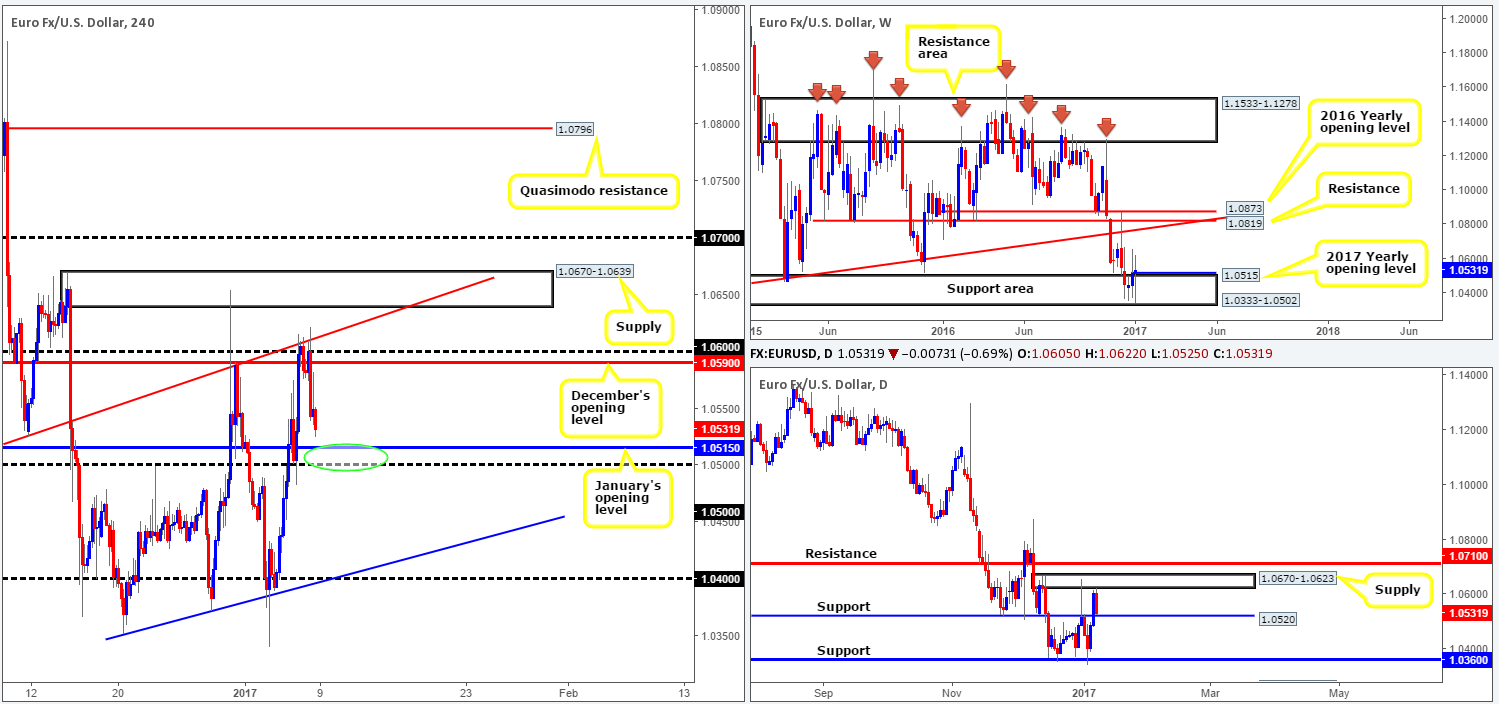
EUR/USD:
Weekly gain/loss: + 14 pips
Weekly closing price: 1.0531
Since mid-December, weekly action has been drifting around a long-term weekly support area drawn from 1.0333-1.0502. Over the last week, however, despite candle action printing somewhat of an indecision candle, the major managed to close above the 2017 yearly opening level at 1.0515, which could lead to a move up to long-term weekly trendline resistance extended from the low 0.8231. Thus, do keep an eyeball on this line this week.
The story on the daily chart shows that price came within touching distance of clipping the underside of a daily supply zone seen at 1.0670-1.0623, before ending the week closing just ahead of a support level coming in at 1.0520. A daily close below this support barrier this week could open up the gates for price to challenge daily support at 1.0360, which sits deep within the aforementioned weekly support area. Based on data from daily candles, in order for weekly buyers to march north this week, we see a problematic road ahead. Not only is there the current daily supply mentioned above at 1.0670-1.0623 to contend with, but there’s also a nearby daily resistance at 1.0710. This leaves little room for maneuver as the weekly trendline resistance is positioned just above the daily resistance!
A quick recap of Friday’s trade on the H4 chart shows that the single currency eventually sold off from a H4 trendline resistance taken from the low 1.0504. This recent bout of selling was triggered by the latest US job’s report. Despite the non-farm employment data coming in lower than expected, the pair still weakened, consequently closing the day just ahead of January’s opening level at 1.0515. The US unemployment rate came in as expected: 4.7%, while average hourly earnings ticked higher at 0.4%.
Our suggestions: In view of the above, the 1.05/1.0515 region on the H4 chart looks attractive for a bounce (green circle). Reinforced by daily support at 1.0520 along with the top edge of the weekly support area at 1.0502, a rotation is likely from here and could very well bring prices back up to at December’s opening level at 1.0590/1.06 handle. While there’s strong confluence surrounding this area, we are reluctant to place pending orders here. The reason is simply due to the likelihood of a fakeout being seen through the 1.05 handle. As such, we would advise waiting for a reasonably sized H4 bull candle to form prior to pressing the buy button.
Data points to consider: There are no high-impacting news events on the docket today relating to these two markets.
Levels to watch/live orders:
- Buys: 1.05/1.0515 ([reasonably sized H4 bullish close required prior to pulling the trigger] stop loss: ideally beyond the trigger candle).
- Sells: Flat (stop loss: N/A).
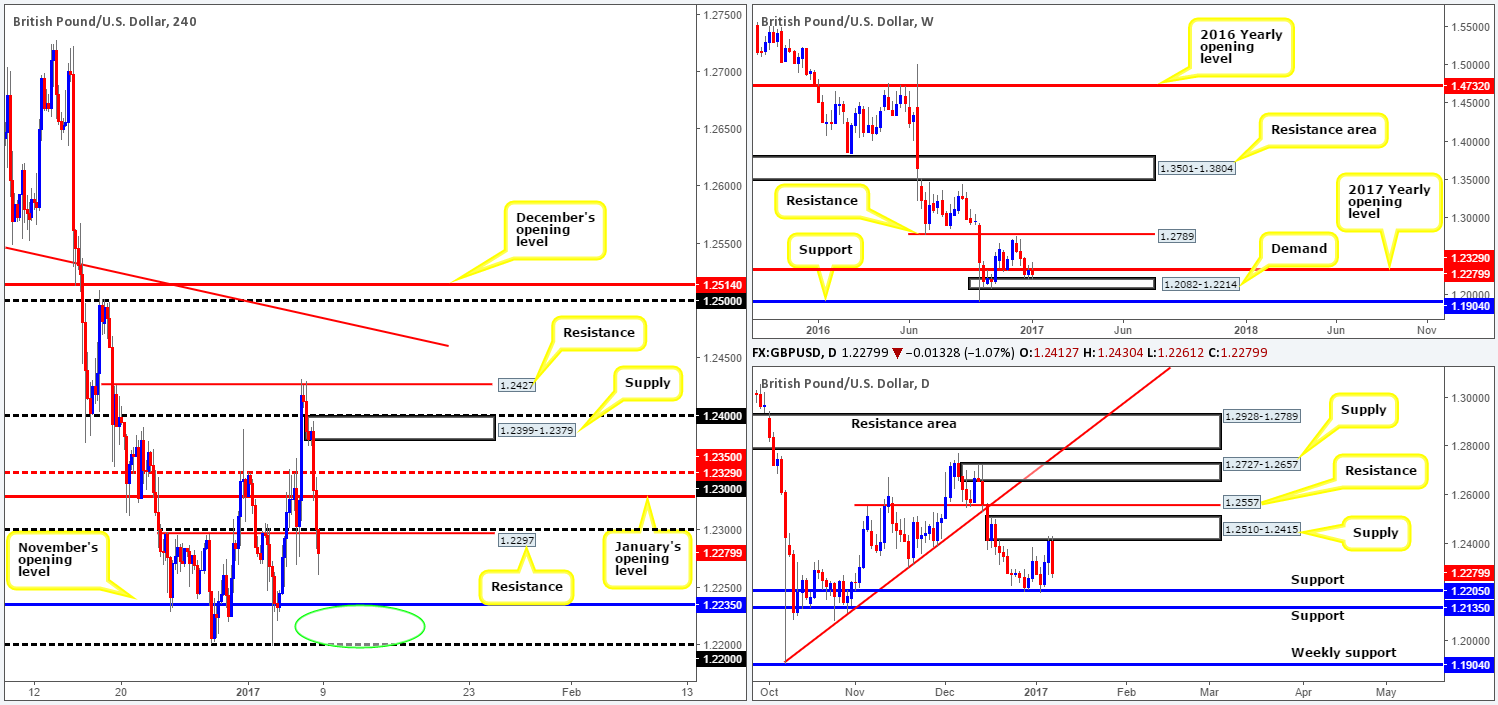
GBP/USD:
Weekly gain/loss: – 50 pips
Weekly closing price: 1.2279
As can be seen from the weekly chart, candle action is currently sandwiched between the 2017 yearly opening level at 1.2329 and weekly demand chiseled in at 1.2082-1.2214. In the event that the yearly opening level is violated this week, the next objective to reach will likely be weekly resistance drawn in at 1.2789. Conversely, a push below the above noted demand base could prompt prices to visit weekly support at 1.1904. As of now, however, medium-term direction is rather restricted.
Moving down to the daily timeframe we can see that price reacted beautifully to the base of a daily supply penciled in at 1.2510-1.2415.With this in mind, further selling could come into view this week at least until the unit strikes daily support at 1.2205, which is shadowed closely by another daily support at 1.2135.
A brief look at recent dealings on the H4 chart reveal that the candles slipped below January’s opening level at 1.2329, as well as the 1.23 handle and nearby H4 support at 1.2297 (now acting resistance). The down move was exacerbated by Friday’s US job’s report that showed average hourly earnings ticked higher at 0.4%. Also notable is that average hourly earnings advanced 2.9 percent over the year, the most since June 2009.
Our suggestions: In a similar fashion to the EUR/USD, our desk has their eye on the 1.22/1.2235 area on the H4 chart (green circle) for a bounce north today/early this week. Building a case for entry within this zone, we have the following: November’s opening level at 1.2235, the 1.22 handle, daily support at 1.2205 and also the top edge of the aforementioned weekly demand at 1.2214. Preferably, we would like to see a reasonably sized H4 bullish candle form within this region before executing a buy trade, since psychological numbers are prone to fakeouts!
Data points to consider: There are no high-impacting news events on the docket today relating to these two markets.
Levels to watch/live orders:
- Buys: 1.22/1.2235 ([reasonably sized H4 bullish close required prior to pulling the trigger] stop loss: ideally beyond the trigger candle).
- Sells: Flat (stop loss: N/A).
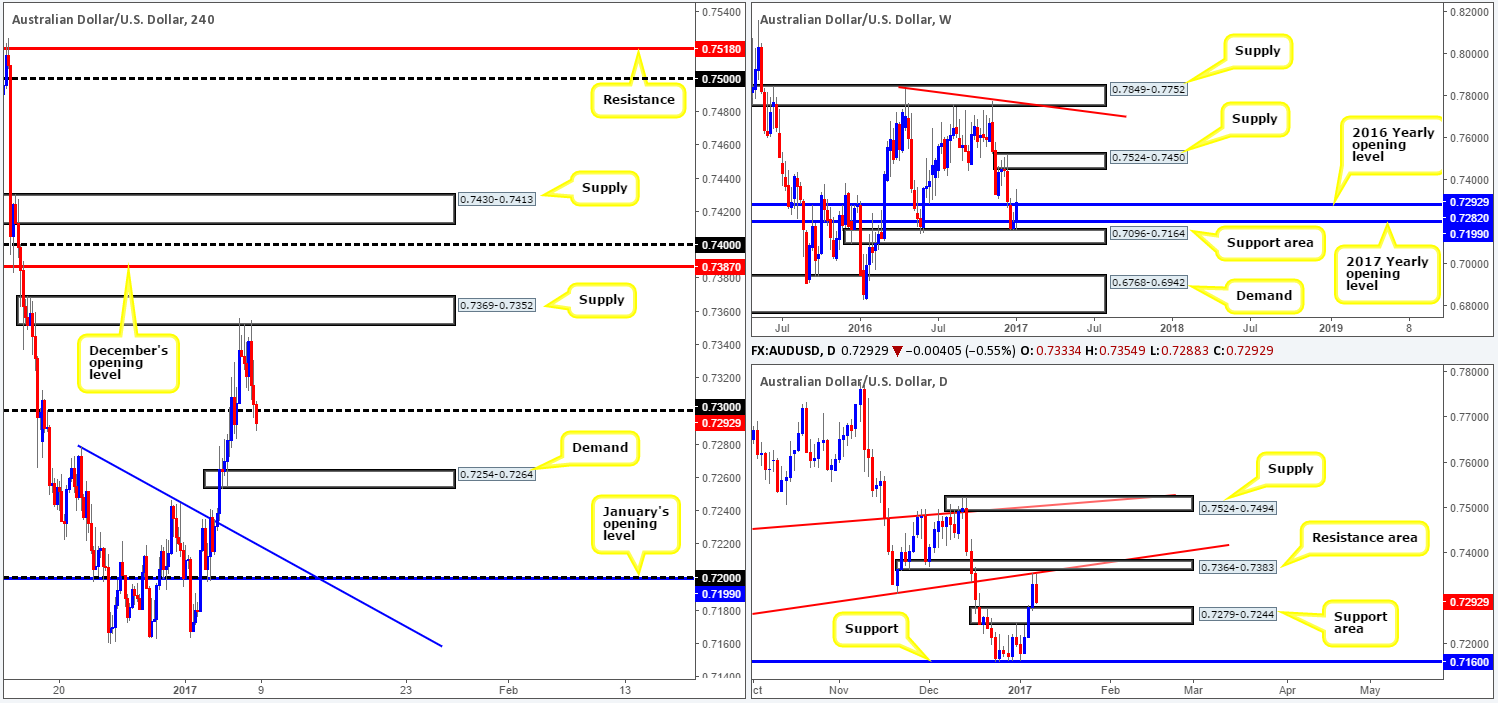
AUD/USD:
Weekly gain/loss: + 93 pips
Weekly closing price: 0.7292
Last week’s action saw the weekly candles extend its bounce north from the weekly support area at 0.7096-0.7164, resulting in price closing above both the 2016/2017 yearly opening levels (0.7282/0.7199) and reaching a high of 0.7356. Should weekly bulls remain in the driving seat this week, there’s a chance that we could see the commodity currency drive north to weekly supply coming in at 0.7524-0.7450.
Daily action on the other hand shows that price recently sold off from a daily trendline resistance stretched from the low 0.7145. This, as you can see, forced the pair to end the week closing just ahead of a daily support area seen at 0.7279-0.7244. Of particular interest here is that the 2016 yearly opening level at 0.7282 is positioned just three pips above the top edge of this support zone! Therefore, this daily barrier could play a significant role during trade this week!
Weakened by Friday’s US job’s report, the H4 candles fell sharply from H4 supply at 0.7369-0.7352 and wrapped up the weekly session by closing below the 0.73 handle.
Our suggestions: The H4 close below 0.73 could, according to the H4 structure, prompt further selling today down to H4 demand seen at 0.7254-0.7264. While our team would argue against selling here due to both the daily support area and 2016 yearly opening level (see above), we like the idea of buying from the aforementioned H4 demand. The area sits within the confines of the current daily support area and is positioned just below the 2016 yearly opening level! However, seeing as there’s room for a fakeout beyond the current H4 demand within the daily support area, we would opt to waiting for lower-timeframe confirming price action before pulling the trigger. Lower-timeframe confirmation is considered to be either of the following: a break above supply followed by a retest, a trendline break/retest or simply a collection of well-defined buying tails around the said H4 buy zone. We search for lower-timeframe confirmation between the M15 and H1 timeframes, since most of our higher-timeframe areas begin with the H4. Stops are usually placed 3-5 pips beyond confirming structures. However, this can vary.
Data points to consider: There are no high-impacting news events on the docket today relating to these two markets.
Levels to watch/live orders:
- Buys: 0.7254-0.7264 ([lower-timeframe confirmation required prior to pulling the trigger] stop loss: dependent on where one confirms the area).
- Sells: Flat (stop loss: N/A).
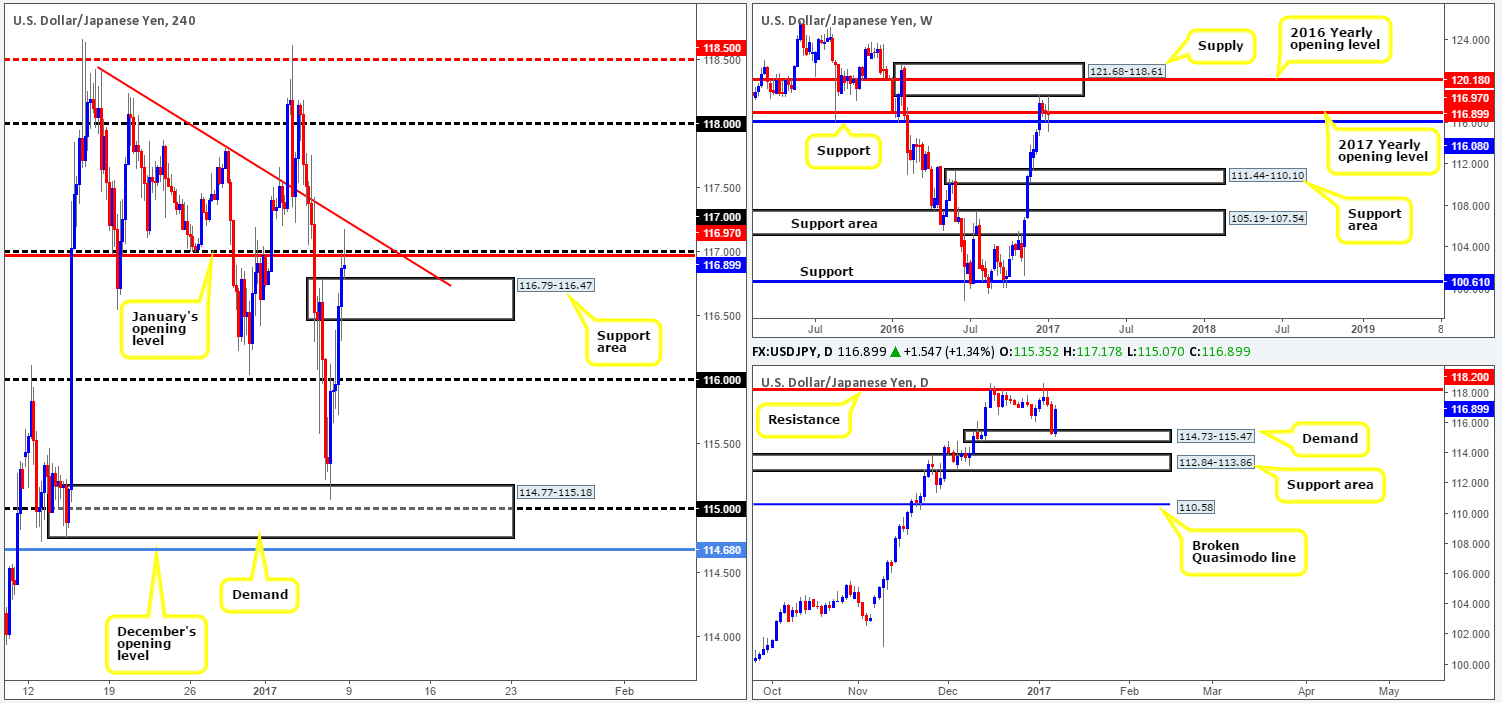
USD/JPY:
Weekly gain/loss: – 8 pips
Weekly closing price: 116.89
During the course of last week’s session, the pair printed a clear-cut weekly indecision candle. With a range stretching over 350 pips, price touched the underside of a weekly supply at 121.68-118.61, pierced weekly support at 116.08 and closed the week just below the 2017 yearly opening level at 116.97. Should a close below the current weekly support come into view this week, we would be looking toward a rather hefty selloff down to the weekly support area at 111.44-110.10.
Casting our lines down to the daily chart, recent movement shows that price slammed on the breaks and reversed from daily demand at 114.73-115.47. The next upside objective from this angle is 118.20: a daily resistance that shows good historical significance. However, with the 2017 yearly opening level lurking nearby, dollar bids may struggle to reach 118.20 this week.
Stepping across to the H4 chart, Friday’s session struck highs of 117.17, following an extension of Thursday’s bounce from H4 demand at 114.77-115.18. The greenback was bolstered by US labor data. Although the US economy added fewer jobs than originally projected, US average hourly earnings helped provide support as the reading came in better than expected at 0.4%.
Our suggestions: Given the H4 bearish selling wick seen piercing through both January’s opening level at 116.97/117 handle, which also came within an inch of connecting with a H4 trendline resistance taken from the high 118.40, one may consider selling this market today. There are, nevertheless, two cautionary points to consider. Firstly, directly below current price we have a H4 support area at 116.79-116.47, and secondly, let’s not forget that daily action recently bounced from a daily demand area (see above). As such, from our perspective, shorting this market is just too risky at this time. Buying on the other hand could be something to consider following a H4 close beyond the aforementioned H4 trendline resistance, as the path north appears relatively clear thereafter up to the 118 barrier.
Data points to consider: There are no high-impacting news events on the docket today relating to these two markets.
Levels to watch/live orders:
- Buys: Watch for a H4 close above the aforementioned H4 trendline resistance and look to trade any retest seen thereafter ([reasonably sized H4 bullish candle is required following the retest before our team will consider pulling the trigger] stop loss: ideally beyond the trigger candle).
- Sells: Flat (stop loss: N/A).
USD/CAD:
Weekly gain/loss: – 198 pips
Weekly closing price: 1.3236
Recent weekly action shows that the USD/CAD extended its bounce south from the 50.0% Fib resistance at 1.3540 last week, consequently placing the unit within reasonable striking distance of weekly demand coming in at 1.3006-1.3115. This demand, as you can see, held price higher back in mid-Dec 2016. Therefore, there’s a good chance that history could repeat itself here!
Turning our attention to the daily candles, the chart shows daily demand at 1.3080-1.3131 sitting nearby, which fuses nicely with a daily trendline support extended from the low 1.2460. It may also be worth noting here that this demand is positioned around the top edge of the aforementioned weekly demand.
On Friday, Canadian employment data surged above consensus estimates at 53.7k, while the unemployment rate came in as expected at 6.9%. In the US, non-farm employment change came in lower than expected at 156k, the unemployment rate remained steady at 4.7% and average hourly earnings reported a better-than-expected month at 0.4%. Collectively, this sent the pair lower and pierced the 1.32 barrier.
Our suggestions: Going into the later hours of Friday’s session, the unit altered paths and whipsawed back up to the H4 mid-way resistance point 1.3250, more specifically a H4 supply zone coming in at 1.3268-1.3246. In light of the pin-bar (bearish) reaction seen to the underside of this area, and room on both the daily and weekly timeframes to descend lower, we feel looking for shorts from the above noted H4 supply could be something to consider today, targeting the top edge of the aforementioned daily demand base.
As price has already reacted from the H4 supply zone, we will be looking to the lower timeframes for entry. Lower-timeframe confirmation is considered to be either of the following: a break below demand followed by a retest, a trendline break/retest or simply a collection of well-defined selling wicks around the said H4 sell zone. We search for lower-timeframe confirmation between the M15 and H1 timeframes, since most of our higher-timeframe areas begin with the H4. Stops are usually placed 3-5 pips beyond confirming structures. However, this can vary.
Data points to consider: There are no high-impacting news events on the docket today relating to these two markets.
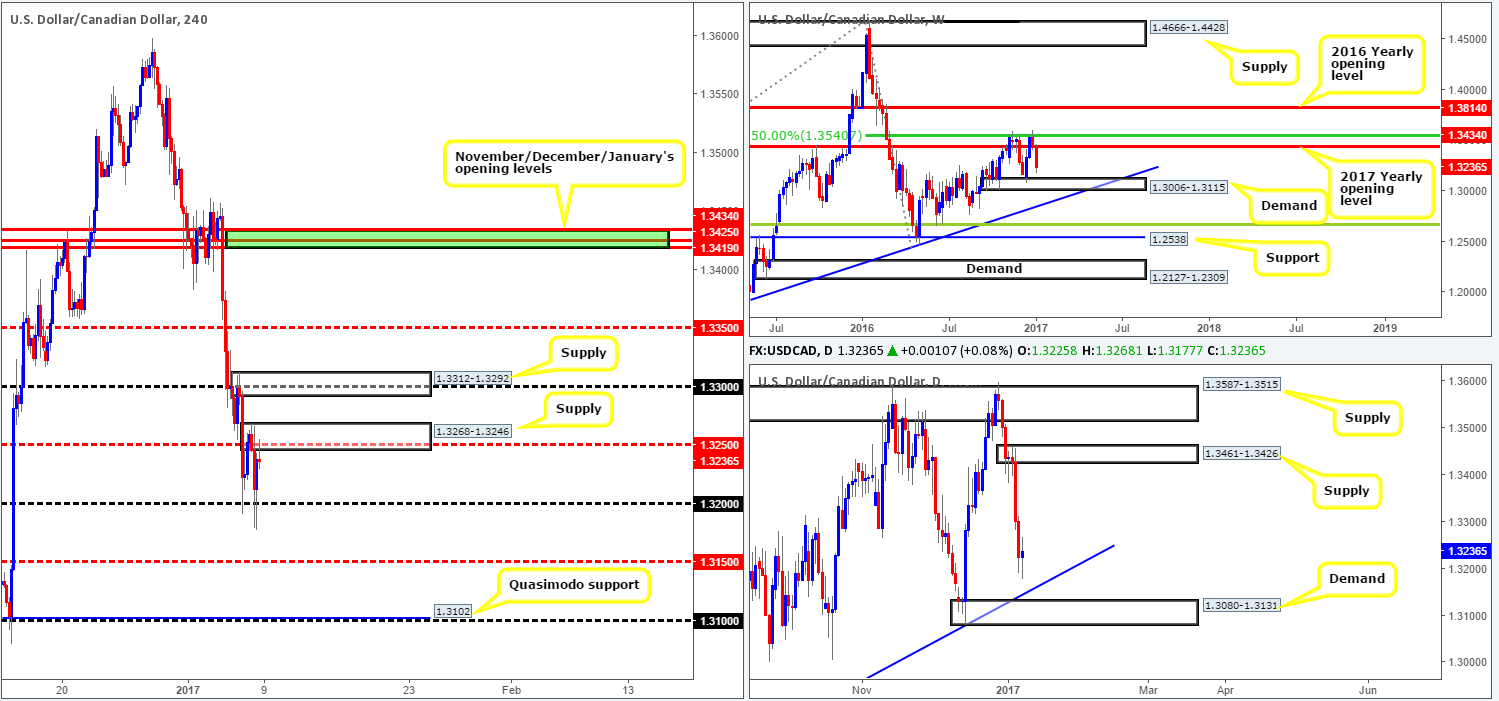
Levels to watch/live orders:
- Buys: Flat (stop loss: N/A).
- Sells: 1.3268-1.3246 ([lower-timeframe confirmation required prior to pulling the trigger] stop loss: dependent on where one confirms the area).


