EUR/USD:
Weekly gain/loss: -1.39%
Weekly closing price: 1.1959
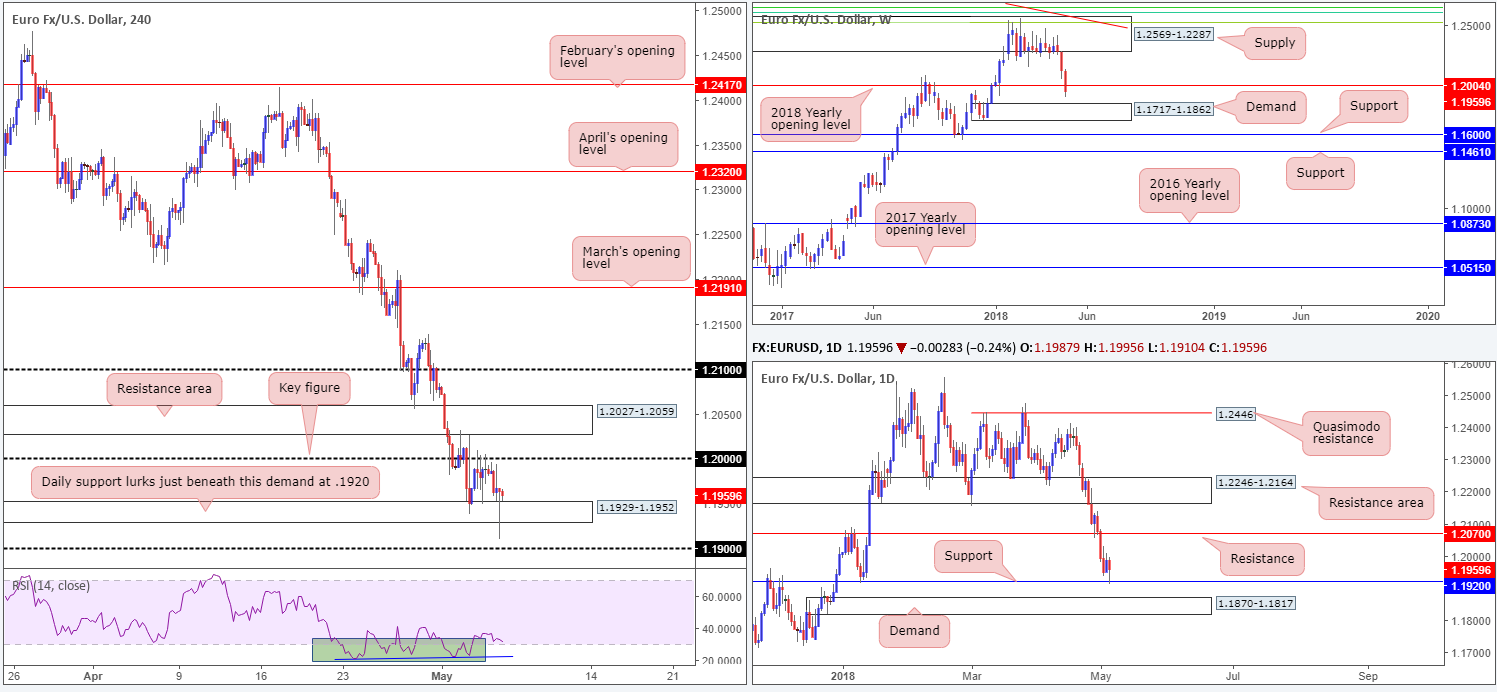
Last week’s sharp run to the downside forced the euro into further losses, stripping in excess of 160 pips. In the shape of a near-full-bodied weekly bearish candle, price swallowed the 2018 yearly opening level seen on the weekly timeframe at 1.2004, and positioned weekly demand at 1.1717-1.1862 in the firing range. Note that this demand communicates strength given the momentum molded off of its base.
On the daily timeframe, support at 1.2070 (now acting resistance) was taken out in the early stages of trade last week, visibly exposing a daily support at 1.1920. This level, as you can see from the chart, boasted relatively strong historical significance, and as such, it was no surprise to see it hold firm during Friday’s trade.
Friday’s non-farm payroll employment increased by 164k in April, with the unemployment rate edging down to 3.9%, according to the US Bureau of Labor Statistics. The initial impact sent the EUR/USD higher. Despite this, the move was a short-lived one as selling pressure formulated just south of 1.20, consequently whipsawing H4 price through nearby H4 demand at 1.1929-1.1952 to the daily support level mentioned above at 1.1920.
For those who read Friday’s outlook you may recall the team highlighted the following:
The current H4 demand, although holding price action higher, has ‘fakeout’ painted all over it. The daily support lurking just beneath it at 1.1920 provides an ideal platform to wipe out traders that bought from this area, and also trap breakout sellers. As such, all eyes remain on the 1920ish region today for an intraday bounce to the upside.
Well done to those who managed to jump aboard this move!
Potential trading zones:
Based on Friday’s movement (the fakeout beneath H4 demand formed in the shape of a bullish H4 pin-bar formation), 1.20 will likely be brought back into view today/early this week, which is an ideal take-profit target for those that bought from the daily support.
1.20, by and of itself, is a key level. Though, when bolstered by a yearly opening level ([2018] at 1.2004 mentioned above) it develops into a formidable resistance, in our view. Therefore, it is unlikely we’ll see price overcome 1.20/the nearby H4 resistance area at 1.2027-1.2059 this week, and, as such, could be an area to consider shorting this market from.
Data points to consider today: FOMC members Bostic and Barkin speak.
GBP/USD:
Weekly gain/loss: -1.81%
Weekly closing price: 1.3525
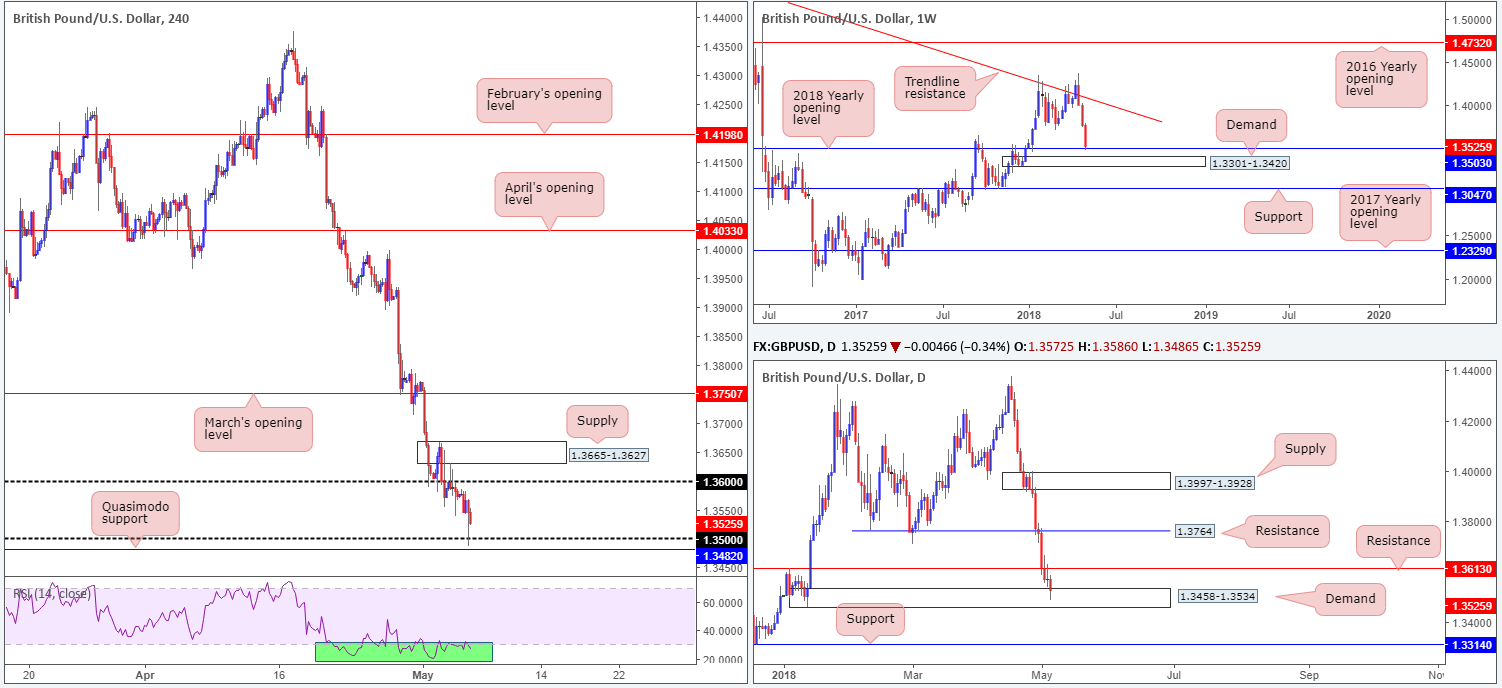
The British pound sustained further losses over the course of last week, erasing a cool 250 pips! Although the unit recorded its third consecutive weekly loss, the pair may find some support this week. As is evident from the weekly timeframe, the market shook hands with a 2018 yearly opening level at 1.3503, which happens to be located just ahead of a weekly demand base drawn from 1.3301-1.3420. Both areas, in our technical book, command respect.
In terms of daily movement, demand pictured at 1.3458-1.3534 was brought into the fight on Friday. This demand should be of interest owing to it housing the 2018 yearly opening level mentioned above. With that being said, though, a rejection from this area faces almost immediate opposition from a daily resistance plotted at 1.3613. A violation, on the other hand, could lead to a test of daily support priced in at 1.3314 (sited within the lower limits of the noted weekly demand).
A quick recap of Friday’s movement on the H4 timeframe shows that the GBP/USD pushed lower, mildly breaching 1.35 and bottoming just ahead of a H4 Quasimodo support at 1.3482 amid US trade. The slide took place amid USD bidding across the board despite relatively disappointing US job’s data. In terms of nearby resistances on this scale, the 1.36 handle and H4 supply area at 1.3665-1.3627 are of note.
Potential trading zones:
While the pair is entrenched within a clear phase of selling at the moment, across the board there’s clear support seen in play:
- The 2018 yearly opening level on the weekly timeframe at 1.3503.
- Daily demand at 1.3458-1.3534.
- H4 Quasimodo support at 1.3482/psychological number 1.35.
In light of the above structures, selling is complicated right now. Buying, on the other hand, could be an option. This would, however, involve going against current sentiment (the trend).
A H4 full or near-full-bodied bull candle printed off 1.35ish would, as far as we can see, be a reasonable signal to consider longs. In regard to stop-loss placement, traders could utilize the lower edge of the current daily demand at 1.3458. Nearby resistance targets have already been highlighted in bold.
Data points to consider today: UK banks closed in observance of May Day; FOMC members Bostic and Barkin speak.
AUD/USD:
Weekly gain/loss: -0.58%
Weekly closing price: 0.7538
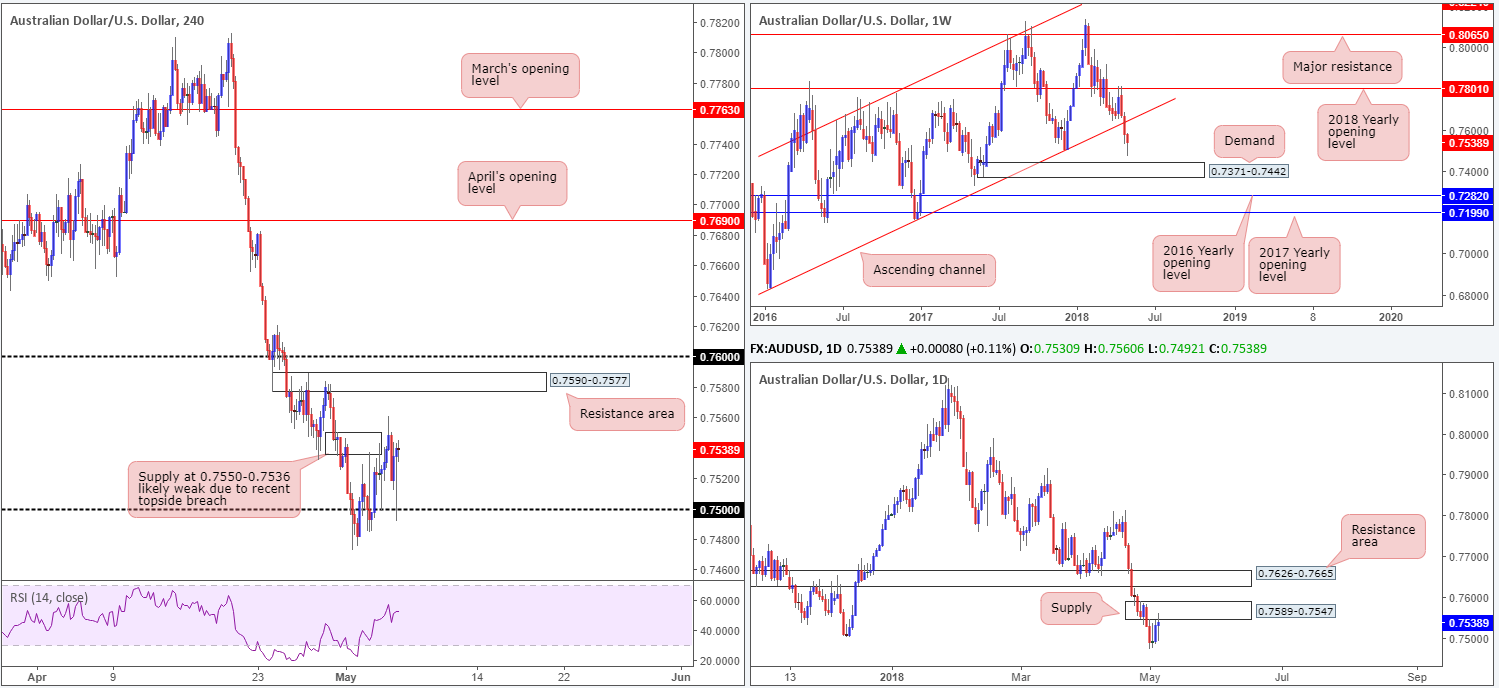
The AUD/USD, as seen from the weekly timeframe, failed in its attempt to close below the DEC 4 low 0.7501, after unearthing fresh bids ahead of weekly demand at 0.7371-0.7442. Further buying from this point has the underside of a weekly channel support-turned resistance (taken from the low 0.6827) to target.
Before weekly buyers can advance, however, daily supply penciled in at 0.7589-0.7547 will need to be engulfed. The next port of call beyond this base can be seen in the shape of a daily resistance area at 0.7626-0.7665, which happens to intersect beautifully with the aforementioned weekly channel resistance. A rejection off the current daily supply, nevertheless, has daily demand at 0.7371-0.7429 in sight that is positioned within the lower limit of the noted weekly demand area (not seen on the screen).
Following a brief spell of buying on the back of Friday’s US job’s data, the pair rotated aggressively to the downside and retested the 0.75 handle. H4 price shows us that supply at 0.7550-0.7536 may have been weakened due to a recent topside breach. And seeing as 0.75 held ground shortly after, further upside could be seen towards the H4 resistance area at 0.7590-0.7577, followed closely by the 0.76 handle.
Potential trading zones:
As already stated above, H4 price suggests that the bulls may take charge. However, this assumes that daily supply mentioned above at 0.7589-0.7547 doesn’t come into play!
Through the lens of a technical trader, buying this market is not attractive despite H4 price suggesting otherwise. Buying into daily supply is just too much of a risk – even more so considering that the commodity currency is entrenched within a strong down trending market at the moment.
As a result, opting to remain on the sidelines may be the better pathway to take today.
Data points to consider today: NAB business confidence; FOMC members Bostic and Barkin speak.
USD/JPY:
Weekly gain/loss: +0.06%
Weekly closing price: 109.05
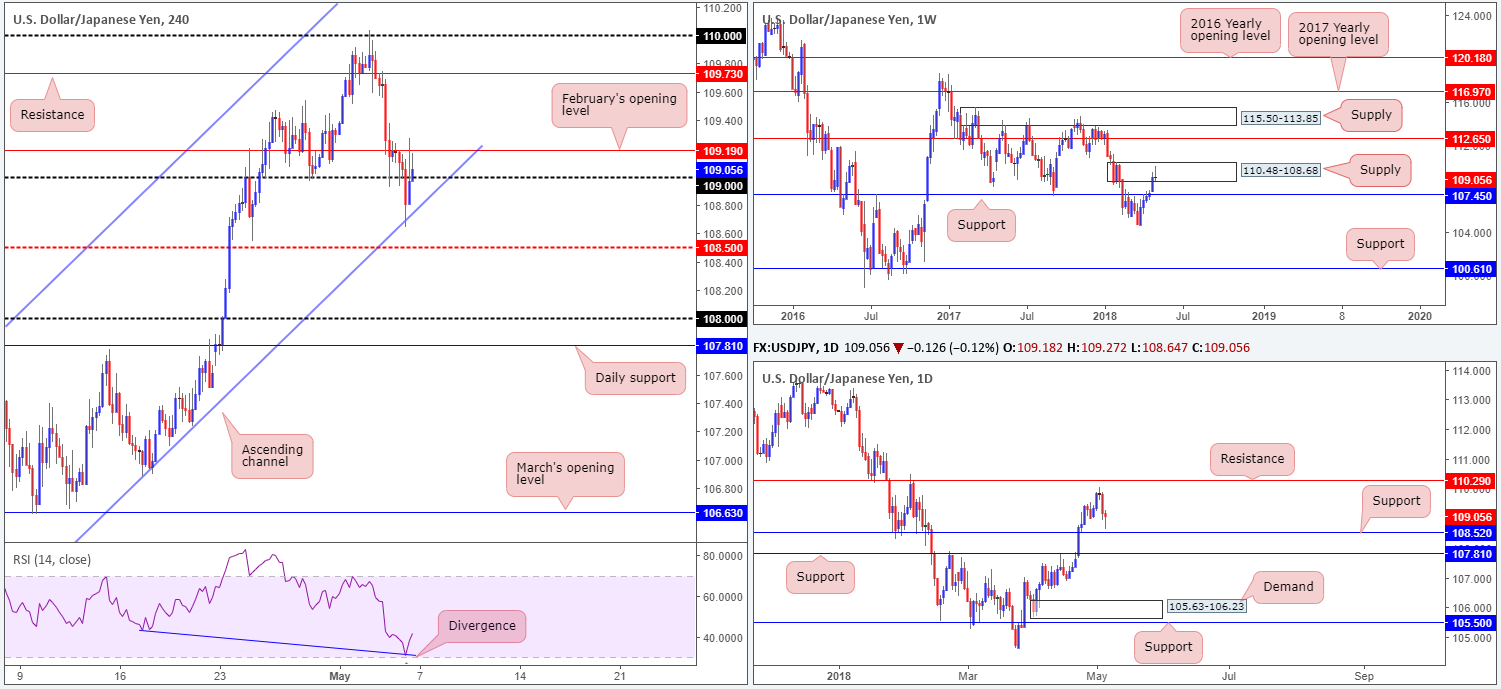
Over the course of last week’s movement, weekly price journeyed high into a weekly supply area coming in at 110.48-108.68. Despite a stellar attempt from the bulls, the pair concluded the week forming a robust weekly selling wick, also known as a bearish pin-bar formation. Should this attract sellers into the market this week, traders will likely have their crosshairs pinned on weekly support drawn from 107.45.
The story on the daily timeframe, however, shows us that we have nearby support seen at 108.52, shadowed closely by another layer of support positioned at 107.81. Both levels carry equal weight, as far as we can see. Therefore, selling based on the bearish pin-bar formation noted on the weekly timeframe could be a tad problematic for those looking for medium-term positions.
Friday’s less-than-stellar US job’s data sparked an immediate round of selling, consequently forcing H4 price to challenge channel support taken from the low 104.62. Supported alongside H4 RSI divergence the USD/JPY rose higher from here, quickly erasing NFP-induced losses and ending the day testing February’s opening level at 109.19 after breaching 109.
Potential trading zones:
So let’s just outline what we have here:
- Weekly price suggesting lower levels could be on the cards.
- Daily price noting relatively nearby support.
- H4 price sandwiched tightly between 109.19/109, following active bids emerging from a H4 channel support.
For those who bought from the H4 channel support, a close above February’s opening level would be advantageous, since beyond here (on the H4 scale) there’s little stopping the unit from reaching H4 resistance seen at 109.73. However, do note that by entering long you have effectively bought into weekly supply, so do not be surprised to see a downside play materialize (reducing risk to breakeven and taking partial profits, therefore, could be an idea).
In terms of additional setups, we like the space seen above February’s opening level on the H4 timeframe, but are fearful due to the potential threat of selling emanating from weekly supply. Other than this, we do not see much else to hang our hat on for the time being.
Data points to consider today: FOMC members Bostic and Barkin speak.
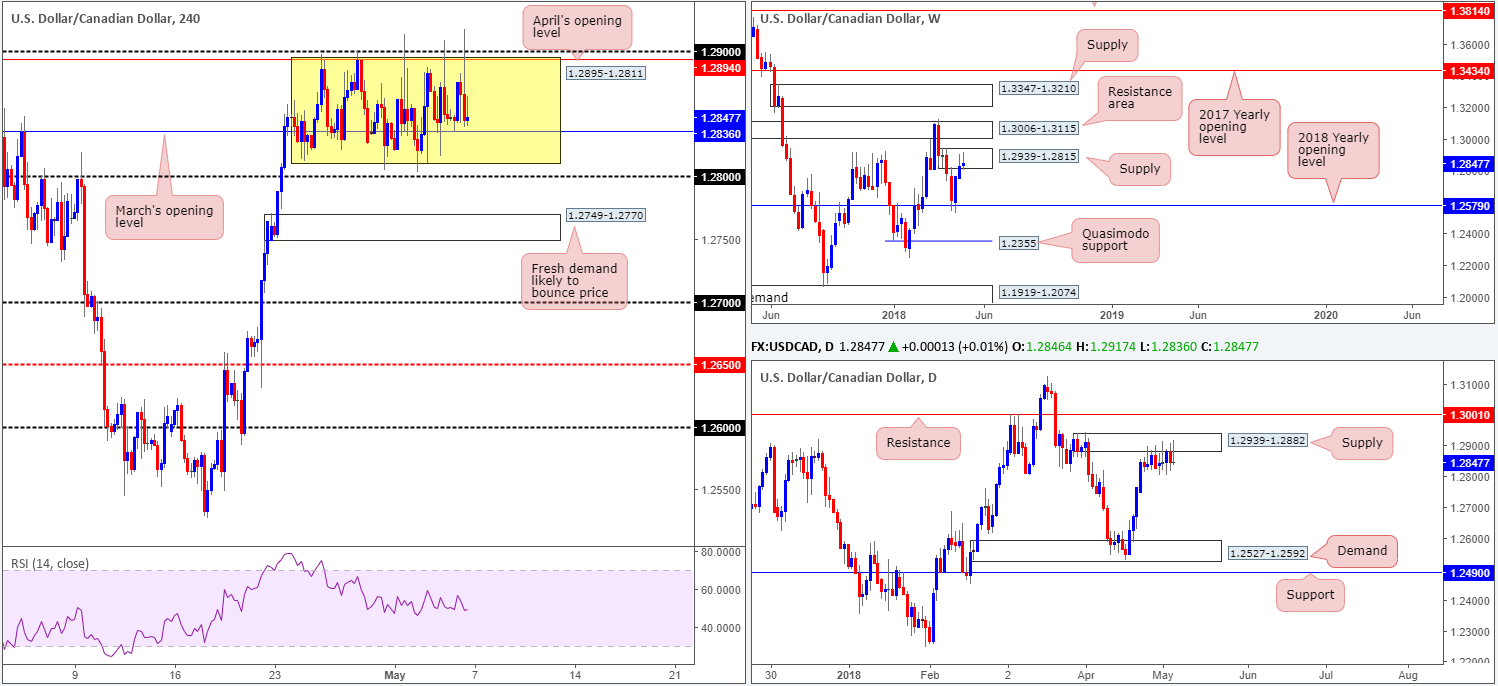
USD/CAD:
Weekly gain/loss: +0.13%
Weekly closing price: 1.2847
Following a stronger-than-expected rebound off the 2018 yearly opening level seen on the weekly timeframe at 1.2579, the pair has recently been engaging with a weekly supply zone plotted at 1.2939-1.2815. Of particular interest from within this area is last week’s weekly selling wick (bearish pin-bar formation), which has the capability of drawing in sellers this week. In the event of a break higher, nevertheless, buyers would immediately face potential selling pressure from a weekly resistance zone seen at 1.3006-1.3115.
In conjunction with weekly flow, daily price crossed swords with a daily supply zone at 1.2939-1.2882 back on April 25 and has remained stagnant since. There have been numerous daily selling wicks printed off this zone, but none have generated any follow-through action thus far. The next upside target beyond the current supply can be seen in the form of a daily resistance at 1.3001 (sited just beneath the noted weekly resistance zone), whereas a move lower has the daily demand at 1.2527-1.2592 (houses the 2018 yearly opening level within) to target.
Over on the H4 timeframe, we can see the USD/CAD continues to emphasize a somewhat directionless state. Not even the mighty non-farm payrolls number released on Friday could change that!
Since April 25 (the same time daily price shook hands with daily supply), H4 price has remained fluctuating between 1.2895/1.2811 (within the area is March’s opening level seen at 1.2836). As highlighted in previous writings, the team is still biased to the downside in spite of the ranging structure we’re seeing at the moment. This is largely due to where price is positioned on the bigger picture.
Potential trading zones:
A break of 1.28 would likely spark a round of selling. However, traders need to account for the fresh H4 demand based just beneath it at 1.2749-1.2770 as it is highly likely to bounce price. With that in mind, we recommend waiting for the current H4 demand area to be engulfed (and preferably retested as resistance) before considering short positions. Although the next downside target from here is relatively close: 1.27, we feel it is still a trade worthy of attention given that the next support target on the bigger picture does not come into view until daily demand at 1.2527-1.2592!
Data points to consider today: FOMC members Bostic and Barkin speak; (CAD) Gov. Council Member Lane speaks.
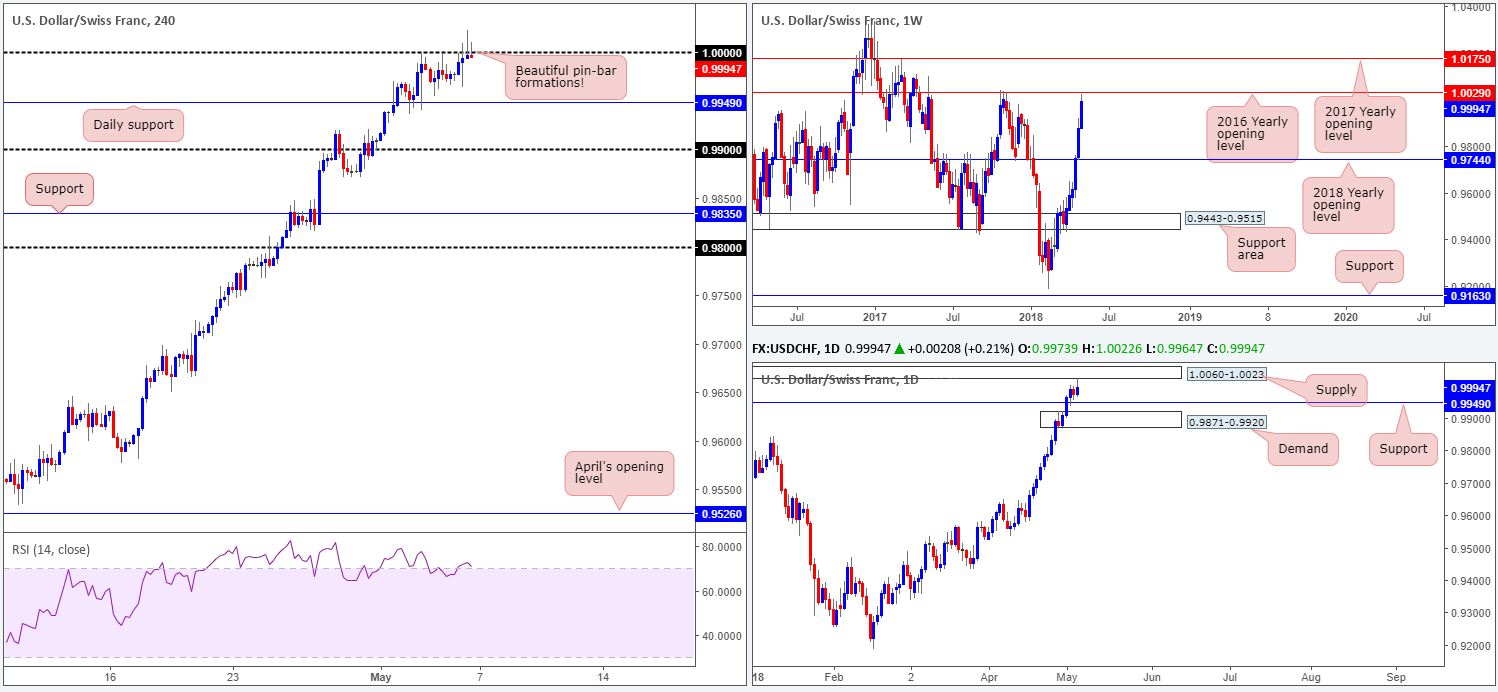
USD/CHF:
Weekly gain/loss: +1.22%
Weekly closing price: 0.9994
Once again, the US dollar outperformed against its Swiss counterpart last week, consequently pulling weekly price up to within striking distance of a 2016 yearly opening level placed at 1.0029. Despite the fact that this market has traded higher for six consecutive weeks, 1.0029 is not a level one should overlook. Check out the clean rejection formed on October 2017 which dropped price in excess of 800 pips!
Turning the focus over to the daily timeframe, we can clearly see daily resistance at 0.9949 was taken out on Tuesday (now acting support). Firmly opening the trapdoor towards daily supply carved from 1.0060-1.0023, this area was tested (almost to the pip) amid Friday’s trading. Also worthy of note is this area houses the 2016 yearly opening level mentioned above at 1.0029 within its walls.
Despite a disappointing US non-farm payroll number on Friday, the US dollar remained irrepressible. This, in the case of H4 structure, propelled price action through parity (1.0000) and connected with the aforementioned daily supply zone. Given this, and the fact that H4 price printed back-to-back bearish pin-bar formations that closed below 1.0000, a downside move could come into being.
Potential trading zones:
Selling from the aforementioned H4 bearish pin-formations noted above is an option today. To be on the safe side, though, conservative stops should be placed ABOVE the aforementioned daily supply. Nevertheless, given that the next downside target from current price falls in at daily support mentioned above at 0.9949, risk/reward is somewhat skewed. Therefore, either positioning stops above the largest wick of the H4 bearish pin bar (1.0022) or above the 2016 yearly opening level at 1.0029 is an alternative, albeit slightly more aggressive.
Data points to consider today: FOMC members Bostic and Barkin speak.
DOW 30:
Weekly gain/loss: -0.20%
Weekly closing price: 24262
US equities, despite ranging nearly 1000 points, concluded trade relatively unchanged last week. Bid/offers, from a structural perspective, remain even on the weekly scale as buyers and sellers continue to battle for position between the 2018 yearly opening level at 24809 and weekly demand posted at 23242-23494. What’s also notable from a candlestick perspective, however, are the two back-to-back weekly bullish pin-bar formations, potentially indicating optimistic energy.
A closer look at price action on the daily timeframe shows the index came within touching distance of a daily Quasimodo support level at 23509 on Thursday, before aggressively stamping in a bullish candle on Friday. Assuming that the bulls remain in the driving seat here, last Monday’s high at 24498 will likely be tested, followed then by daily supply at 24977-24682.
Opening trade on Friday saw the H4 candles trade strongly, driving through Wednesday’s high at 24185 and closing the day just south of a H4 supply zone printed at 24579-24448. Traders might also want to note that above this area is a H4 resistance zone marked in red from 25024/24803 (comprised of March’s opening level and a H4 Quasimodo resistance). Also notable is the fact that the H4 resistance area has strong connections to the current daily supply and the 2018 yearly opening level.
Potential trading zones:
Having seen the confluence surrounding the current H4 resistance area, shorting from the H4 supply below it at 24579-24448 might not be the best path to take.
As a result, traders may want to consider placing alerts for potential sell trades at the underside of the H4 resistance area. Stop-loss orders, technically speaking, would be best placed above 25024, clearing not only the top edge of daily supply but also the H4 resistance zone as well.
The initial take-profit target can be set around 23830ish: a local area we’ve seen support materialize in recent trading.
Data points to consider today: FOMC members Bostic and Barkin speak.

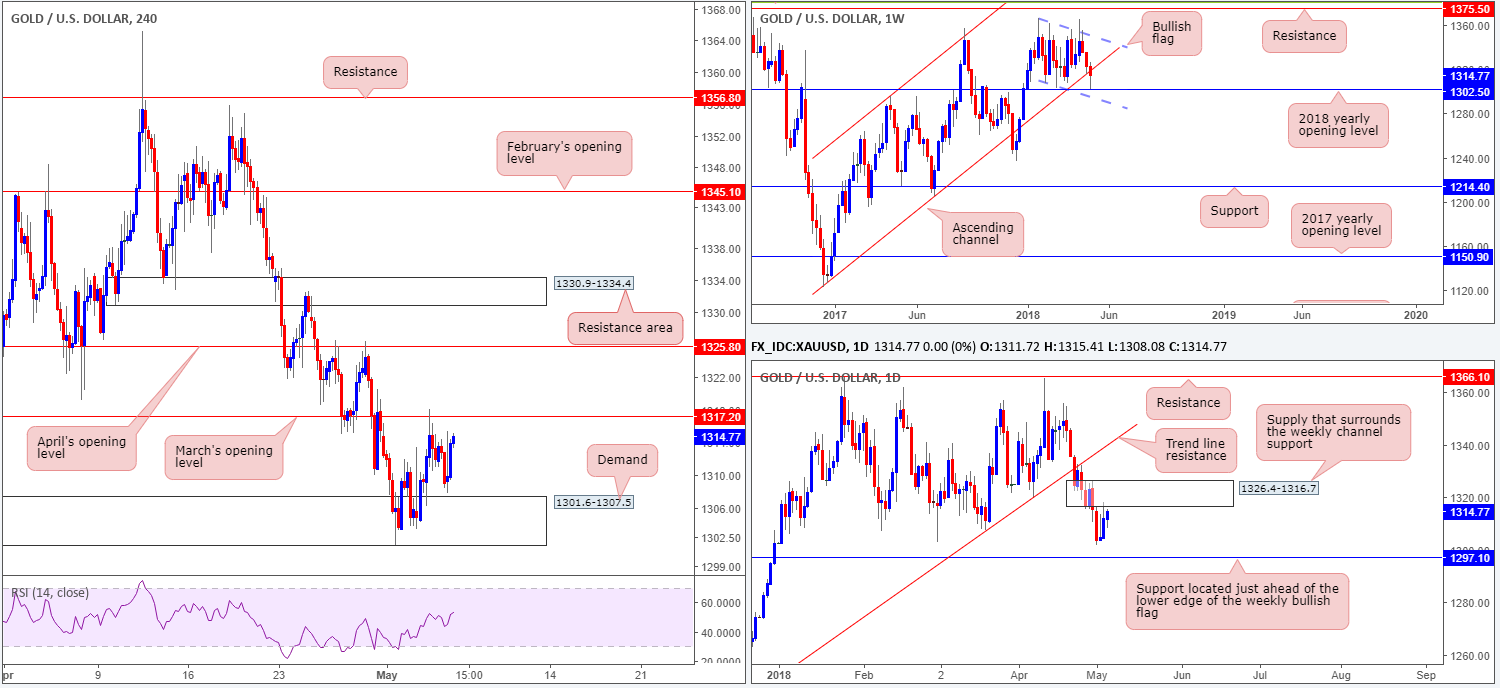
GOLD:
Weekly gain/loss: -0.64%
Weekly closing price: 1314.7
During the course of last week’s movement, the price of gold suffered additional losses at the hands of a buoyant USD. Weekly price marched its way through a long-term weekly channel support (extended from the low 1122.8) and bumped heads with the 2018 yearly opening level at 1302.5. This base, as you can see, held firm and chalked up a mild end-of-week buying tail. The question going forward, however, is will the recently broken weekly channel now act as resistance?
Zooming in for a closer look at daily structure, traders have likely noticed the daily supply zone marked at 1326.4-1316.7. Interestingly, this daily supply area was the ‘decision point’ to initially probe below the long-term weekly channel support. Therefore, it is a significant zone, in our humble opinion.
A brief look at recent dealings on the H4 timeframe show the latest round of non-farm payrolls had little effect on the overall structure. H4 demand at 1301.6-1307.5 (houses the 2018 yearly opening level on the weekly timeframe within its boundaries) remains in the fray as does March’s opening level seen overhead at 1317.2 (sited within the lower limit of the aforementioned daily supply). A violation of March’s opening boundary exposes April’s opening level plotted at 1325.8, whereas a move beneath the current H4 demand places daily support at 1297.1 in the spotlight, which happens to be located just ahead of the lower edge of a weekly bullish flag taken from the low 1307.2.
Potential trading zones:
The current daily supply that surrounds the recently breached weekly channel line, as well as March’s opening level on the H4 timeframe, may hinder upside this week. A decisive H4 close above March’s open level would help things, but whether it’d be enough to convince buyers to long the metal into daily supply is difficult to judge.
The sell-side of this market is just as tricky unfortunately. Yes, we have H4 resistance and an important daily supply in play, but we’re also coming off of a rejection from the 2018 yearly opening level on the weekly timeframe.
As such it seems the yellow metal remains at a crossroads. Traders may want to consider stepping aside until direction becomes clearer.
This site has been designed for informational and educational purposes only and does not constitute an offer to sell nor a solicitation of an offer to buy any products which may be referenced upon the site. The services and information provided through this site are for personal, non-commercial, educational use and display. IC Markets does not provide personal trading advice through this site and does not represent that the products or services discussed are suitable for any trader. Traders are advised not to rely on any information contained in the site in the process of making a fully informed decision.
This site may include market analysis. All ideas, opinions, and/or forecasts, expressed or implied herein, information, charts or examples contained in the lessons, are for informational and educational purposes only and should not be construed as a recommendation to invest, trade, and/or speculate in the markets. Any trades, and/or speculations made in light of the ideas, opinions, and/or forecasts, expressed or implied herein, are committed at your own risk, financial or otherwise.
The use of the site is agreement that the site is for informational and educational purposes only and does not constitute advice in any form in the furtherance of any trade or trading decisions.
The accuracy, completeness and timeliness of the information contained on this site cannot be guaranteed. IC Markets does not warranty, guarantee or make any representations, or assume any liability with regard to financial results based on the use of the information in the site.
News, views, opinions, recommendations and other information obtained from sources outside of www.icmarkets.com.au, used in this site are believed to be reliable, but we cannot guarantee their accuracy or completeness. All such information is subject to change at any time without notice. IC Markets assumes no responsibility for the content of any linked site. The fact that such links may exist does not indicate approval or endorsement of any material contained on any linked site.
IC Markets is not liable for any harm caused by the transmission, through accessing the services or information on this site, of a computer virus, or other computer code or programming device that might be used to access, delete, damage, disable, disrupt or otherwise impede in any manner, the operation of the site or of any user’s software, hardware, data or property.


