Waiting for lower timeframe confirmation is our main tool to confirm strength within higher timeframe zones, and has really been the key to our trading success. It takes a little time to understand the subtle nuances, however, as each trade is never the same, but once you master the rhythm so to speak, you will be saved from countless unnecessary losing trades. The following is a list of what we look for:
- A break/retest of supply or demand dependent on which way you’re trading.
- A trendline break/retest.
- Buying/selling tails/wicks – essentially we look for a cluster of very obvious spikes off of lower timeframe support and resistance levels within the higher timeframe zone.
We typically search for lower-timeframe confirmation between the M15 and H1 timeframes, since most of our higher-timeframe areas begin with the H4. Stops are usually placed 1-3 pips beyond confirming structures.
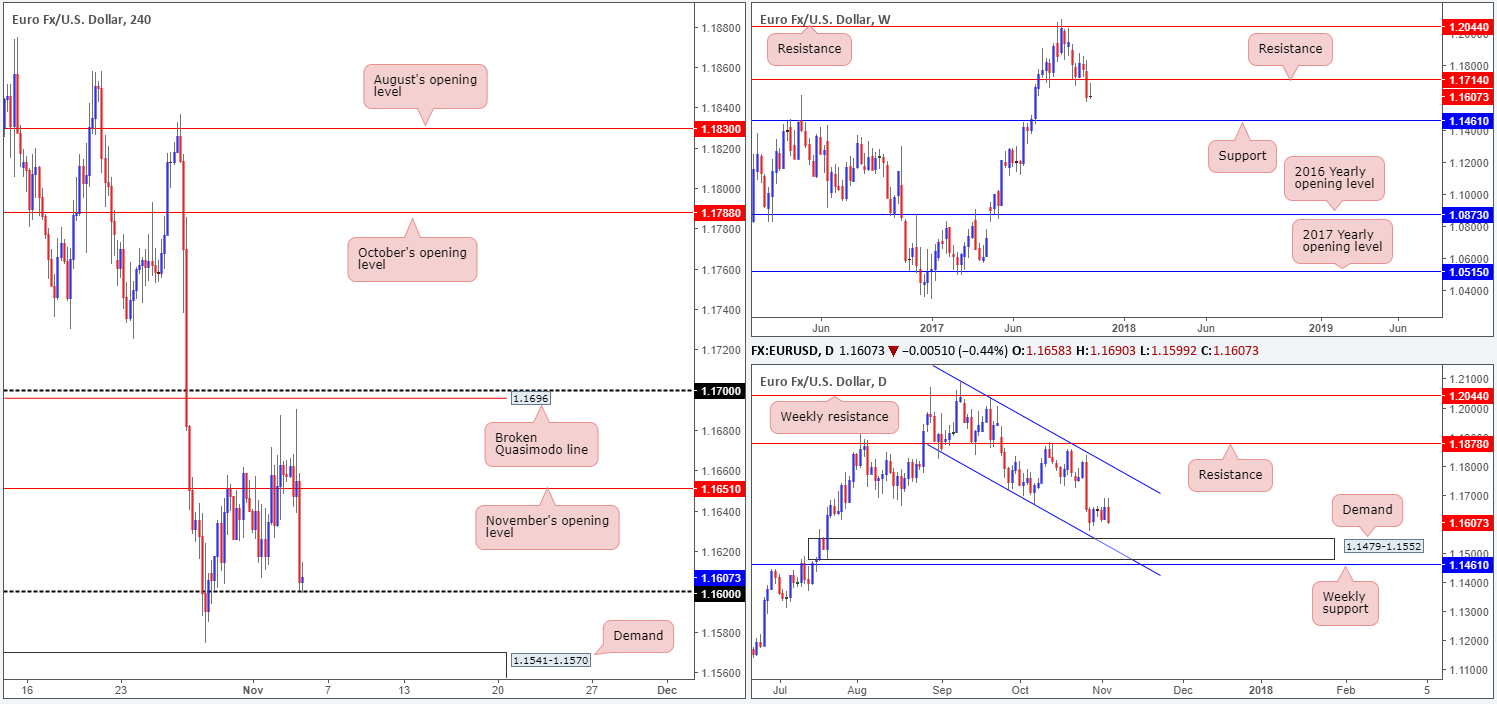
EUR/USD:
Weekly gain/loss: -0.04%
Weekly closing price: 1.1607
After aggressively crunching its way through the weekly support level at 1.1714 (now acting resistance), the euro failed to maintain this bearish momentum last week. In its place, weekly price chalked up a bearish selling wick (pin bar), suggesting that a possible move down to the weekly support at 1.1416 may be on the cards this week: a level that boasts an exceedingly robust history.
Turning our attention to the daily candles, we can see that price spent last week basing just ahead of a strong-looking demand area at 1.1479-1.1552, which happens to unite with a channel support etched from the low 1.1717 and is sited just above the aforementioned weekly support. The other key thing to note here is Friday’s strong bearish engulfing candle. This, along with the noted weekly selling wick, will likely have caught the attention of candlestick sellers and potentially encourage further downside going into the new week.
A quick recap of Friday’s trade on the H4 timeframe shows that the US economy produced fewer jobs than estimated (261K vs. 312K). The euro moved higher in the immediate aftermath of the release to a high of 1.1690, despite the US unemployment rate bettering consensus. Bullish momentum quickly diminished from here, however, and was shortly after helped by an upbeat US ISM non-manufacturing PMI, which eventually brought the unit down to the 1.16 handle into the closing bell.
Suggestions: While H4 price begun mildly paring losses from 1.16 on Friday, further buying from here is unlikely due to where price is located on the bigger picture. Does that mean a sell on the break of 1.16 is what we should be eyeing? Not necessarily. Beneath 1.16 sits a H4 demand coming in at 1.1541-1.1570 that is positioned around the top edge of the noted daily demand.
Our idea going into today’s segment is to watch for price to tackle the aforesaid H4 demand base. This area is, in our humble view, good enough for an intraday move back up to at least 1.16. However, should you take this trade, do remain aware that the risk/reward from here is around 1R (that is assuming you place stops below the current H4 demand).
Data points to consider: Eurogroup meetings all day; FOMC member Dudley speaks at 5.10pm GMT.
Levels to watch/live orders:
- Buys: around demand at 1.1541-1.1570 (stop loss: 1.1540).
- Sells: Flat (stop loss: N/A).
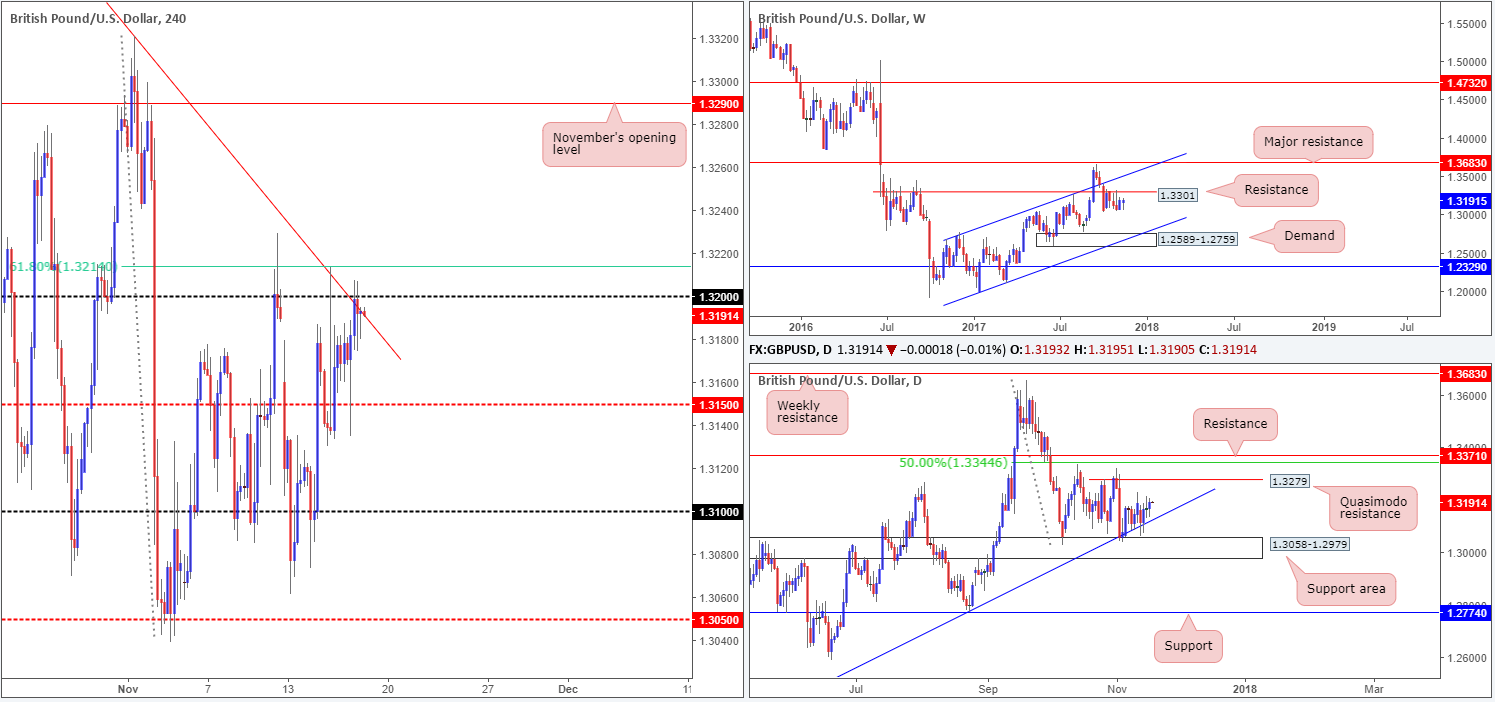
GBP/USD:
Weekly gain/loss: -0.40%
Weekly closing price: 1.3075
Pound sterling sustained further losses last week, erasing 50 pips off of its value. Weekly price, as you can see, ended the week chalking up a bearish selling wick (pin bar) that tapped the underside of a weekly resistance level coming in at 1.3301. This could possibly fuel further selling this week since there is room for the market to push as far south as the weekly demand area at 1.2589-1.2759, which aligns beautifully with a channel support etched from the low 1.1986.
Before weekly sellers can move this market lower, nonetheless, the daily support area at 1.3058-1.2979 (fuses nicely with a trendline support etched from the low 1.2108) will need to be engulfed. Also notable here is that the history surrounding this zone is reasonably strong, so the bears may have their work cut out for them this week.
A brief look at recent dealings on the H4 timeframe shows that the spike seen through 1.31 was largely due to the lower-than-expected US non-farm payrolls number. As you can see though, this was not enough to convince investors to continue bidding the market into the close.
Suggestions: Technically, there is still a clear conflict of opinion on the higher timeframes at the moment. In addition to this, we do not see any technical confluence on the H4 timeframe, thus making it a somewhat difficult market to trade right now.
Data points to consider: FOMC member Dudley speaks at 5.10pm GMT.
Levels to watch/live orders:
- Buys: Flat (stop loss: N/A).
- Sells: Flat (stop loss: N/A).
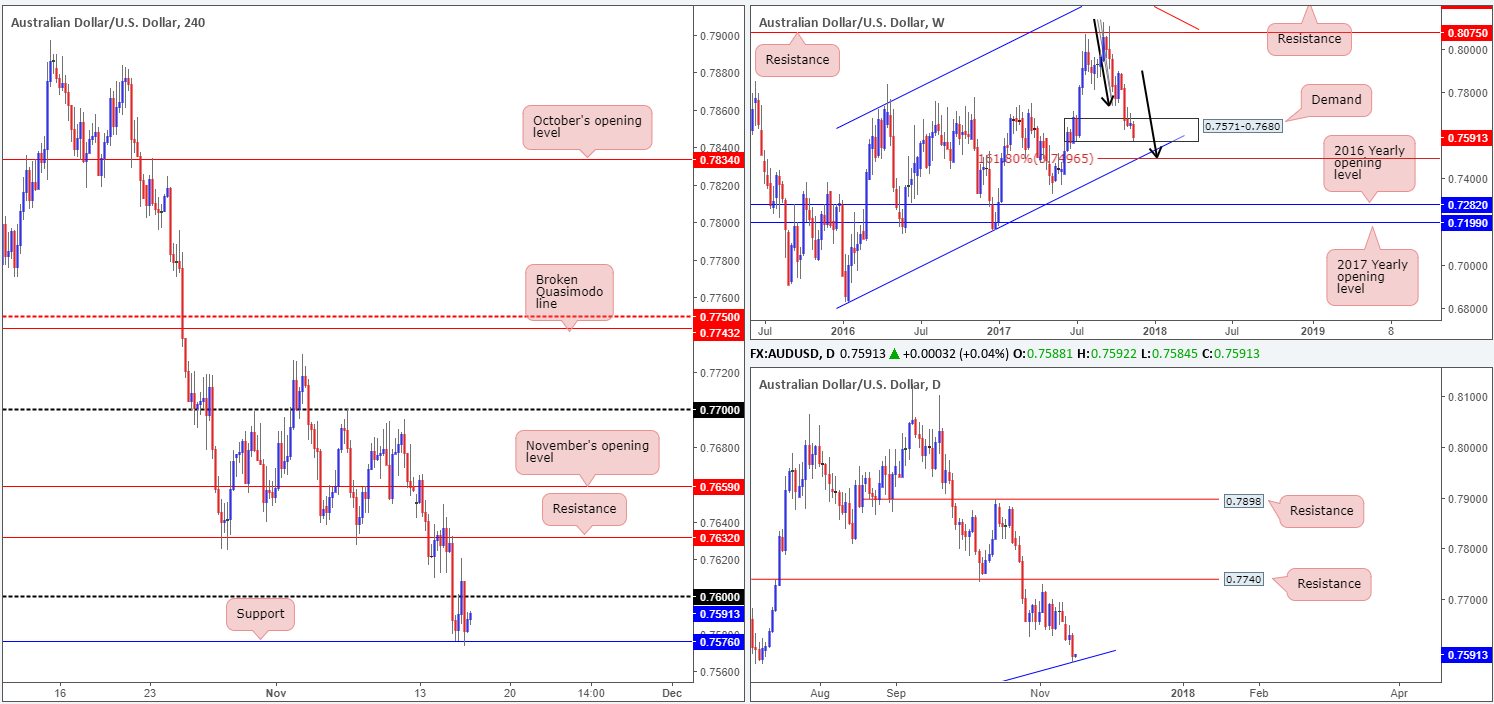
AUD/USD:
Weekly gain/loss: -0.36%
Weekly closing price: 0.7646
The AUD/USD continued to spiral south last week, despite weekly price seen trading within the walls of a weekly demand base coming in at 0.7571-0.7680. So long as that the bears remain in the driving seat this week, we could see this demand taken out and the weekly channel support extended from the low 0.6827 brought into the fray. What’s tasty about this channel support is the fact that it aligns with an AB=CD (see black arrows) 161.8% Fib ext. at 0.7496.
In conjunction with the weekly timeframe, there’s a daily demand area plotted at 0.7571-0.7623 (seen housed within the lower limits of the current weekly demand) that converges with a daily trendline support drawn from the low 0.7328. Also of particular interest here is the additional daily trendline support taken from the low 0.7159 seen positioned just beneath the current daily demand.
The aftermath of Friday’s lower-than-expected US job’s report saw the commodity currency spike to highs of 0.7694. Leaving the nearby 0.77 handle unchallenged, the pair quickly reversed gains and closed the week mid-way between November’s opening level at 0.7659 and H4 support line at 0.7632.
Suggestions: There’s a healthy chance that we may see the H4 candles challenge support at 0.7632 amid today’s trading. Should one be interested in buying from this line, you may want to take note that a fakeout south is likely, due to the top edge of the noted daily demand prowling just below at 0.7623.
Should H4 price chalk up a reasonably sized bullish candle from 0.7632, preferably in the shape of a full or near-full-bodied candle, our desk would, once again, consider entering long from this neighborhood and look to target 0.7659 as a cue to begin reducing risk.
Data points to consider: FOMC member Dudley speaks at 5.10pm GMT.
Levels to watch/live orders:
- Buys: 0.7632 region ([waiting for a reasonably sized H4 bullish candle to form – preferably a full or near-full-bodied candle – is advised] stop loss: ideally beyond the candle’s tail).
- Sells: Flat (stop loss: N/A).
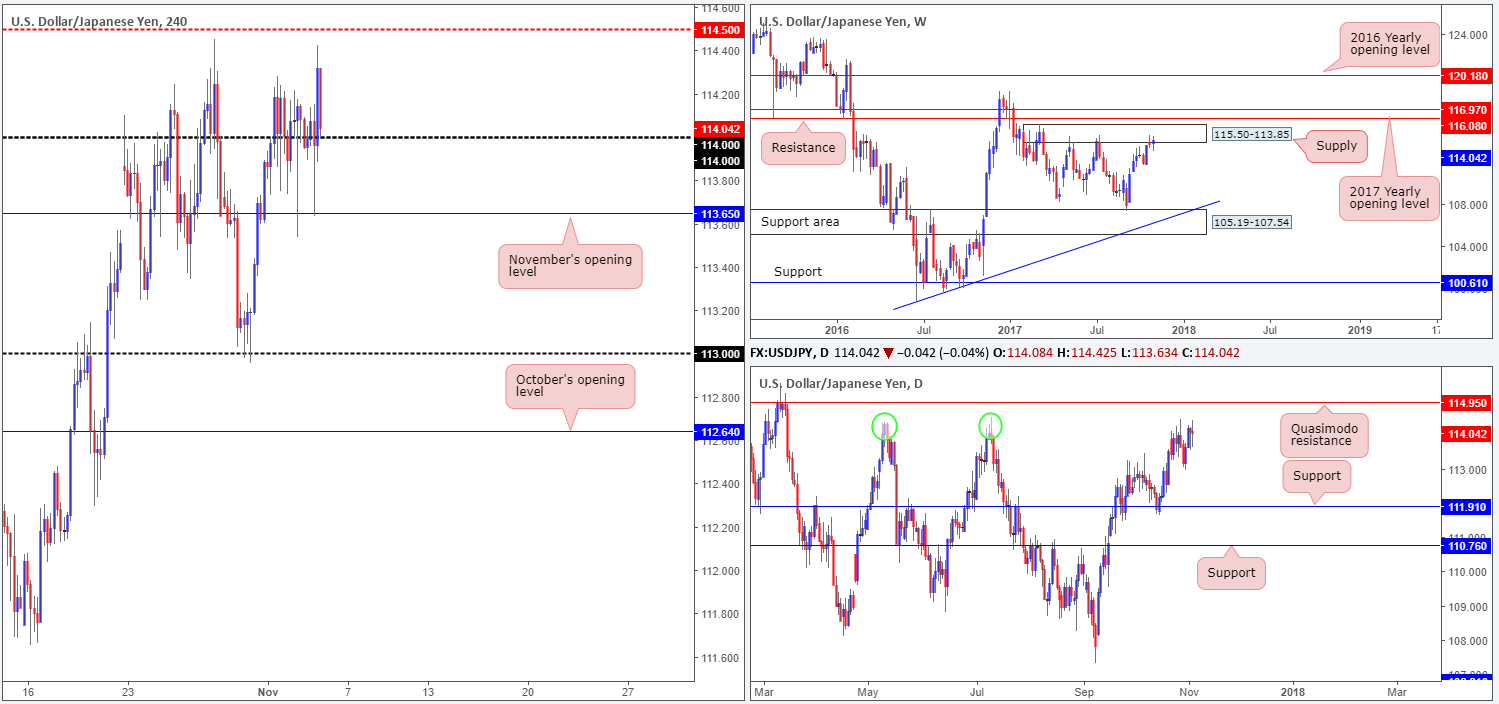
USD/JPY:
Weekly gain/loss: +0.34%
Weekly closing price: 114.04
Over the past couple of weeks, the weekly supply at 115.50-113.85 has been on the radar. Although the sellers have yet to register anything noteworthy from here, this is not your average run-of-the-mill supply, as it has held price lower on two separate occasions so far this year. Therefore, there’s a chance that we may see history repeat itself.
Evaluating the daily timeframe, nevertheless, we can actually see that there is room for the pair to punch higher this week. The daily Quasimodo resistance at 114.95 is, as far as we can see, just begging to be challenged. Our rationale behind this approach is simply due to the amount of stops likely lurking just above the two highs circled in green at 114.36/114.39. Remember, a seller’s stop-loss order becomes a buy once filled and this is exactly what the big boys require if they’re intending on shorting from 114.95 (liquidity).
On Friday, the pair bottomed around November’s opening level seen on the H4 timeframe at 113.65, following the release of US job’s data. While the report came in below consensus, the pair quickly bounced back from 113.65, erasing all losses and closing the day a few pips above the 114 handle.
Suggestions: On two occasions now, we’ve seen price top just ahead of the H4 mid-level resistance 114.50. This, in our opinion, does not signify strong supply here, and this is largely due to what’s lurking 45 pips above it: the aforementioned daily Quasimodo resistance level!
For that reason, the only area that really jumps out at us this week is the daily Quasimodo resistance line. Selling from this angle allows traders to position their stops beyond weekly supply at 115.50-113.85.
Data points to consider: FOMC member Dudley speaks at 5.10pm GMT; BoJ Gov. Kuroda also speaks sometime today.
Levels to watch/live orders:
- Buys: Flat (stop loss: N/A).
- Sells: 114.95 region (stop loss: above weekly supply at 115.52).
USD/CAD:
Weekly gain/loss: -0.35%
Weekly closing price: 1.2757
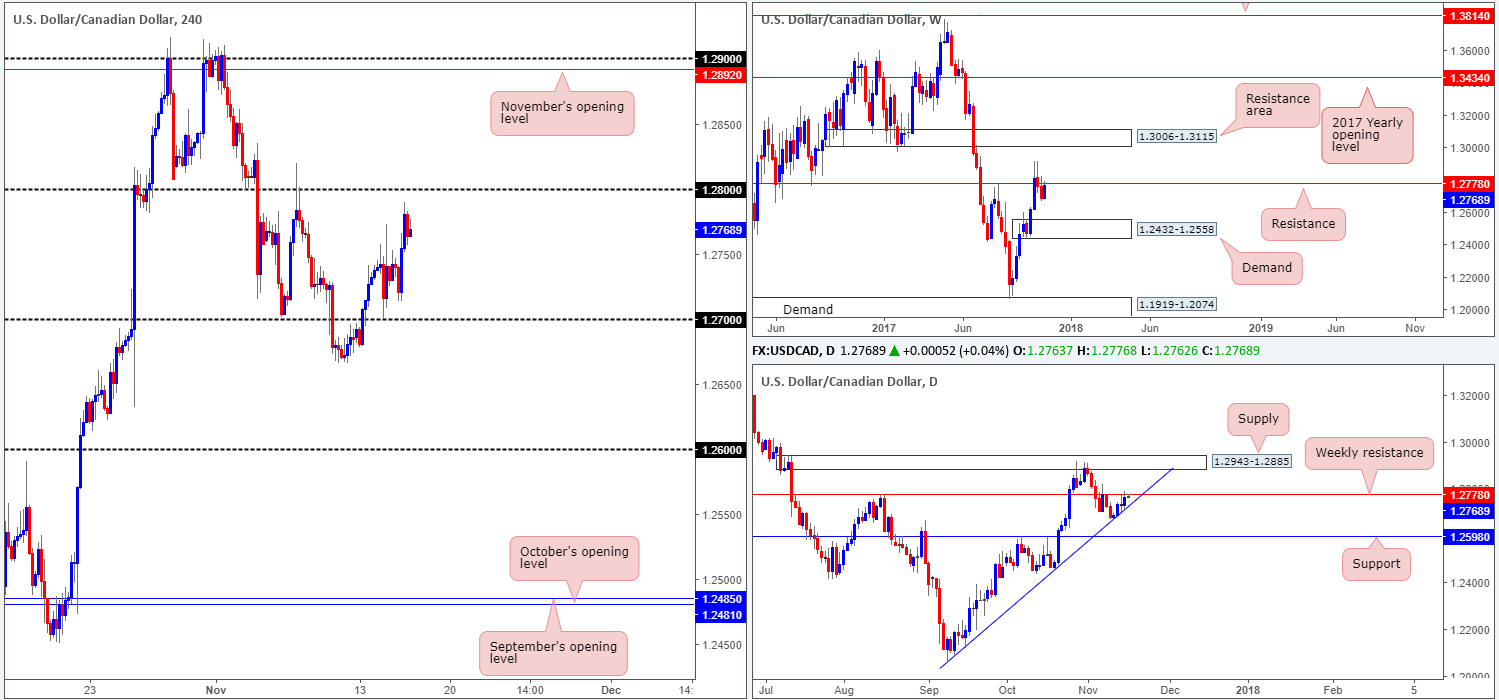
The USD/CAD failed in its attempt to extend gains above the weekly resistance at 1.2778 last week, consequently forming two back-to-back weekly selling wicks. The break back below this resistance has potentially sparked seller interest this week down to weekly demand pegged at 1.2432-1.2558.
A closer look at price action on the daily timeframe highlights that although the unit ended the week beneath weekly resistance, sellers still have to contend with the possibility of potential buyers from a broken Quasimodo line at 1.2753. A daily close beyond here, however, could ‘seal the deal’ for lower prices down to at least support at 1.2598, which happens to fuse nicely with a trendline support etched from the low 1.2061.
Following the release of Friday’s US and Canadian job’s figures, H4 candle action immediately headed south. Non-farm payrolls rose at a notable rate but failed to meet consensus, while Canada’s employment came in better than expected at 35K vs. 15K. As you can see, the move took out the 1.28 handle and its surrounding H4 demand at 1.2781-1.2816, which was later retested as a resistance area going into the close.
Suggestions: While there is very little structure seen stopping the H4 candles from trading down to 1.27 from the H4 area at 1.2781-1.2816 this week, we would advise caution since it is difficult to judge whether bids are consumed from the aforementioned broken daily Quasimodo line.
A safer short, in our view, would be to wait and see if H4 price closes sub 1.27. A close below here, followed up with a retest, would be an ideal sell signal down to 1.26. 1.26, as you may have already noticed, represents the daily support mentioned above at 1.2598.
Data points to consider: FOMC member Dudley speaks at 5.10pm; CAD Ivey PMI at 3pm GMT.
Levels to watch/live orders:
- Buys: Flat (stop loss: N/A).
- Sells: Safer shorts appear to be beyond 1.27.
USD/CHF:
Weekly gain/loss: +0.29%
Weekly closing price: 1.0001
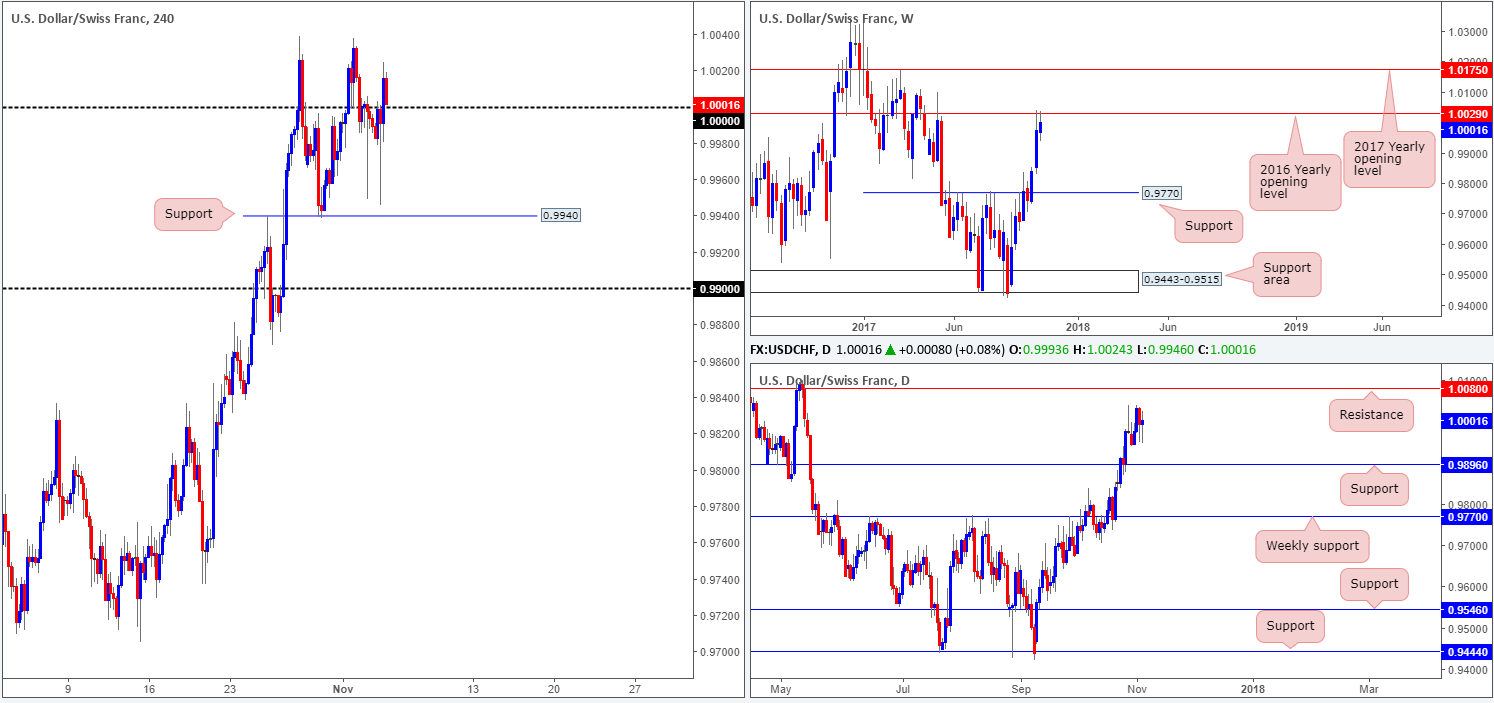
Despite recently shaking hands with the 2016 yearly opening level seen on the weekly timeframe at 1.0029, the USD/CHF was able to chalk up its third consecutive weekly bull candle last week. Assuming that the bulls continue to press higher and take out this level, the next port of call, also seen on the weekly timeframe, will likely be the 2017 yearly opening level at 1.0175.
Looking down to the daily timeframe, we can see that although there’s a clear bullish tone in this market right now, the candles were somewhat mixed last week. Price is seen trading mid-range between resistance at 1.0080 and support coming in at 0.9896.
For those who read Friday’s report you may recall that the desk highlighted a possible short at the underside of parity (1.0000). While price did selloff from this number, thanks to non-farm payrolls coming in below consensus, there was not enough candle confirmation for us to short, so we passed.
Suggestions: Despite the Swissie ending the day closing a few pips above parity, this is a difficult level to buy from, in our opinion. Yes, daily price shows room to springboard up to the 1.0080 mark, but let’s remember that weekly price is currently capped by the 2016 yearly opening level mentioned above at 1.0029. So, for now, a sell below parity might be a better path to take, targeting H4 support at 0.9940 as an initial take-profit zone.
Data points to consider: FOMC member Dudley speaks at 5.10pm GMT.
Levels to watch/live orders:
- Buys: Flat (stop loss: N/A).
- Sells: Watch for H4 price to engulf the 1.0000 region and then look to trade any retest seen thereafter ([waiting for a reasonably sized H4 bearish candle to form following the retest – preferably a full or near-full-bodied candle – is advised] stop loss: ideally beyond the candle’s wick).
DOW 30:
Weekly gain/loss: +0.34%
Weekly closing price: 23506
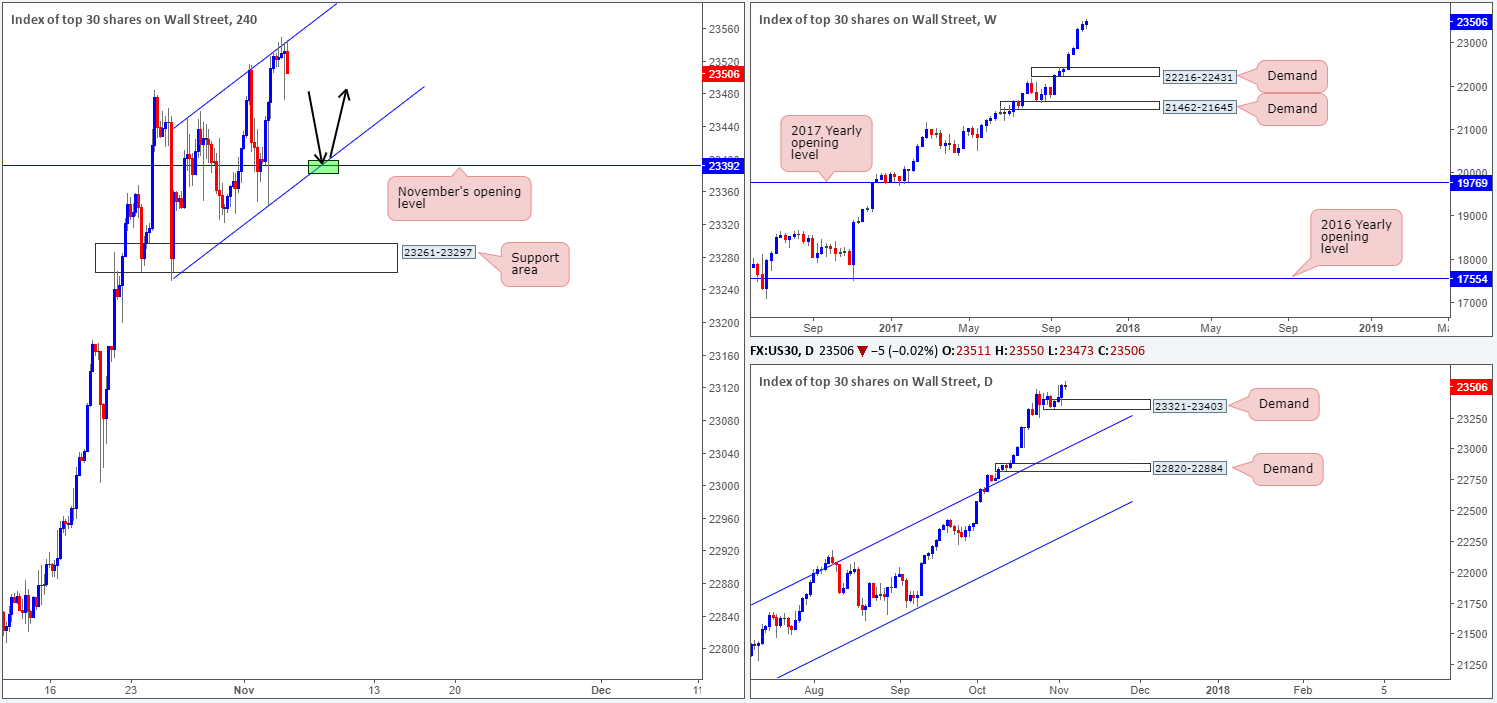
US stocks extended higher for an eighth consecutive session last week, dragging the index up to a fresh record high of 23550. Should the unit pullback this week, the next weekly downside target in view is demand coming in at 22216-22431. On the daily timeframe, the closest demand base can be seen at 23321-23403.
Friday was a relatively quiet day for the DJIA, down 0.02% on the day. As you can see, the H4 candles recently crossed swords with a channel resistance extended from the high 23452 and ended the session printing a full-bodied H4 bearish candle.
Suggestions: In light of Friday’s H4 closing candle and the aforesaid H4 channel resistance, further downside could be seen to the neighboring H4 channel support etched from the low 23250 today/this week. Should H4 price test the point at where the channel support and November’s opening level at 23392 converge (green marker), this is a valid long, in our opinion. Even more so considering that the monthly opening level is sited within the aforementioned daily demand – a perfect area to measure a stop-loss order from!
Data points to consider: FOMC member Dudley speaks at 5.10pm GMT.
Levels to watch/live orders:
- Buys: 23392 region (stop loss: 23319).
- Sells: Flat (stop loss: N/A).
GOLD:
Weekly gain/loss: -0.26%
Weekly closing price: 1269.4
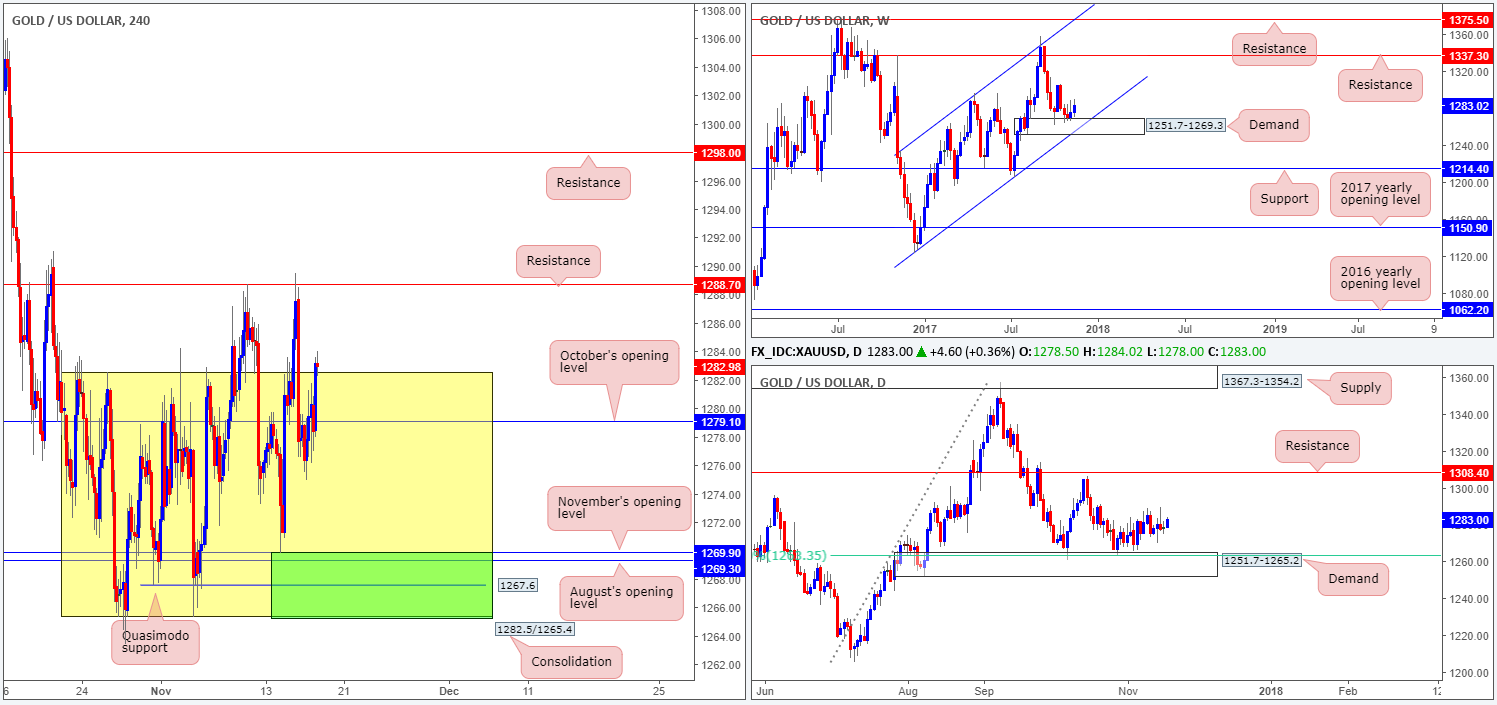
In a similar fashion to the AUD/USD, the gold market also continued to extend losses last week. Judging by the weekly candles, however, downside momentum appears to be diminishing which could simply be down to the weekly demand base currently in play at 1251.7-1269.3 (intersects with a weekly channel support taken from the low 1122.8).
Supporting the aforementioned weekly demand is a daily demand (housed within the lower limits of the weekly zone) at 1251.7-1265.2. Also of interest on the daily timeframe is the 61.8% Fib support at 1263.2 taken from the low 1205.0, seen plotted within the walls of the noted daily demand.
The after-effects of Friday’s US job’s numbers saw the yellow metal pierce October’s opening level at 1279.1, reaching a high of 1280.4. This, as you can see though, was a short-lived move. Shortly after this, H4 price tumbled lower, breaking through both August and November’s opening levels at 1269.3/1269.9, eventually crossing swords with a H4 Quasimodo support level at 1265.9.
Suggestions: While the price of gold has somewhat suffered over the past three weeks, we still have faith in the aforementioned weekly and daily structures this week. In the event that H4 price prints a bullish close above 1269.9 (Nov’s opening level), and follows up with a retest as support, this, in our opinion, would be a valid buy signal, targeting October’s opening level at 1279.1 as an initial take-profit zone.
Levels to watch/live orders:
- Buys: Watch for H4 price to engulf 1269.9 and then look to trade any retest seen thereafter ([waiting for a reasonably sized H4 bullish candle to form following the retest – preferably a full or near-full-bodied candle – is advised] stop loss: ideally beyond the candle’s tail).
- Sells: Flat (stop loss: N/A).


