Monday 5th June: Technical outlook and review. Most European banks are closed today in observance of Whit Monday.
Waiting for lower timeframe confirmation is our main tool to confirm strength within higher timeframe zones, and has really been the key to our trading success. It takes a little time to understand the subtle nuances, however, as each trade is never the same, but once you master the rhythm so to speak, you will be saved from countless unnecessary losing trades. The following is a list of what we look for:
- A break/retest of supply or demand dependent on which way you’re trading.
- A trendline break/retest.
- Buying/selling tails/wicks – essentially we look for a cluster of very obvious spikes off of lower timeframe support and resistance levels within the higher timeframe zone.
- Candlestick patterns. We tend to stick with pin bars and engulfing bars as these have proven to be the most effective.
We typically search for lower-timeframe confirmation between the M15 and H1 timeframes, since most of our higher-timeframe areas begin with the H4. Stops are usually placed 1-3 pips beyond confirming structures.
EUR/USD:
Weekly gain/loss: + 102 pips
Weekly closing price: 1.1280
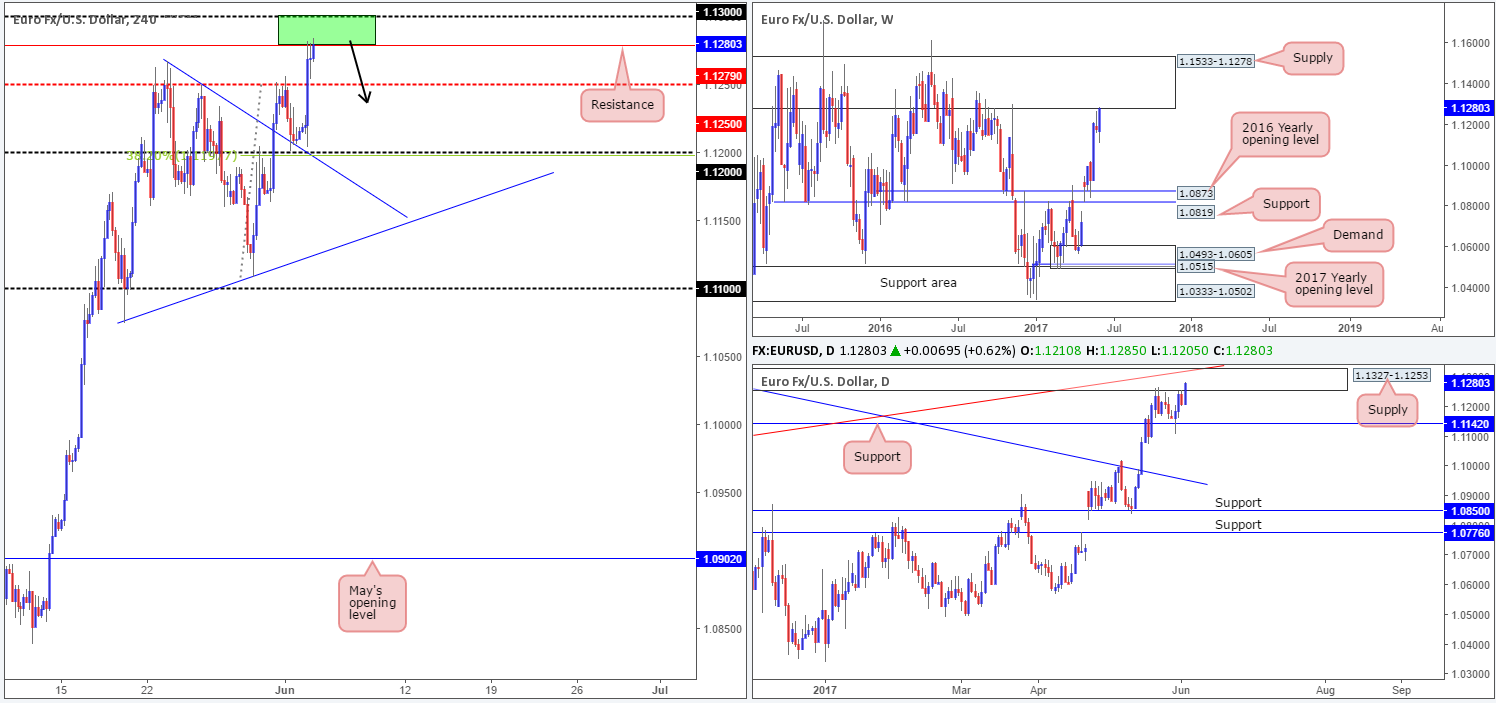
Thanks to last week’s push to the upside (which for all you candle enthusiasts out there, formed a bullish engulfing candle) weekly supply at 1.1533-1.1278 is now in play. The zone has also managed to cap upside since May 2015, so it’s not a base one should overlook!
Glued to the underside of the said weekly supply area is a daily supply zone visible at 1.1327-1.1253, which happens to intersect with a daily trendline resistance etched from the low 1.0711. Although Friday’s candle pushed higher into this zone, shaped by a near-full-bodied bullish candle, it deserves respect since it has held the unit lower since mid-September 2016.
Friday’s disappointing US employment report saw the EUR/USD increase in value as the US dollar took a hit, clocking a low of 96.72. Payroll numbers revealed the US economy added 138k jobs in May, missing market consensus at 185k. The unemployment rate came in slightly above expectations at 4.3%, while average hourly earnings came in as expected at 0.2%.
While we agree the bulls do look in fine form on the H4 chart, following the recent bounce off the trendline support etched from the high 1.1267 (shadowed closely by the 1.12 handle), there may trouble lurking ahead. Thanks to Friday’s advance, we are now seeing price test resistance coming in at 1.1279, which is followed closely by the large psychological band 1.30. Combined, these two levels are of interest to our desk.
Our suggestions: Due to the said H4 zone marked in green forming within the above noted higher-timeframe supplies, we’re keen to short from this area. However though, we would need to see a reasonably sized H4 bearish candle form here, preferably a full-bodied candle, before pulling the sell trigger. This is mainly because we feel price may look to challenge 1.30 and possibly whipsaw above it before serious sellers step in. Should this trade come to fruition, our first take-profit zone will be the mid-level support pegged at 1.1250.
Data points to consider: US ISM Non-manufacturing PMI at 3pm GMT+1.
Levels to watch/live orders:
- Buys: Flat (stop loss: N/A).
- Sells: 1.13/1.1279 ([waiting for a reasonably sized H4 bear candle – preferably a full-bodied candle – to form before pulling the trigger is advised] stop loss: ideally beyond the candle’s wick).
GBP/USD:
Weekly gain/loss: + 84 pips
Weekly closing price: 1.2889
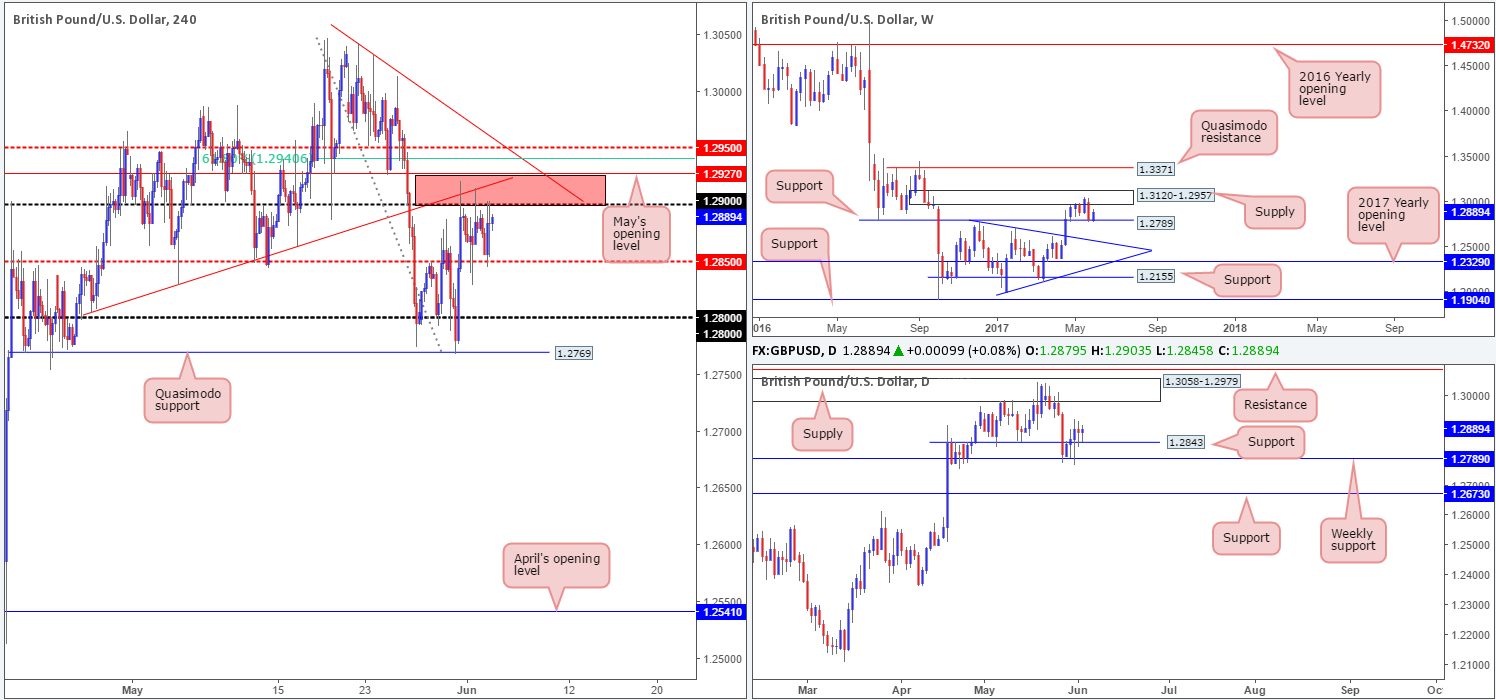
Despite the strong bearish move from weekly supply at 1.3120-1.2957 two weeks back, weekly sellers could not muster enough strength to breach weekly support at 1.2789 last week. This could lead to price forming a tight consolidation between these two structures in the weeks to come.
The bounce from weekly support forced the daily candles to break above 1.2843, which, as you can see, provided support for the remainder of the week. Supposing the level continues to hold, it’s likely we’ll see supply at 1.3058-1.2979 come into action (positioned within the limits of the said weekly supply).
The aftermath of Friday’s US job’s report saw the H4 bulls bounce from mid-level support at 1.2850 and touch gloves with the 1.29 handle, consequently forming a range between the two levels. The top edge of this range, however, is bolstered by May’s opening level at 1.2927 and a H4 trendline resistance taken from the low 1.2804 (red zone).
Our suggestions: At this moment in time, we would still not consider becoming a seller in this market, despite the H4 (red) zone housing confluence. The reason for why is due to the lower edge of the said weekly supply being positioned a tad above this sell zone at 1.2957. So therefore, a sell from the H4 mid-level resistance 1.2950 (merges with a H4 trendline resistance taken from the high 1.3042 and a H4 61.8% Fib resistance at 1.2941 extended from the high 1.3047) may be the more logical approach, in our humble opinion.
However, we must stress that there is also a strong possibility of a fakeout being seen around 1.2950. This is because the lower edge of daily supply does not come into view until 1.2979. With that, we feel waiting for a lower-timeframe confirming setup to form (see the top of this report) around 1.2950 might be the better/safer route to take here before pulling the trigger.
Data points to consider: UK Services PMI at 9.30am. US ISM Non-manufacturing PMI at 3pm GMT+1.
Levels to watch/live orders:
- Buys: Flat (stop loss: N/A).
- Sells: 1.2950 region ([waiting for a lower-timeframe sell signal to print is advisable] stop loss: dependent on where one confirms this line).
AUD/USD:
Weekly gain/loss: – 3 pips
Weekly closing price: 0.7442
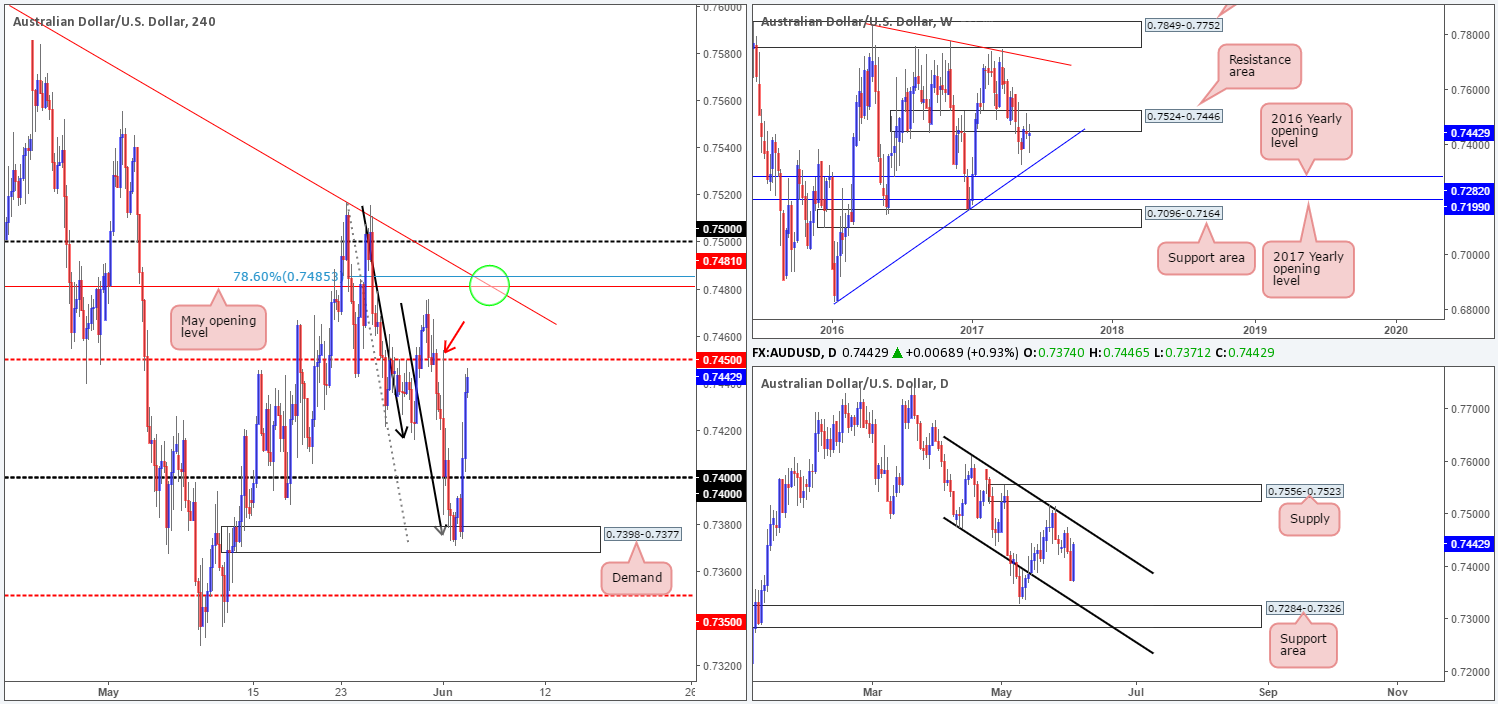
AUD/USD prices are effectively unchanged this week, despite ranging over 100 pips. Regardless of this though, weekly price remains loitering beneath the weekly supply coming in at 0.7849-0.7752 and therefore could eventually push the couple down to a trendline support etched from the low 0.6827.
Bouncing down to the daily timeframe, it’s relatively clear to see the candles have been trading within a descending channel since April. Judging by Friday’s advancing candle, it looks as though we may be in for a test of the upper edge of this said channel sometime this week.
A closer look at price action on the H4 chart shows demand at 0.7398-0.7377, which happened to hold a H4 AB=CD bullish completion point (see black arrows) within, hold firm on Friday. The move, however, was further bolstered by a disappointing US employment report that helped clear offers from the 0.74 handle. Friday’s rally continued throughout the US segment and ended the day closing just ahead of the H4 mid-level resistance marked at 0.7450.
Our suggestions: We have little interest in trying to short 0.7450 since it appears that most of the orders here may have already been tagged by the H4 wick seen marked with a red arrow at 0.7454. This leaves May’s opening level at 0.7481 (blends nicely with both the upper edge of the daily descending channel mentioned above and a 78.6% retracement taken from the high 0.7517) on the radar.
With there being a possibility of price whipsawing through 0.7481 up to the 0.75 handle, we would, if you consider 0.7481 to be an adequate sell zone, advise waiting for a lower-timeframe sell signal to take shape before committing to a position (see the top of this report).
Data points to consider: US ISM Non-manufacturing PMI at 3pm GMT+1.
Levels to watch/live orders:
- Buys: Flat (stop loss: N/A).
- Sells: 0.7481 region ([waiting for a lower-timeframe sell signal to print is advisable] stop loss: dependent on where one confirms this line).
USD/JPY:
Weekly gain/loss: – 87 pips
Weekly closing price: 110.43
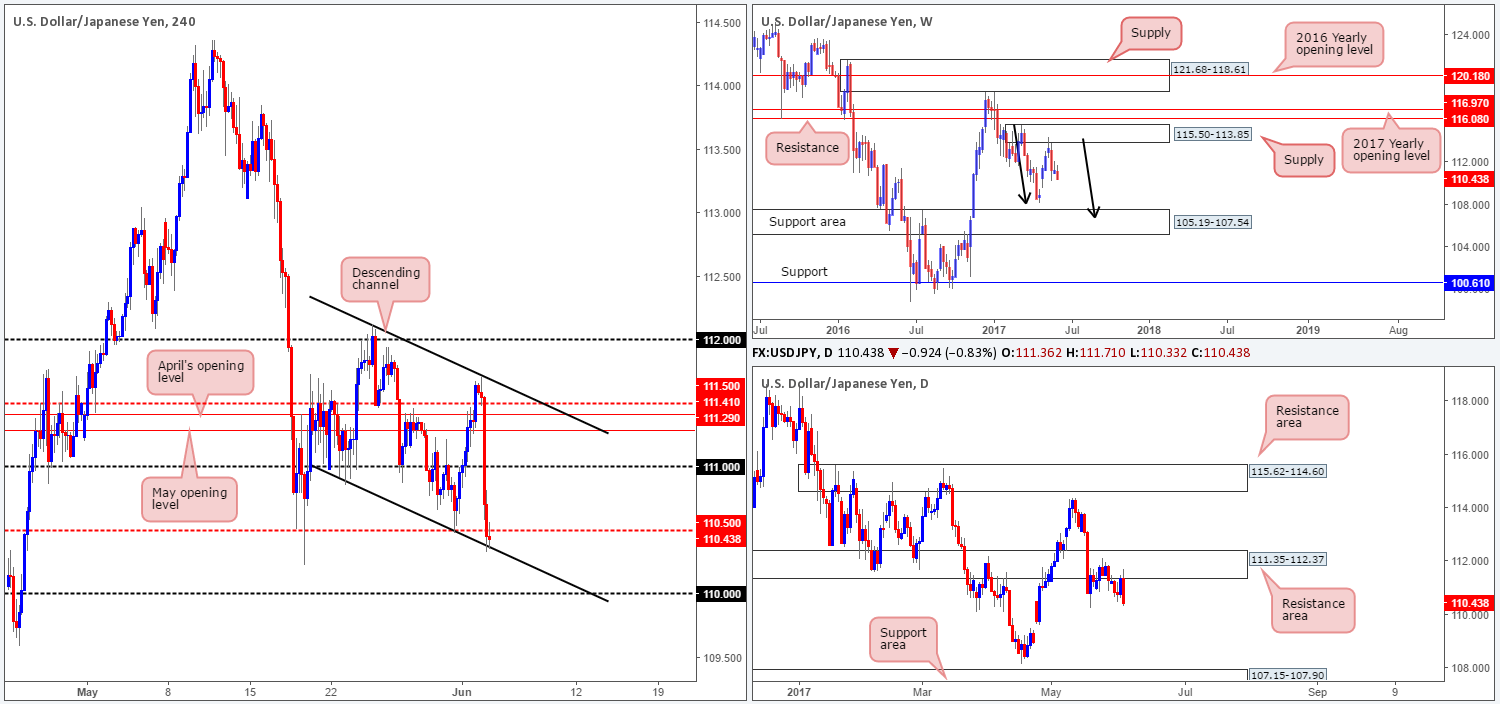
Weekly bears remain in a relatively strong position after pushing aggressively lower from supply registered at 115.50-113.85. We know there’s a lot of ground to cover here, but this move could possibly result in further downside taking shape in the form of a weekly AB=CD correction (see black arrows) that terminates within a weekly support area marked at 105.19-107.54 (stretches all the way back to early 2014).
In conjunction with weekly flow, daily price continues to defend the resistance area penciled in at 111.35-112.37. Also noteworthy is Friday’s action printed a strong-looking bearish engulfing candle from this zone, which could see price drive lower in the coming week to 107.15-107.90: a support zone that’s glued to the top edge of the said weekly support area.
Looking over to the H4 candles, price failed to sustain gains beyond the mid-level number 111.50 on Friday and plummeted lower. The move was initiated by a weak US employment report that saw price conclude trade closing below the mid-level number 110.50. With both weekly and daily charts indicating that further downside may be on the cards, we feel it’s unlikely that the channel support taken from the low 110.92 will hold firm.
Our suggestions: With the above notes in mind, our desk will be assessing how the lower-timeframe price action behaves beneath 110.50. Should we happen to come across a lower-timeframe signal (see the top of this report for signals that we use), we would, dependent on the time of day, look to sell this market and target the 110 handle as an initial take-profit zone.
Data points to consider: US ISM Non-manufacturing PMI at 3pm GMT+1.
Levels to watch/live orders:
- Buys: Flat (stop loss: N/A).
- Sells: 110.50 region ([waiting for a lower-timeframe sell signal to print is advisable] stop loss: dependent on where one confirms this line).
USD/CAD:
Weekly gain/loss: + 39 pips
Weekly closing price: 1.3485
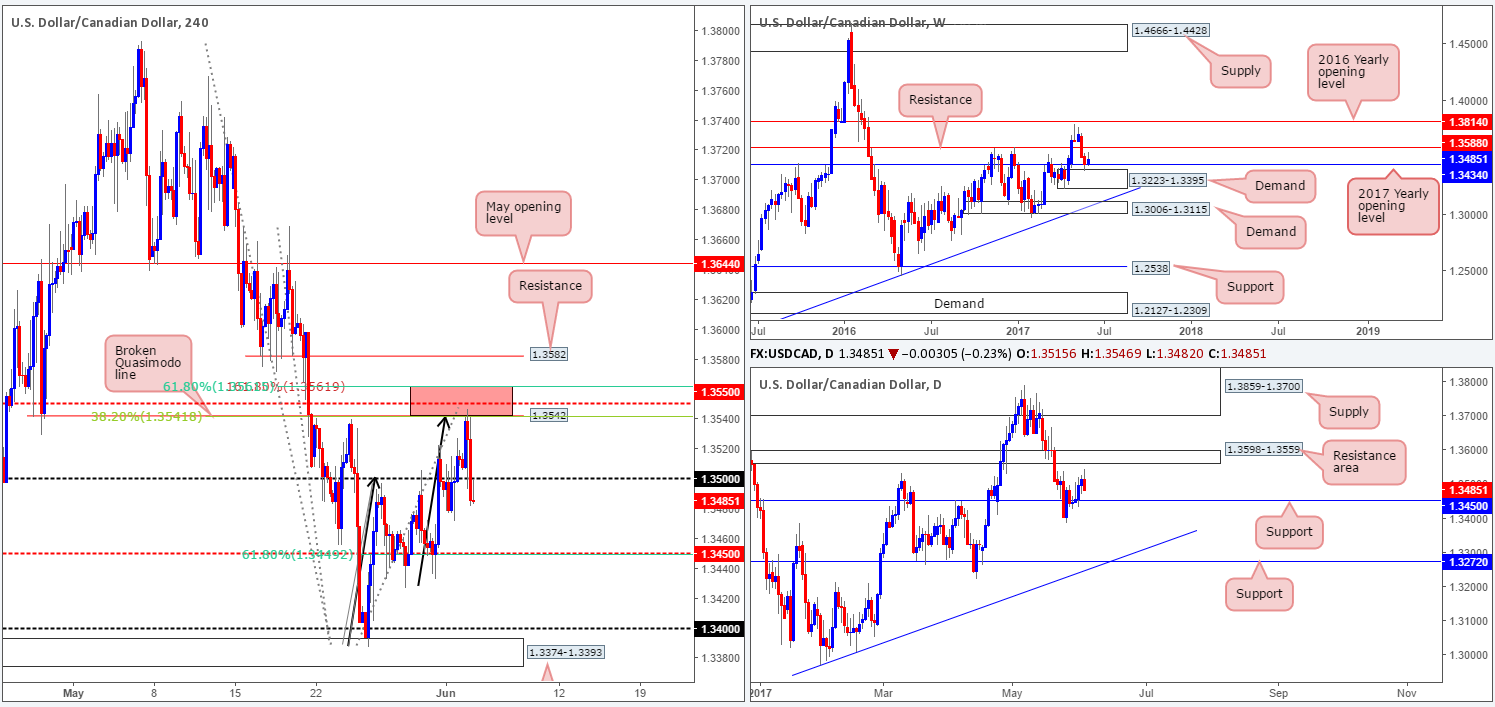
Despite last week’s end-of-week correction, the pair remains bolstered by the 2017 yearly opening level pegged at 1.3434. Sitting directly beneath this line is a weekly demand penciled in at 1.3223-1.3395, while to the upside we have a weekly resistance line drawn from 1.3588.
Moving down a notch to the daily timeframe, the couple is currently seen trading between a resistance area at 1.3598-1.3559 and a support base chalked in at 1.3450. With this support level consumed, there’d be little stopping the unit from challenging support at 1.3272, which happens to tie in beautifully with a trendline support (1.2968). A break beyond the current resistance area on the other hand would likely draw price back up to supply visible at 1.3859-1.3700, which holds the 2016 yearly opening level within at 1.3814.
For those who read Friday’s report you may recall our desk highlighting the 1.3561/1.3541 H4 zone marked in red as a potential place to short from. As you can see, with the help of lower-than-expected US employment figures, the pair sold off beautifully from this zone. Well done to any of our readers who managed to jump aboard this one, as price closed the week out below the 1.35 handle!
Our suggestions: Looking to short beyond 1.35 is, of course, an option here. Nevertheless, selling this market knowing that weekly price is trading from support (the 2017 yearly opening level) as well as daily price lurking just ahead of support mentioned above at 1.3450, is not really our cup of tea! It poses too much of a risk, in our opinion.
Instead, what we’re now looking at is longs from the H4 mid-level support 1.3450 (also denotes a daily support as highlighted above). This – coupled with 1.3450 being joined by a 61.8% H4 Fib support line taken from the low 1.3387 and also the current weekly support, it is likely going to produce a bounce higher. To be on the safe side here though, we’d recommend waiting for the lower timeframes to prove buyer interest exists here (see the top of this report). This will help avoid an unnecessary loss.
Data points to consider: US ISM Non-manufacturing PMI at 3pm GMT+1.
Levels to watch/live orders:
- Buys: 1.3450 region ([waiting for a lower-timeframe buy signal to print is advisable] stop loss: dependent on where one confirms this line).
- Sells: Flat (Stop loss: N/A).
USD/CHF:
Weekly gain/loss: – 119 pips
Weekly closing price: 0.9624
(Trade update: suffered a small loss on the long taken from 0.9708).
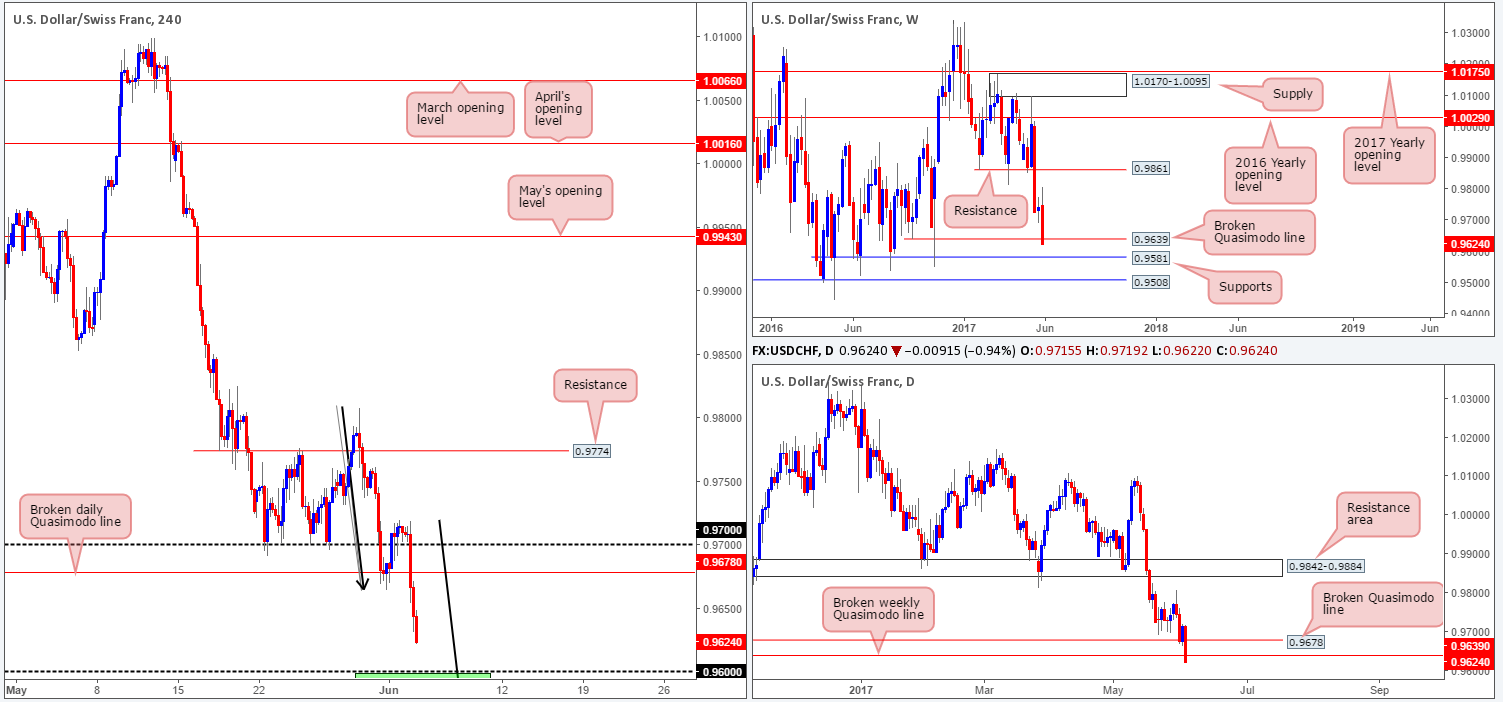
Following a brief pause, the USD/CHF resumed its decline south last week and consequently closed below the weekly Quasimodo support line at 0.9639 in the shape of a full-bodied bearish candle. The next downside target beyond this line is seen around a support level drawn from 0.9581.
Friday’s close below the aforementioned weekly Quasimodo line has, as far as we can see, cleared the runway south all the way down to 0.9546: a daily triple-bottom formation. Should price reach this line, however, we’d be wary of taking a long from here since a daily Quasimodo support level is seen lurking just below at 0.9488.
The aftermath of Friday’s disappointing US non-farm payrolls data saw the Swissy aggressively run through the 0.97 handle. The pair continued to selloff during the US segment, and resulted in the market closing just ahead of the 0.96 handle.
Now, 0.96 deserves attention! Not only is it positioned nearby the weekly support mentioned above at 0.9581, it also sits close to a H4 AB=CD (see black arrows) 161.8% bullish completion point at 0.9572. In addition to this, we have correlation confluence here as well. The EUR/USD is considered oversold and will likely selloff from 1.13/1.1279 (see our EUR/USD report).
Our suggestions: Wait for H4 price to attack 0.9572/0.96 and watch to see if the H4 candles can print a reasonably sized H4 bull candle, preferably a full-bodied candle, before pushing the buy button. This, of course, will by no means guarantee a winning trade, but it will help determine buyer interest and help avoid an unnecessary loss! The first take-profit target from this base will be set around the broken daily Quasimodo line at 0.9678.
Data points to consider: US ISM Non-manufacturing PMI at 3pm GMT+1.
Levels to watch/live orders:
- Buys: 0.9572/0.96 ([waiting for a reasonably sized H4 bull candle – preferably a full-bodied candle – to form before pulling the trigger is advised] stop loss: ideally beyond the candle’s tail).
- Sells: Flat (stop loss: N/A).
DOW 30:
Weekly gain/loss: + 125 points
Weekly closing price: 21207
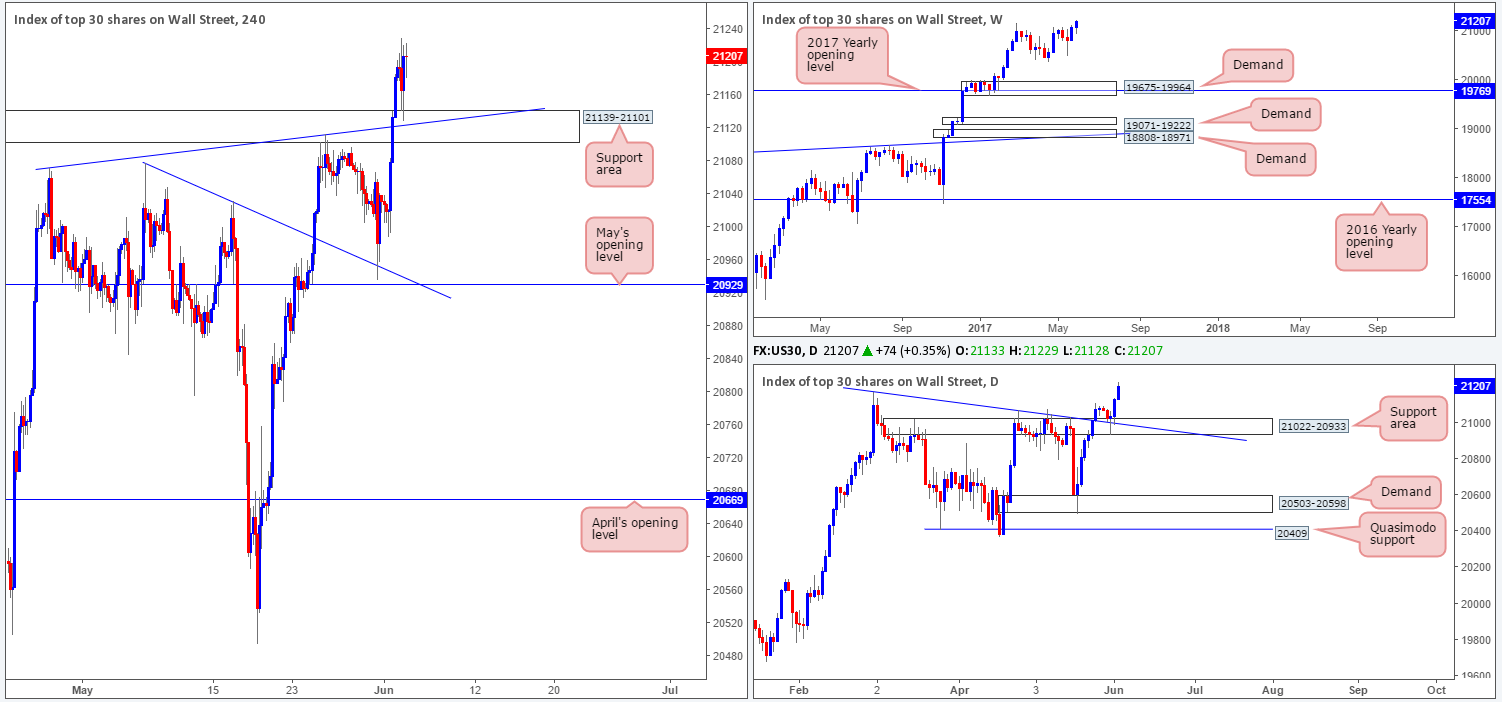
Over the course of last week’s trading, US equities punched to fresh record highs at 21229. The move came after a three-month consolidation, which achieved an ultimate low of 20371 back in mid-April.
The story on the daily chart shows that the unit extended Wednesday’s bounce further on Friday from the support area pegged at 21022-20933, which, as we already know, achieved fresh all-time highs.
For those who read Friday’s report you may remember we mentioned to keep an eye on the H4 support area at 21139-21101 (intersects with a H4 trendline support etched from the high 21072) for a potential bounce north. As you can see, this played out perfectly! Well done to any of our readers who managed to jump in long on this one!
With the market showing little resistance up ahead, we believe the DOW will likely continue to push higher in the coming week.
Our suggestions: Based on recent trading, the only thing of interest remains to be a long from the said H4 support area. However, for this happen, we’d need to see price retest the support area for a second time and hold firm. It would be absolutely fantastic to see a bullish H4 candle present itself from here in the shape of a full-bodied candle, as we’d have little hesitation in jumping in long from here!
Data points to consider: US ISM Non-manufacturing PMI at 3pm GMT+1.
Levels to watch/live orders:
- Buys: 21139-21101 ([waiting for a reasonably sized H4 bull candle to form – preferably a full-bodied candle – is advised] stop loss: ideally beyond the candle’s tail).
- Sells: Flat (stop loss: N/A).
GOLD:
Weekly gain/loss: +$12.2
Weekly closing price: 1279.1
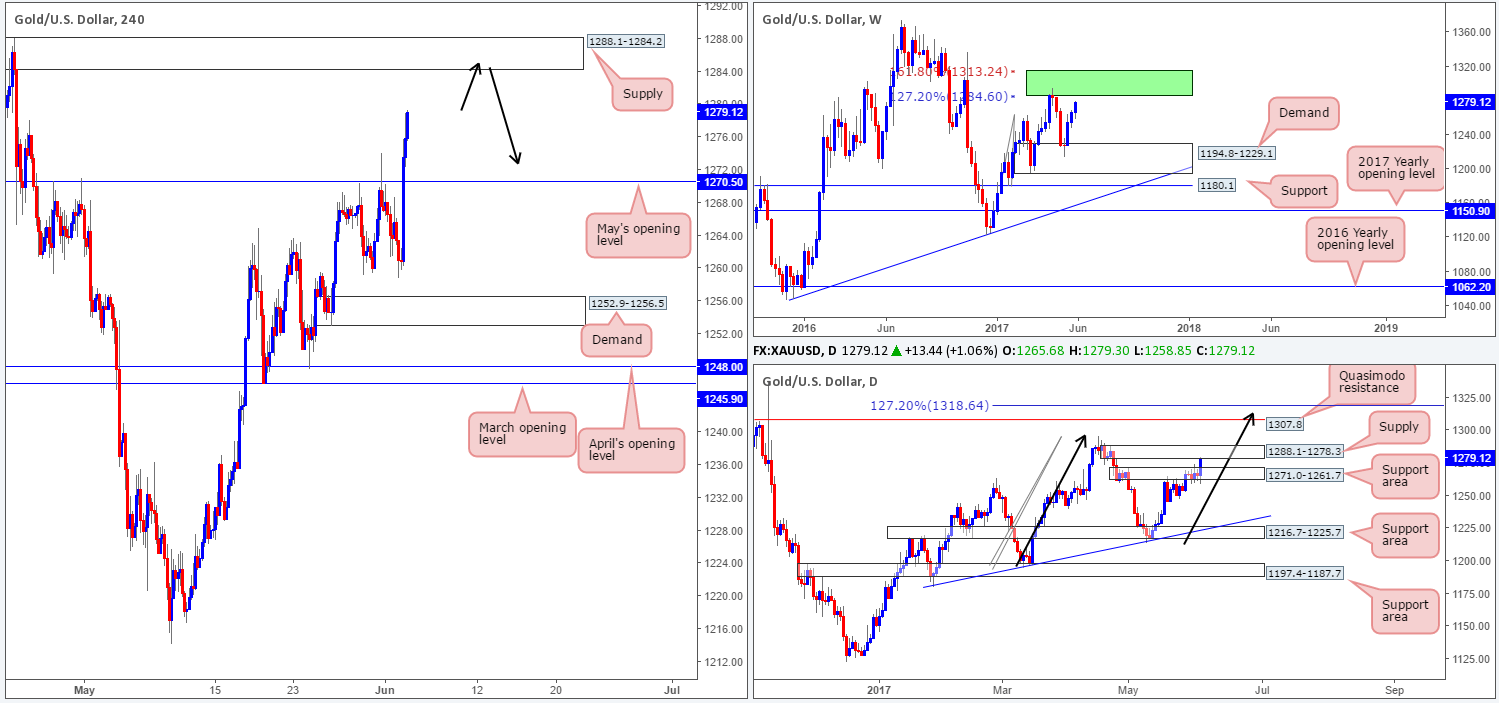
The yellow metal rallied for a third consecutive week after bouncing beautifully from weekly demand coming in at 1194.8-1229.1. This move could encourage further buying into the market and pull the unit back up to the two weekly Fibonacci extensions 161.8/127.2% at 1313.7/1285.2 taken from the low 1188.1 (green zone).
Looking down to the daily timeframe, nonetheless, we can see that the supply area at 1288.1-1278.3 was brought into the action on Friday. What’s interesting about this zone is that it’s glued to the underside of the above noted weekly green zone. So, the bears could very well make an appearance from here this week. Another important point worth mentioning is the possibility of further buying. Should this occur (as there’s room on the weekly to push slightly higher), the potential AB=CD daily bearish pattern (see black arrows) that terminates a tad beyond the Quasimodo resistance at 1307.8 (positioned within the upper limits of the weekly green zone) may complete.
Friday’s US non-farm payrolls report echoed a disappointed tone in the market, consequently sending the US dollar lower and the yellow metal higher. The move, as you can see, broke through May’s opening level at 1270.5, and has opened up the path north to the H4 supply registered at 1288.1-1284.2. This area has certainly caught our eye since it is located within the upper limits of the daily supply and also positioned within the lower limits of the green weekly zone. Therefore, we believe it will, at the very least, bounce price lower.
Our suggestions: We will, dependent on the time of day, look to short the above said H4 supply at market, with stops placed at 1288.9.
Levels to watch/live orders:
- Buys: Flat (stop loss: N/A).
- Sells: 1284.2 (stop loss: 1288.9).


