EUR/USD:
Weekly gain/loss: +0.28%
Weekly closing price: 1.2455
Over the course of last week’s movement, the single currency managed to record its seventh consecutive weekly gain!
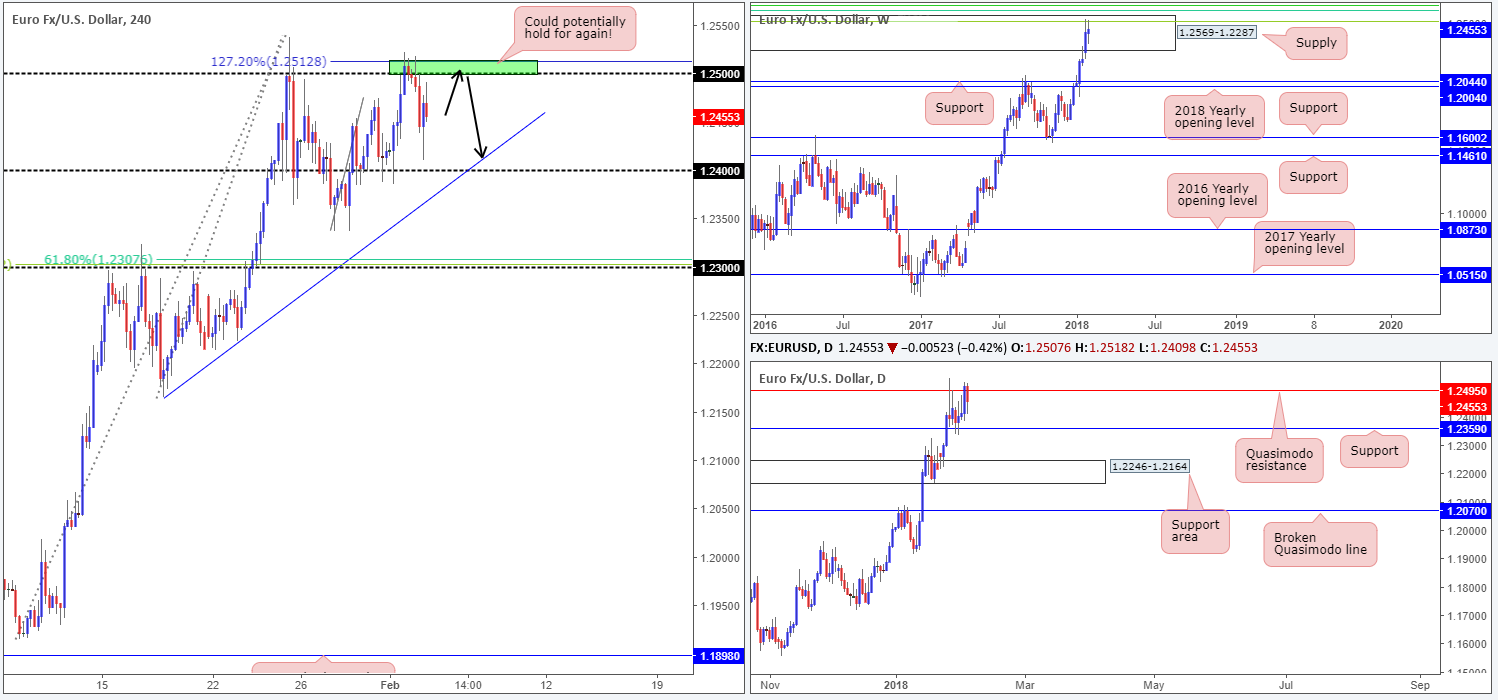
While this is an incredibly impressive run, weekly price (once again) concluded the week closing within the walls of a strong-looking weekly supply area at 1.2569-1.2287, along with monthly price on the US dollar index remaining above support at 88.50. Not only this, traders may have also noticed the weekly Fibonacci resistance cluster (green lines) seen circling around the top edge of the current weekly supply:
- 61.8% Fib resistance at 1.2604 taken from the high 1.3993.
- 50.0% Fib resistance at 1.2644 taken from the high 1.4940.
- 38.2% Fib resistance at 1.2519 taken from the high 1.6038.
The story on the daily timeframe shows that daily flow remains confined between a daily Quasimodo resistance level plotted at 1.2495 and a daily support at 1.2359 (note here that the daily Quasimodo is closely aligned with the weekly 38.2% Fib resistance at 1.2519). In the event that 1.2495 gives way this week, the next upside target can be seen at 1.2626: a daily resistance (not seen on the screen), whereas a break below 1.2359 has the daily support area at 1.2246-1.2164 to target.
On Friday, the US non-farm payrolls report showed that the economy added 200K new jobs in January, beating the 181K consensus. As a result of this, the greenback strengthened and the euro pressed lower from a H4 AB=CD 127.2% Fib ext. point at 1.2512/1.25 handle, reaching lows of 1.2409. Despite this, as you can see, the pair managed to pare intraday losses amid US afternoon trading, as the dollar surrendered a share of its post-NFP gains.
Potential trading zones:
With weekly supply (along with the weekly Fib zone) and the daily Quasimodo resistance level still in play, a downside move is a possibility this week.
According to our technicals, the H4 AB=CD 127.2% Fib ext. point at 1.2512/1.25 handle (green area) is still a valid sell zone. Waiting for additional candle confirmation (full or near-full-bodied H4 bear candle), however, might be an idea, simply because the area’s orders may be weak due to Friday’s reaction. The first take-profit target from this angle could be set at the H4 trendline support extended from the low 1.2165/1.24 handle.
Data points to consider: ECB President Draghi speaks at 4pm; US ISM non-manufacturing PMI at 3pm GMT.
Areas worthy of attention:
Supports: 1.24 handle; H4 trendline support; 1.2246-1.2164; 1.2359.
Resistances: 1.2569-1.2287; Weekly Fib cluster; 1.2495; 1.2626; 1.25 handle; 1.2512.
GBP/USD:
Weekly gain/loss: -0.40%
Weekly closing price: 1.4119
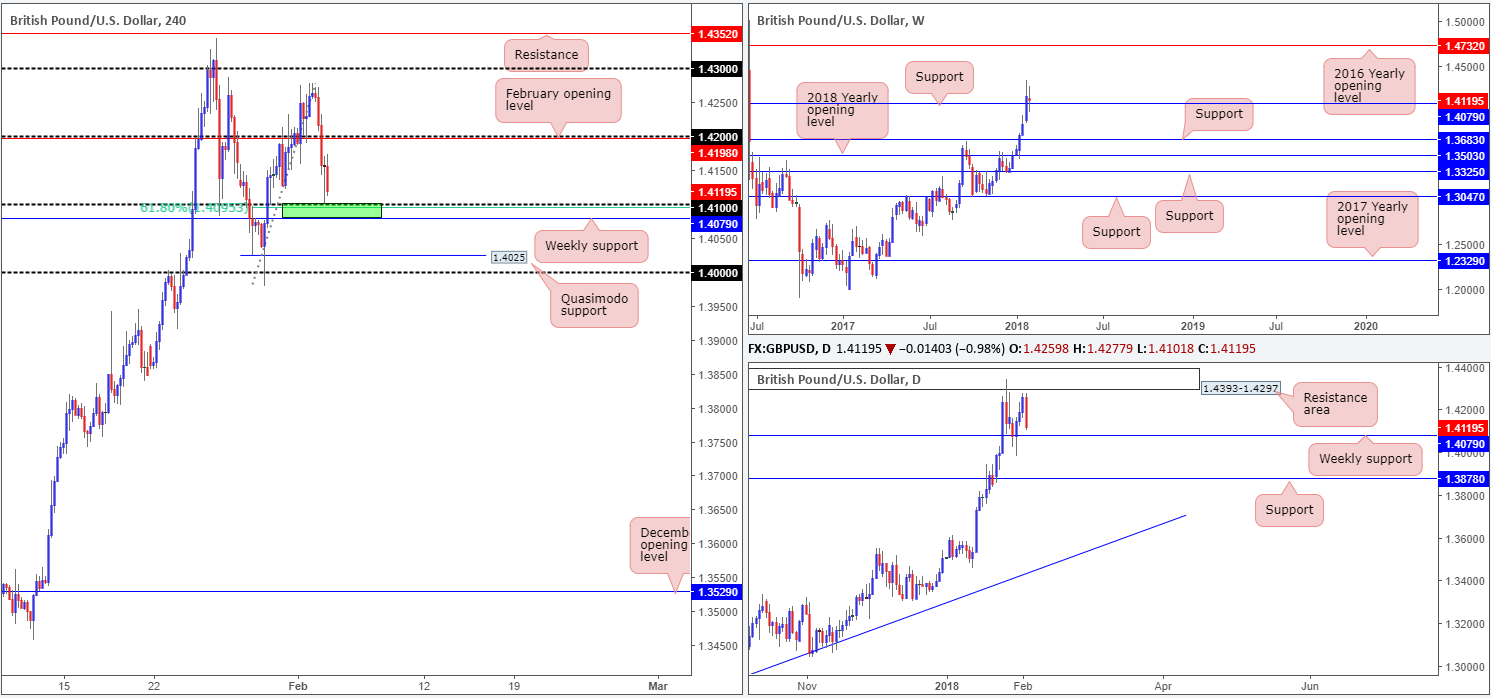
Following the break of weekly resistance at 1.4079 two weeks back, the British pound took on more of a subdued tone last week, consequently breaking a six-week bullish phase. As can be seen on the weekly timeframe, price formed a reasonably clear-cut indecision candle off the top of 1.4079, which is now acting support. Continued buying from this point could eventually see the unit approach the 2016 yearly opening level at 1.4732. A drop back to the downside, however, would likely bring weekly support at 1.3683 into the spotlight.
In order for the GBP to climb higher, a daily resistance area seen plotted at 1.4393-1.4297 would need to be engulfed. Beyond the current weekly support, the next key area of daily support rests at 1.3878.
Friday’s lower-than-expected UK construction PMI was largely ignored – the 1.42 handle seen on the H4 timeframe remained firm. Following an upbeat US job’s report, nevertheless, the US dollar strengthened and forced the GBP southbound, taking out 1.42 and bottoming a few pips ahead of the 1.41 handle. H4 price attempted a recovery from here, but failed to sustain upside, consequently ending the day printing a rather dominant H4 bearish candle.
Potential trading zones:
In spite of Friday’s leading move lower, selling is not an approach we’d stamp high probability since you’d effectively be shorting into weekly support and the 1.41 handle.
Given 1.41 is also bolstered by a H4 61.8% Fib support at 1.4095 and, as briefly highlighted above, positioned reasonably nearby the weekly support at 1.4079 (green zone), a rotation from this area back up to 1.42s could be in store.
Data points to consider: UK services PMI at 9.30am; US ISM non-manufacturing PMI at 3pm GMT.
Areas worthy of attention:
Supports: 1.4079; 1.41 handle; 1.4095; 1.3878; 1.3683.
Resistances: 1.4393-1.4297; 1.4732; 1.42 handle.
AUD/USD:
Weekly gain/loss: -2.29%
Weekly closing price: 0.7920
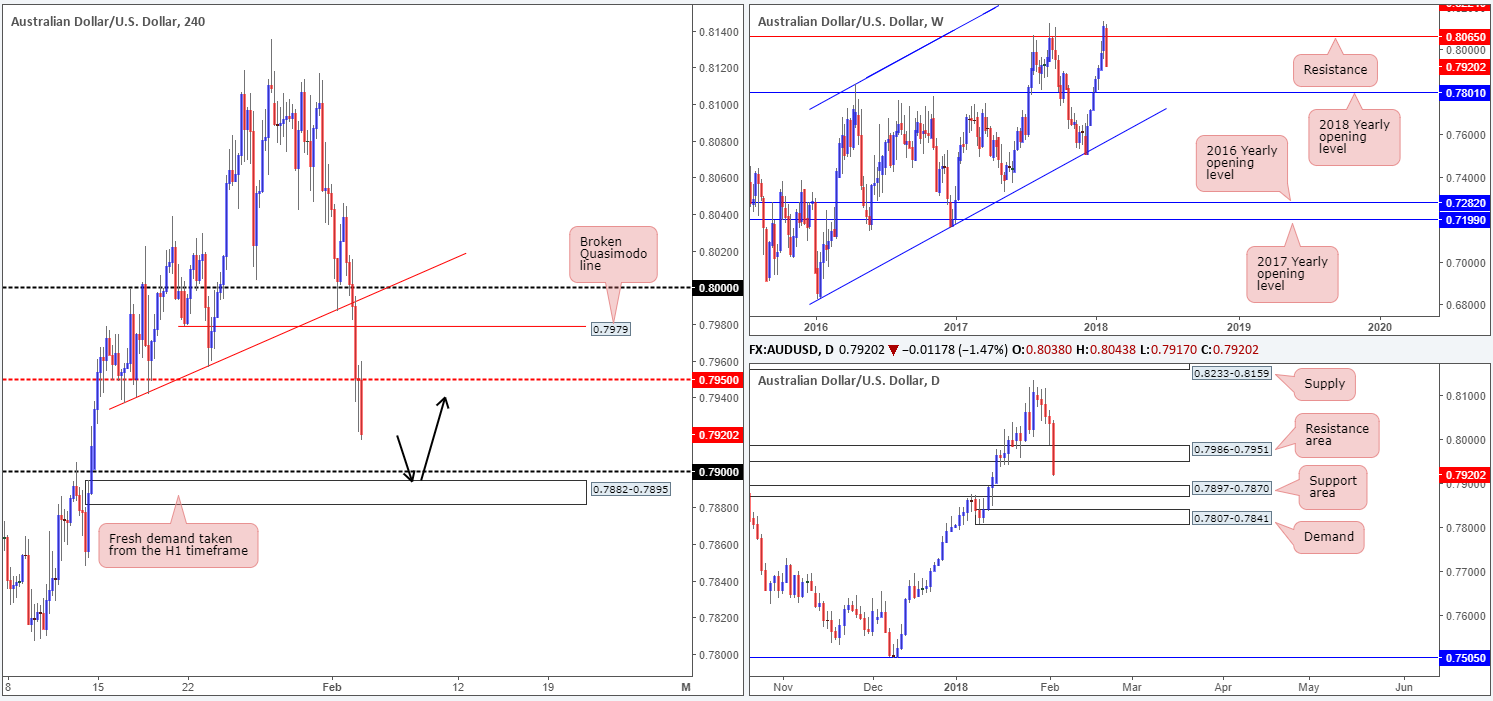
Engulfing approximately two weeks’ worth of gains last week, weekly price shaped a strong-looking full-bodied weekly bearish candle. The move, as you can see, has firmly placed the 2018 yearly opening level seen on the weekly timeframe at 0.7801 back in view.
Turning the focus to the daily timeframe, the daily support area at 0.7986-0.7951 (now acting resistance area) was taken out in strong fashion last week, opening the gates for price to challenge the daily support area coming in at 0.7897-0.7870, and quite possibly the daily demand at 0.7807-0.7841 (sited just ahead of the 2018 yearly opening line).
A quick recap of Friday’s movement on the H4 timeframe shows that the commodity-linked currency aggressively moved to the downside in response to stellar US job’s data. The H4 Quasimodo support at 0.7979 was obliterated, leaving the unit free to test lower prices. As highlighted on the chart, the next downside targets can be seen at the 0.79 handle, shadowed closely by a H1 demand base at 0.7882-0.7895.
Potential trading zones:
The noted H1 demand, in our technical view, is attractive. This is largely due to it being positioned directly beneath the 0.79 handle (stop-loss orders plotted beneath 0.79 will, when filled, become sell orders which provide liquidity for those looking to buy), and is also seen located within the walls of the daily support area at 0.7897-0.7870.
For those considering a long from this boundary, you may want to consider placing stops below the surrounding DAILY support area, rather than the H4 zone. This will help avoid a fakeout.
Ultimately, the first take-profit target should be kept reasonably close by (0.7950 looks like a possible candidate at current price) since let’s not forget that weekly price shows room to press lower!
Data points to consider: Chinese Caixin services PMI at 1.45am; US ISM non-manufacturing PMI at 3pm GMT.
Areas worthy of attention:
Supports: 0.79 handle; 0.7882-0.7895; 0.7897-0.7870; 0.7807-0.7841; 0.7801.
Resistances: 0.7950; 0.7986-0.7951; 0.8065.
USD/JPY:
Weekly gain/loss: +1.32%
Weekly closing price: 110.15
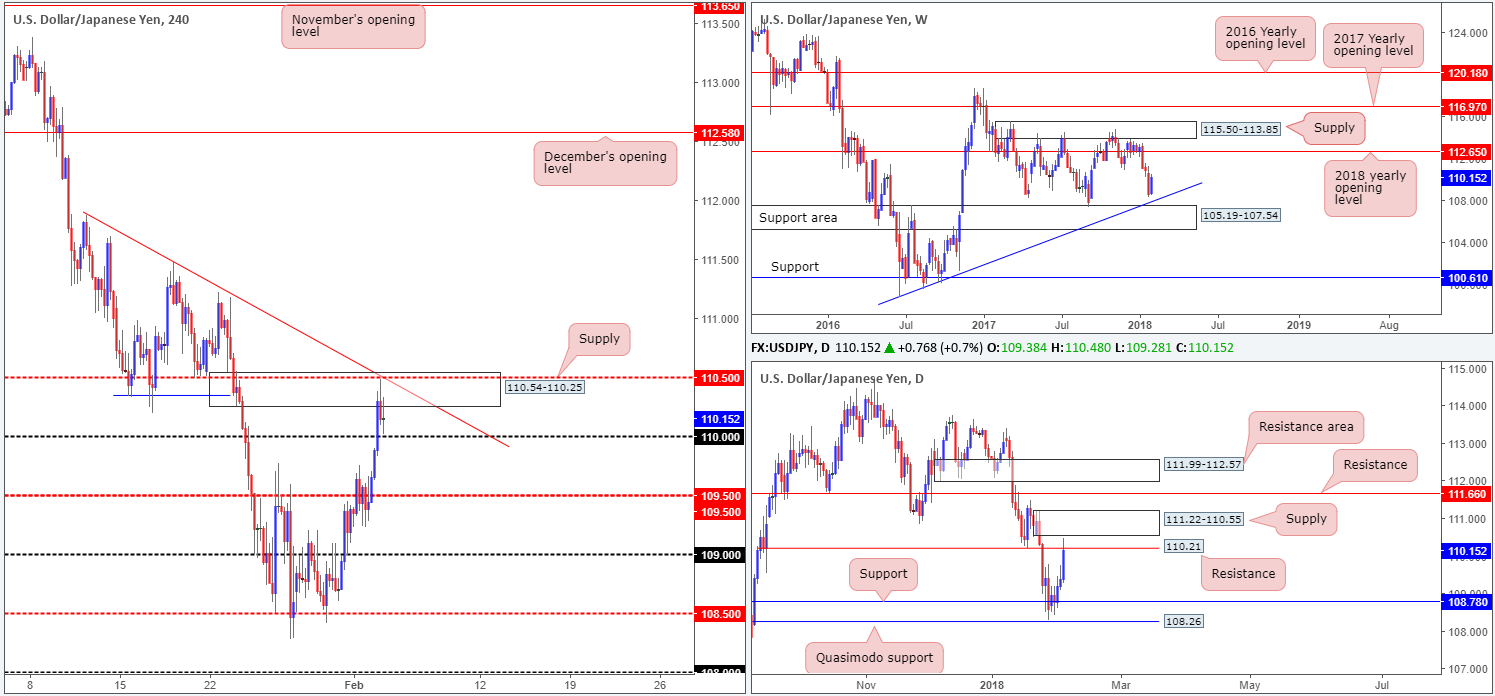
Over the course of last week’s segment, the USD/JPY recovered the majority of the prior week’s losses and formed a weekly bullish inside candle in the process. This candlestick formation, considered by many to be a bullish indicator, took shape just ahead of a weekly trendline support taken from the low 98.78, followed closely by a weekly support area at 105.19-107.54. Sustained buying from this point could attempt an approach back up to the 2018 yearly opening level at 112.65.
While upside on the weekly scale looks inviting, daily structure could potentially throw a spanner in the works here! Thanks to last week’s upside move, daily resistance at 110.21, followed closely by daily supply at 111.22-110.55, is now in the limelight. Even with these areas removed, we see nearby daily resistance at 111.66! As a result, the bulls certainly have their work cut out for them should they intend on pushing this market north.
A solid round of buying was seen in response to Friday’s buoyant US job’s data. H4 price ran through offers at the 110 handle, drove high into H4 supply at 110.54-110.25, and shook hands with the H4 mid-level resistance at 110.50/H4 trendline resistance taken from the high 111.87. As is evident from the chart, H4 sellers made an appearance but failed to pull prices back below the 110 handle, ending the day forming a H4 indecision candle.
Potential trading zones:
The current H4 supply and its converging structures (mentioned above) and the daily resistance at 110.21 serves as a bearish indication, in our view. With that being said, weekly price shows some promise to the upside, and H4 price has to contend with nearby support at 110. Therefore, in order to be a confident seller, one may want to consider waiting for H4 price to print a close beneath 110. A break back below here, followed up with a solid retest would, from where we’re sitting, be enough evidence to suggest lower prices down to at least 109.50/109.
Data points to consider: US ISM non-manufacturing PMI at 3pm GMT.
Areas worthy of attention:
Supports: 110 handle; 109.50; 109 handle; Weekly trendline support; 105.19-107.54.
Resistances: 110.50; 110.54-110.25; H4 trendline resistance; 110.21; 111.22-110.55; 111.66.
USD/CAD:
Weekly gain/loss: +0.95%
Weekly closing price: 1.2421
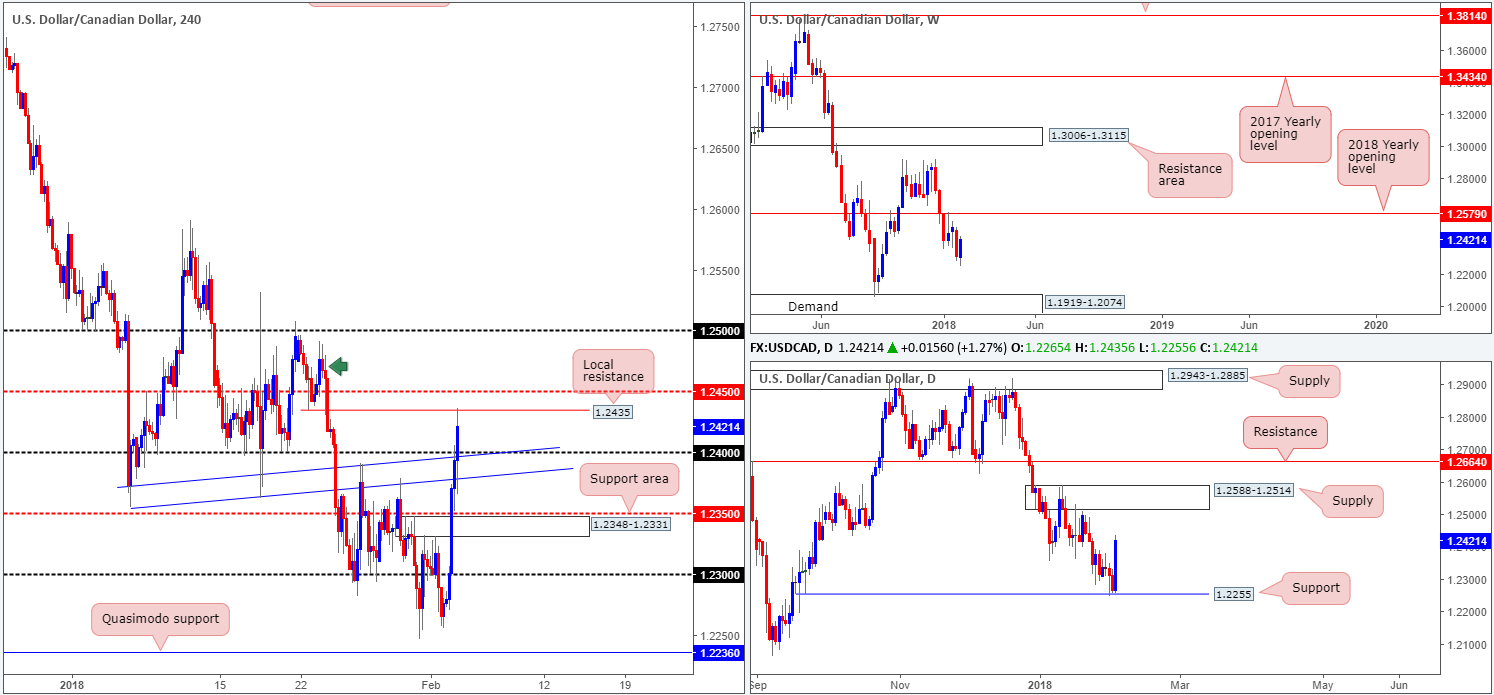
The USD/CAD, as you can see, switched tracks last week and reclaimed a portion of the prior week’s losses. This, from the weekly scale, could encourage further upside this week up to as far as the 2018 yearly opening level at 1.2579.
Inching down to the daily timeframe, we can see that daily bids formulated a support from 1.2255. Continued upside from this point will likely bring the pair back up to daily supply logged at 1.2588-1.2514, which happens to house the noted 2018 yearly opening level and is also located just beneath daily resistance at 1.2664.
The aftermath of Friday’s US job’s figures drove prices skyward. H4 action ripped through several tech resistances, including a H4 supply at 1.2348-1.2331 (now acting support area), and ended the day topping at a local H4 resistance penciled in at 1.2435. A continued pullback from this angle could see intraday price retest 1.24/H4 trendline support taken from the H4 close 1.2373.
Potential trading zones:
While we believe that further upside is probable in this market, taking advantage of it is proving troublesome on the H4 structure. Not only does one have the aforementioned local H4 resistance in view, there’s also the H4 mid-level resistance at 1.2450 to contend with and the H4 supply at 1.2491-1.2467 (marked with a green arrow).
On account of the current H4 resistances, opting to stand on the sidelines may be the better path to take for the time being.
Data points to consider: US ISM non-manufacturing PMI at 3pm GMT.
Areas worthy of attention:
Supports: 1.2348-1.2331; 1.24 handle; H4 trendline support; 1.2255.
Resistances: 1.2450; 1.2435; 1.2491-1.2467; 1.2588-1.2514; 1.2579.
USD/CHF:
Weekly gain/loss: -0.26%
Weekly closing price: 0.9308
The weekly candles are in free fall right now. Literally, they look as though they were just pushed off of a cliff!
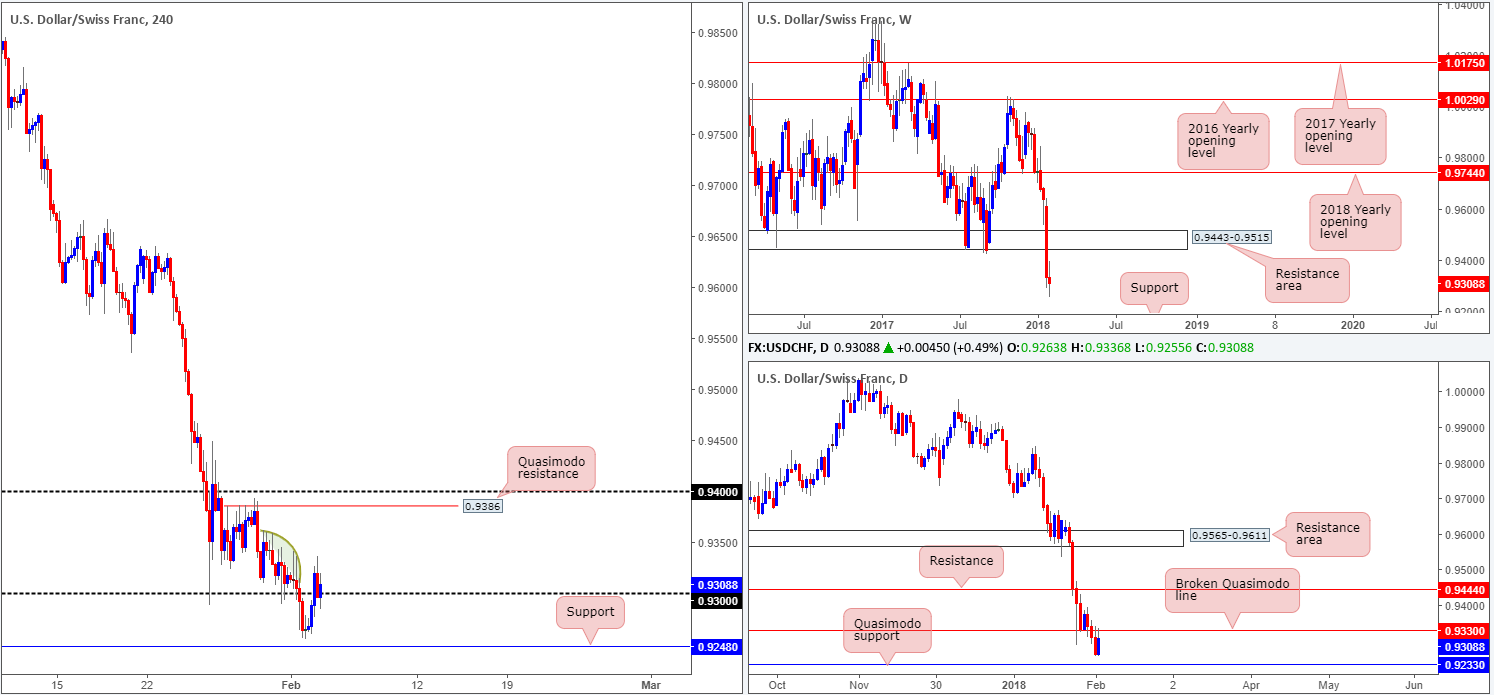
Registering its fourth consecutive weekly decline last week, the pair looks to be on course to continue driving south until we reach weekly support coming in at 0.9163 (not seen on the screen). Although this is an eye-opening decline, it is worth remembering that the US dollar index is seen trading from a monthly support at 88.50.
Leaving the daily Quasimodo support at 0.9233 unchallenged on Friday, the pair rotated back to the upside and retested a daily broken Quasimodo line at 0.9330. A topside breach of this level would likely bring about an extension up to daily resistance at 0.9444.
Friday’s optimistic US job’s numbers provided H4 buyers with enough fuel to cross back above the 0.93 handle. H4 sellers did attempt to pare recent gains and push lower following this move, but quickly found 0.93 was a defended barrier. To the left of current price, we have highlighted a collection of H4 selling wicks in green. This area, to us, resembles supply consumption (limited supply) and could signal a clear pathway north up to the H4 Quasimodo resistance at 0.9386, shadowed closely by the 0.94 handle.
Potential trading zones:
Since weekly and daily price continue to air bearish vibes, additional candle confirmation is required around the 0.93 handle on the H4 timeframe, before it is a level we deem valid. Basically, what we’re looking for is a few more H4 rejection candles to form, before we can confidently say a correctional move up to 0.94/0.9386 is likely on the cards.
Data points to consider: US ISM non-manufacturing PMI at 3pm GMT.
Areas worthy of attention:
Supports: 0.93 handle; 0.9233; 0.9163.
Resistances: 0.94 handle; 0.9386; 0.9330; 0.9444.
DOW 30:
Weekly gain/loss: -4.12%
Weekly closing price: 25520
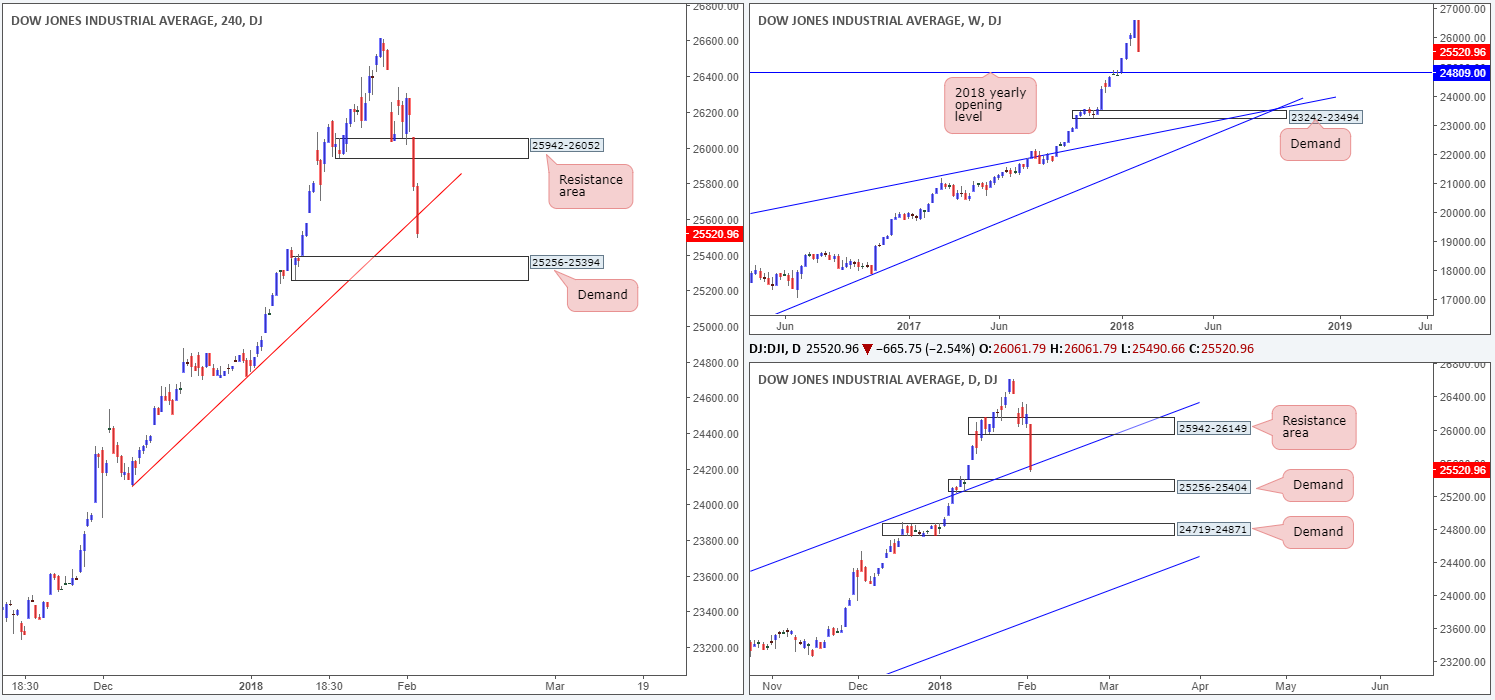
The Dow Jones Industrial Average came under pressure last week, printing its biggest loss in months. Erasing more than 1,000 points, weekly price now looks to be on course to reconnect with the 2018 yearly opening level at 24809. All of the Dow's thirty members closed in the red. The best performer was NIKE, losing only 0.50%, and the worst being Exxon Mobil, down 6.64%.
As can be seen on the daily timeframe, the index spent the majority of the week fluctuating within the boundaries of a daily demand base at 25942-26149. It wasn’t until Friday did we see the sellers crank it up a gear and drive lower, marginally closing beneath a daily channel support extended from the high 21169 (and a few points ahead of a daily demand at 25256-25404).
Zooming in for a closer look on the H4 timeframe, we can see that Friday’s descent concluded the day closing below a H4 trendline support taken from the low 24101. What the move also accomplished was potentially opening downside to H4 demand at 25256-25394 (positioned within the lower limits of the noted daily demand).
Potential trading zones:
The H4 demand mentioned above at 25256-25394, given its connection with daily demand at 25256-25404, is an area traders are likely watching for a bounce higher today. Due to the strength of Friday’s selloff, and the possibility of further selling on the weekly timeframe, nonetheless, you may want to contemplate waiting for additional candle confirmation to form, before pulling the trigger (a H4 full or near-full-bodied bull candle). This will help avoid any whipsaw that may take place.
Data points to consider: US ISM non-manufacturing PMI at 3pm GMT.
Areas worthy of attention:
Supports: 24809; daily channel support; 25256-25404; 25256-25394.
Resistances: 25942-26052; H4 trendline resistance; 25942-26149.
GOLD:
Weekly gain/loss: -1.25%
Weekly closing price: 1332.4
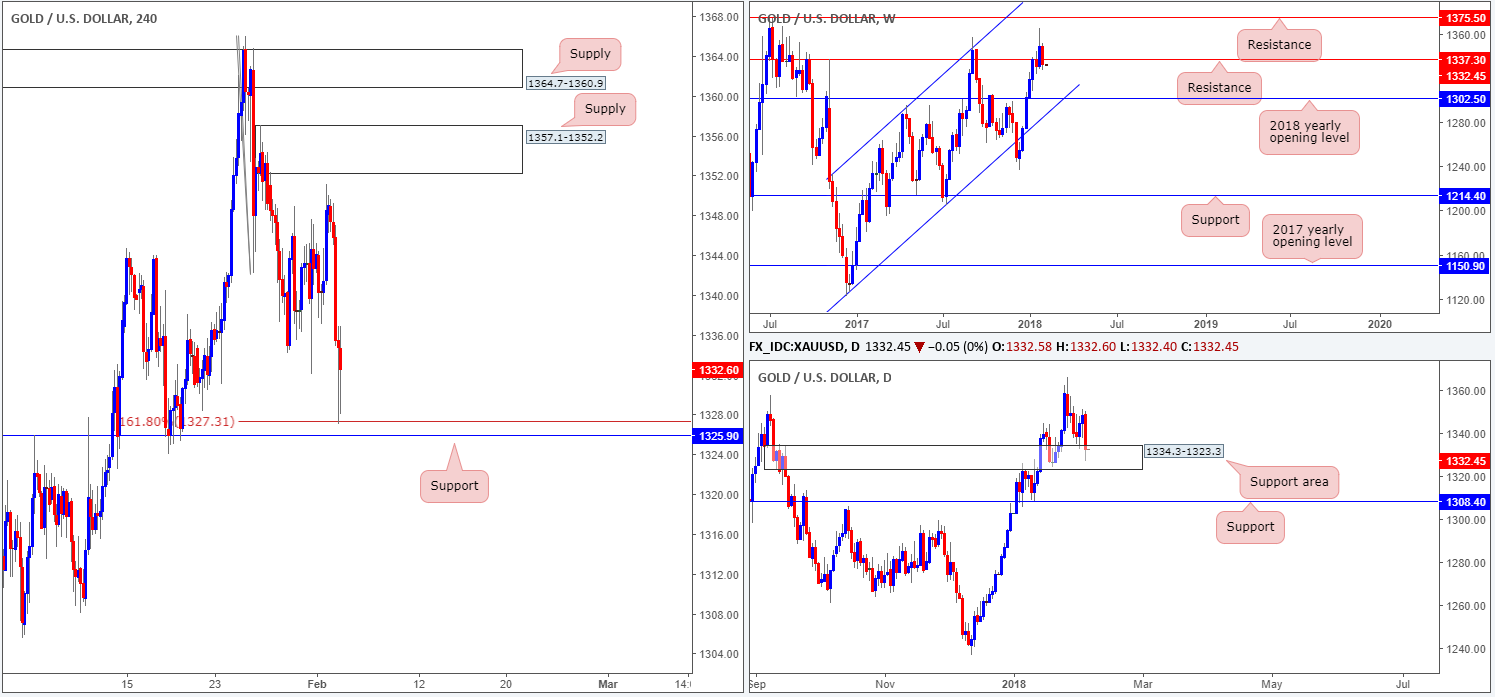
Despite weekly price managing to chalk up a rather convincing close above weekly resistance at 1337.3 two weeks back, the yellow metal failed to generate much follow-through movement and ended last week back below 1337.3.
Further downside from current price could eventually see the unit tackle the 2018 yearly opening level at 1302.5.
Although weekly bears appear to have the upper hand at this time, daily structure reveals a potential obstacle in the form of a daily support area coming in at 1334.3-1323.3. This zone has already proved itself once already back on Jan 18, where daily price penciled in an inverted pin-bar formation and rallied higher. In the event that this base fails to hold, the next port of call below here can be found at 1308.4: a daily support level.
Friday’s hotter-than-expected US employment numbers prompted a dollar-bid market, which, as you can see, translated to an offered gold price. Leaving the H4 supply area at 1357.1-1352.2 unchallenged, bullion eventually plunged lower and crossed swords with a H4 161.8% Fib ext. point at 1327.3, from where price mildly pared losses into the close.
Potential trading zones:
Although 1327.3 is backed by another layer of H4 support just below it at 1325.9, and the aforementioned daily support area, buying this market is chancy for two reasons we believe:
- Upward momentum on the weekly chart is clearly showing signs of topping after a series of weekly gains.
- The close back below the current weekly resistance exhibits bearish intention. Granted, the close may only be marginal, but the weekly candlestick itself is a near-full-bodied formation, meaning there is possibly some strength behind the move!
Selling, according to our technicals, should only be considered following a break of the aforementioned daily support area. However, you would have to pin down a rather tight entry since oncoming daily support, as mentioned above, is seen at 1308.4.
Areas worthy of attention:
Supports: 1327.3; 1325.9; 1334.3-1323.3; 1308.4; 1302.5.
Resistances: 1357.1-1352.2; 1337.3.
This site has been designed for informational and educational purposes only and does not constitute an offer to sell nor a solicitation of an offer to buy any products which may be referenced upon the site. The services and information provided through this site are for personal, non-commercial, educational use and display. IC Markets does not provide personal trading advice through this site and does not represent that the products or services discussed are suitable for any trader. Traders are advised not to rely on any information contained in the site in the process of making a fully informed decision.
This site may include market analysis. All ideas, opinions, and/or forecasts, expressed or implied herein, information, charts or examples contained in the lessons, are for informational and educational purposes only and should not be construed as a recommendation to invest, trade, and/or speculate in the markets. Any trades, and/or speculations made in light of the ideas, opinions, and/or forecasts, expressed or implied herein, are committed at your own risk, financial or otherwise.
The use of the site is agreement that the site is for informational and educational purposes only and does not constitute advice in any form in the furtherance of any trade or trading decisions.
The accuracy, completeness and timeliness of the information contained on this site cannot be guaranteed. IC Markets does not warranty, guarantee or make any representations, or assume any liability with regard to financial results based on the use of the information in the site.
News, views, opinions, recommendations and other information obtained from sources outside of www.icmarkets.com.au, used in this site are believed to be reliable, but we cannot guarantee their accuracy or completeness. All such information is subject to change at any time without notice. IC Markets assumes no responsibility for the content of any linked site. The fact that such links may exist does not indicate approval or endorsement of any material contained on any linked site.
IC Markets is not liable for any harm caused by the transmission, through accessing the services or information on this site, of a computer virus, or other computer code or programming device that might be used to access, delete, damage, disable, disrupt or otherwise impede in any manner, the operation of the site or of any user’s software, hardware, data or property.


