Waiting for lower timeframe confirmation is our main tool to confirm strength within higher timeframe zones, and has really been the key to our trading success. It takes a little time to understand the subtle nuances, however, as each trade is never the same, but once you master the rhythm so to speak, you will be saved from countless unnecessary losing trades. The following is a list of what we look for:
- A break/retest of supply or demand dependent on which way you’re trading.
- A trendline break/retest.
- Buying/selling tails/wicks – essentially we look for a cluster of very obvious spikes off of lower timeframe support and resistance levels within the higher timeframe zone.
We typically search for lower-timeframe confirmation between the M15 and H1 timeframes, since most of our higher-timeframe areas begin with the H4. Stops are usually placed 1-3 pips beyond confirming structures.
US dollar index (USDX):
EUR/USD:
Weekly gain/loss: – 58 pips
Weekly closing price: 1.1861
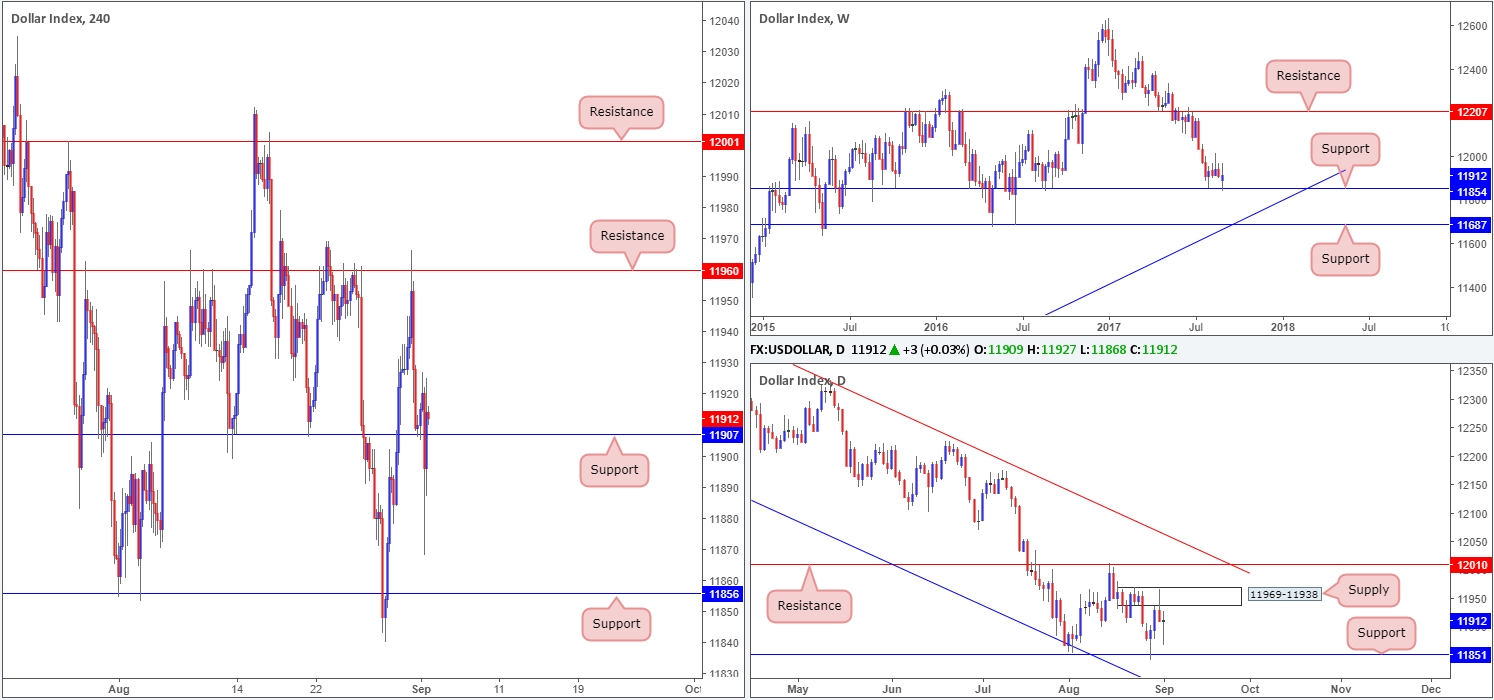
After seeing the EUR/USD shake hands with the weekly resistance level at 1.2044, a strong succession of sell orders reigned over this market last week. As a result of this, the week ended with price marginally closing beyond weekly support pegged at 1.1871. Inversely, we also saw the USDX weekly support at 11854 hold firm and print a weekly indecision candle going into the close. Although a close has been seen below support on the EUR, it may be worth waiting for the piece to print a somewhat deeper move beyond this line before presuming that all bids are consumed here.
Down on the daily timeframe, we can see that demand at 1.1739-1.1823 came into play on Thursday (USDX daily supply also came into view on Thursday at 11969-11938). A violation of this area could send the unit down to a demand positioned at 1.1612-1.1684, which happens to fuse nicely with a trendline support fixed from the low 1.0839.
On Friday, the H4 candles moved aggressively higher in the immediate aftermath of a soft US job’s report. However, despite this, the pair was unable to sustain gains beyond resistance at 1.1962, and ended the day closing back below the 1.19 handle.
Suggestions: Apart from breaching the 1.19 handle, H4 price also opened up the trapdoor for the major to challenge August’s opening level seen nearby at 1.1830, followed closely by the 1.18 boundary. Technically speaking though, our desk has absolutely no interest in these levels, as lurking just below is a H4 Harmonic Gartley reversal zone (PRZ) marked in green at 1.1725/1.1752. Not only does this area boast a H4 mid-level support at 1.1750 and a 161.8% H4 Fib ext. point at 1.1725 (taken from the high1.2070), it is also located around the lower limits of the daily demand mentioned above at 1.1739-1.1823.
As far as we see things, there are two options here:
- Place a pending order at 1.1750 and position the stop below the X point of the Harmonic formation at 1.1660.
- Wait for H4 price to connect with the PRZ and let the H4 candles prove buyer intent. Personally, we look for at least a full, or near-full-bodied bullish to materialize before pulling the trigger. Should this come to fruition, stops can either be placed beyond the candle’s tail (aggressive), or a few pips outside of the PRZ.
Data points to consider: No high-impacting news events on the docket today (US banks are closed in observance of Labor Day).

Levels to watch/live orders:
- Buys: 1.1725/1.1752 ([waiting for a reasonably sized H4 bullish candle to form – preferably a full, or near-full-bodied candle – is advised] stop loss: ideally beyond the candle’s tail).
- Sells: Flat (stop loss: N/A).
GBP/USD:
Weekly gain/loss: + 74 pips
Weekly closing price: 1.2950
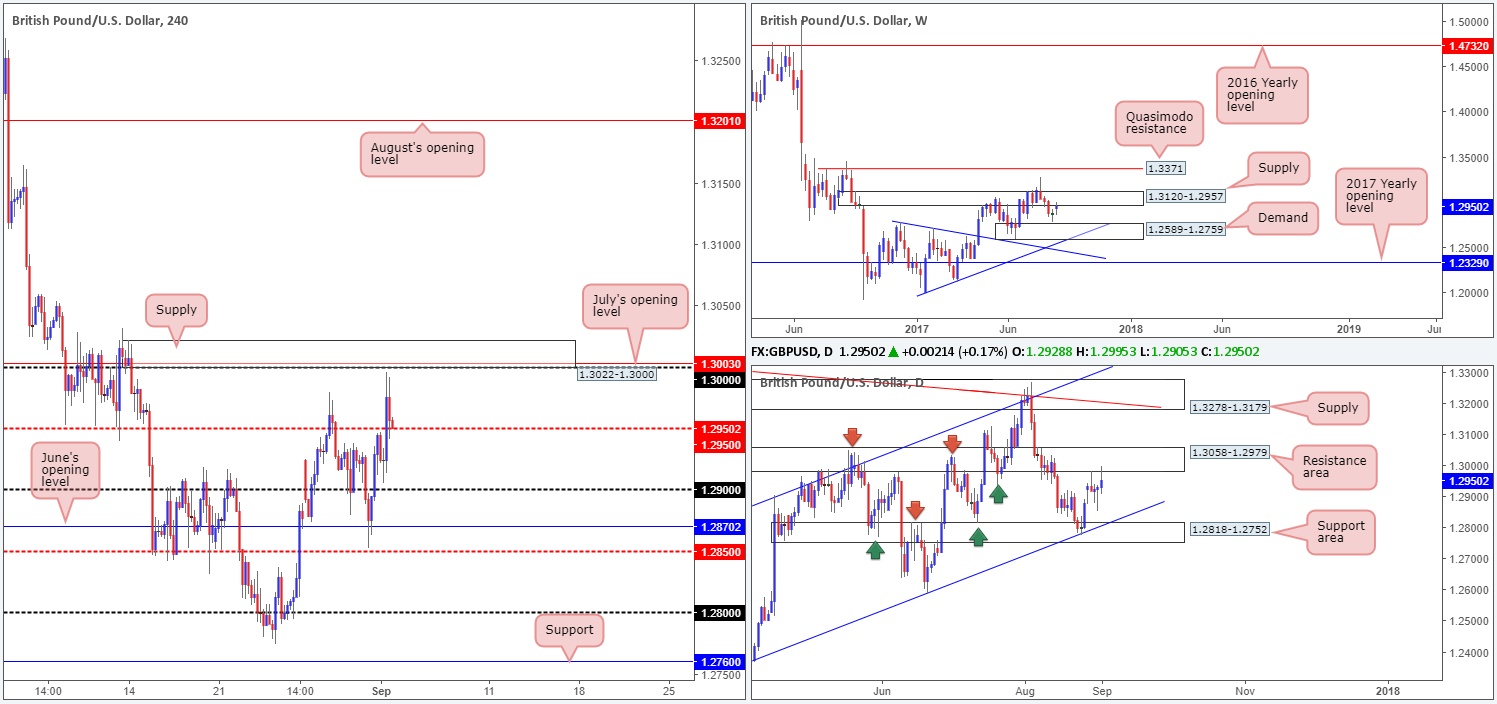
From the weekly timeframe, we can see that the British pound retained a minor bid tone last week despite trading around the underside of a supply base coming in at 1.3120-1.2957. Should the USDX weekly support at 11854 continue to bid prices higher this week, this could bolster weekly sellers from the current supply zone, and eventually send the unit back down to demand penciled in at 1.2589-1.2759.
In conjunction with the weekly timeframe, daily price recently connected with a resistance area at 1.3058-1.2979 which has, so far, done a superb job in holding back the bulls. Given its strong history dating back to mid-May, we feel this zone will continue to hold and ultimately push cable down to the support area seen below at 1.2818-1.2752 that converges with a channel support line taken from the low 1.2365.
Friday’s lower-than-expected US job’s print helped lift H4 price above the mid-level resistance barrier at 1.2950. As can be seen from the chart, the piece missed the large psychological boundary 1.30 by a hair, before mildly trimming gains into the closing bell.
Despite price not connecting with 1.30 on Friday, this number is still of interest. Not only because it is a large psychological level that the majority of the market is likely watching and is positioned within both of the said higher-timeframe resistances, but also due to it converging with a H4 supply at 1.3022-1.3000 and July’s opening level at 1.3003.
Suggestions: Watch for H4 price to challenge the noted H4 supply. In the event that the market prints a reasonably sized full, or near-full-bodied H4 bearish candle from this region, a sell from here is valid, in our opinion, with a target objective set at 1.2950 as an initial take-profit level.
Data points to consider: UK construction PMI at 9.30am GMT+1. US banks are closed in observance of Labor Day.
Levels to watch/live orders:
- Buys: Flat (stop loss: N/A).
- Sells: 1.3022-1.3000 ([waiting for a reasonably sized H4 bearish candle to form – preferably a full, or near-full-bodied candle – is advised] stop loss: ideally beyond the candle’s wick).
AUD/USD:
Weekly gain/loss: + 35 pips
Weekly closing price: 0.7963
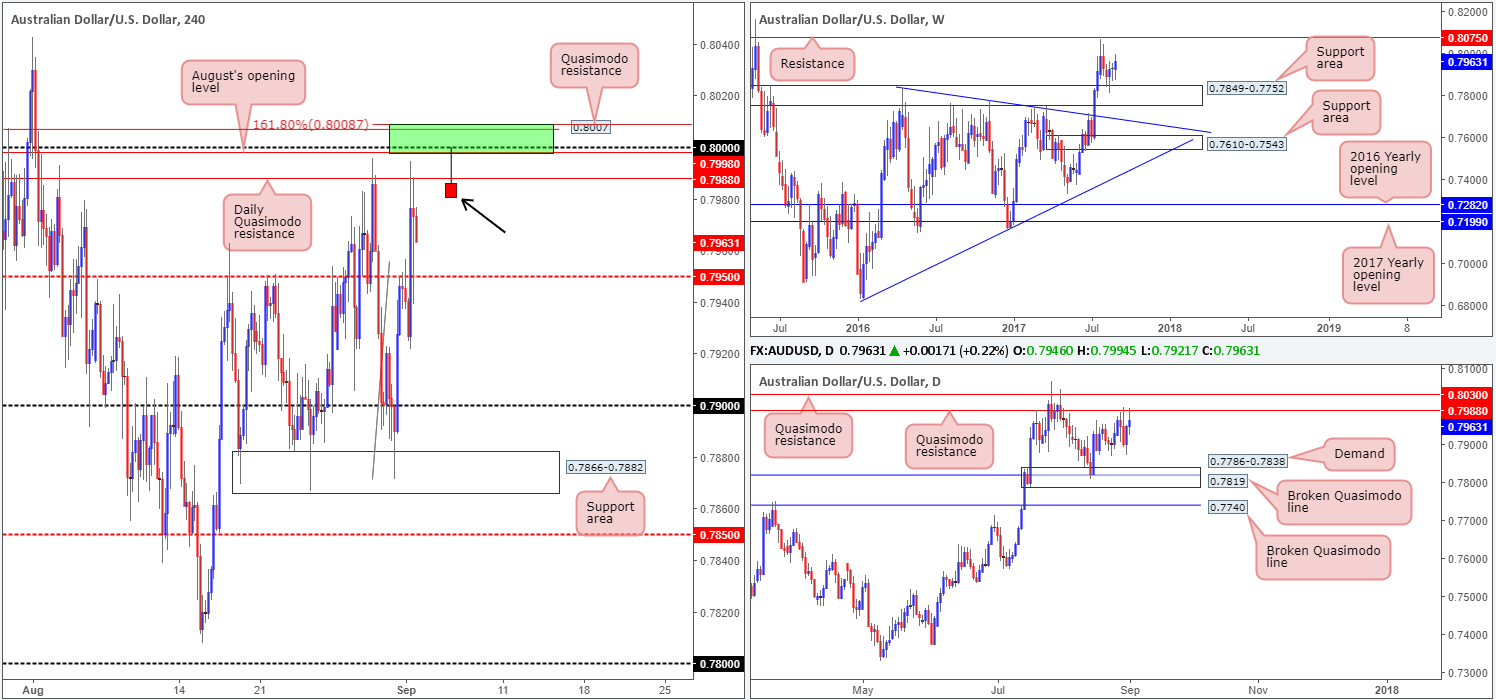
Since weekly price linked with the support area at 0.7849-0.7752 three weeks ago, the commodity currency has remained reasonably well-bid. The next objective, assuming that price continues to push north, can be seen around resistance drawn from 0.8075. Before weekly action can reach the noted resistance, however, it may be worth noting that daily price must first consume both Quasimodo resistances seen at 0.7980/0.8030.
A disappointing US job’s report on Friday saw H4 candle action run through the mid-level resistance at 0.7950 and touch gloves with the daily Quasimodo resistance mentioned above at 0.7980. Although this daily line could potentially drag the pair lower today, we really like the look of the large psychological level planted just above it at 0.80, due to the following nearby converging structures:
- August’s opening level at 0.7998.
- A H4 Quasimodo resistance level at 0.8007.
- A H4 161.8% Fib ext. point at 0.8008.
Suggestions: A short from the green H4 sell zone is, in our technical opinion, appealing, given its confluence. To trade this area though, we would ideally want to see H4 price whipsaw through the current daily Quasimodo resistance and test the zone in the shape of a pin bar, and ultimately close on/near its low (as drawn on the H4 chart). The reason we require this candle confirmation is due to both the risk of a fakeout being seen up to the daily Quasimodo resistance at 0.8030, and weekly price currently showing room to extend up to weekly resistance at 0.8075.
Data points to consider: No high-impacting news events on the docket today (US banks are closed in observance of Labor Day).
Levels to watch/live orders:
- Buys: Flat (stop loss: N/A).
- Sells: 0.8008/0.7998 ([ideally we want to see price whipsaw through the current daily Quasimodo resistance and test the zone in the shape of a H4 pin bar] stop loss: either beyond the candle’s wick or above 0.8008).
USD/JPY:
Weekly gain/loss: + 90 pips
Weekly closing price: 110.22
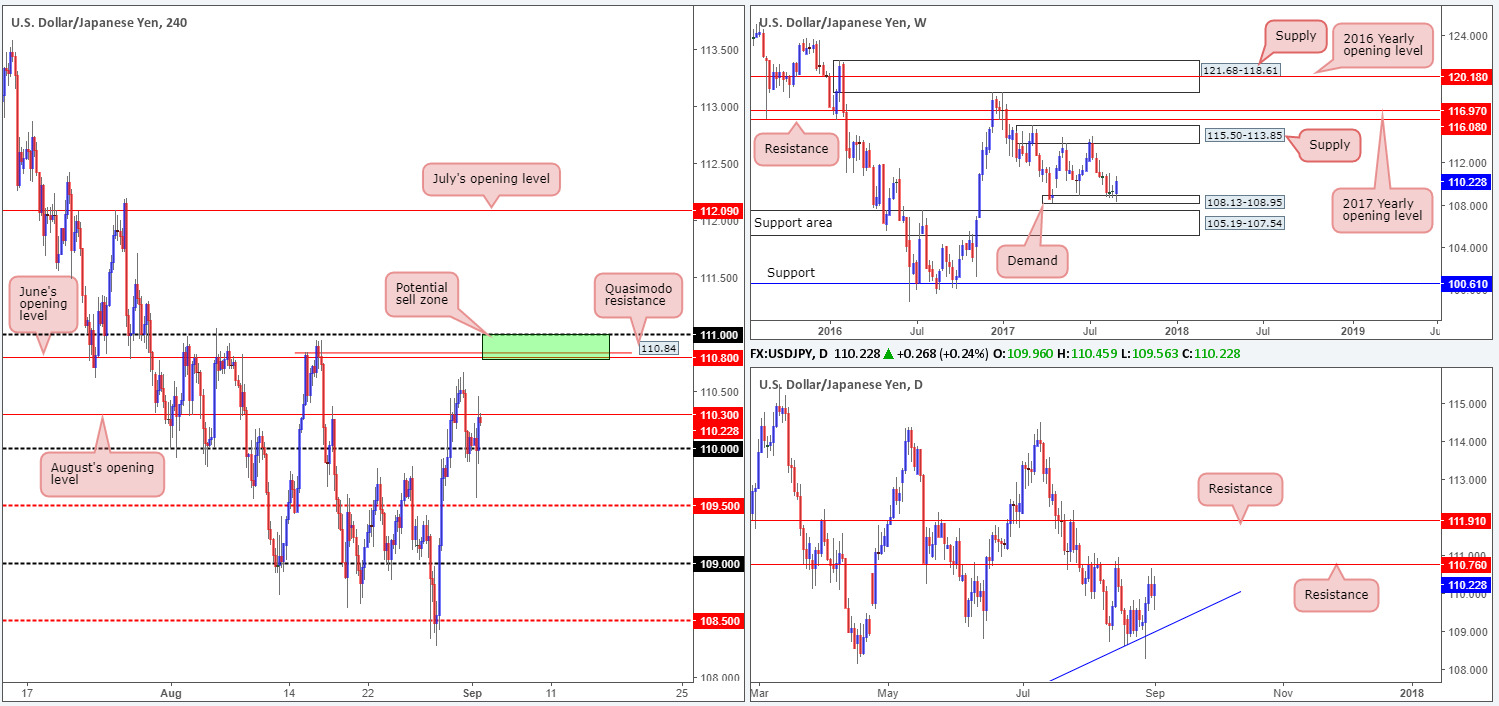
During the course of last week’s trading, USD/JPY bulls went on the offensive from weekly demand at 108.13-108.95 and printed a strong-looking weekly bullish engulfing candle. The move from this area could encourage further buying this week and propel the unit up to within striking distance of a supply area formed at 115.50-113.85.
Last week’s upside move, nevertheless, has placed the daily candles within shouting distance of a resistance level pegged at 110.76. Capping upside twice during the month of August, and boasting reasonably strong history, we feel price will, at the very least, bounce lower from here. Should a push above the line be seen, however, this would likely expose another resistance marked at 111.91.
A quick recap of Friday’s session on the H4 timeframe shows price spiked through the 110 handle following lower-than-expected US job’s figures, reaching a low of 109.56, before rejoining the 110 level. Following this, the pair received a minor boost on robust US manufacturing PMI data, consequently bringing price up to August’s opening level at 110.30 into the close.
Suggestions: At current price, we see very little to hang our hat on as far as technical setups go. A little higher up on the curve, nevertheless, June’s opening level at 110.80 shows promise owing to it converging closely with a H4 Quasimodo resistance level at 110.84, the 111 handle and the daily resistance noted above at 110.76 (green area – 111/110.80).
Unfortunately, trading short from this area would entail selling into potential weekly buyers from demand mentioned above at 108.13-108.95. With that being the case, additional confirmation in the form of a reasonably sized H4 bearish candle (preferably a full, or near-full-bodied bearish candle) would be required to show seller interest, before pulling the trigger.
Data points to consider: No high-impacting news events on the docket today (US banks are closed in observance of Labor Day).
Levels to watch/live orders:
- Buys: Flat (stop loss: N/A).
- Sells: 111/110.80 ([waiting for a reasonably sized H4 bearish candle to form – preferably a full, or near-full-bodied candle – is advised] stop loss: ideally beyond the candle’s wick).
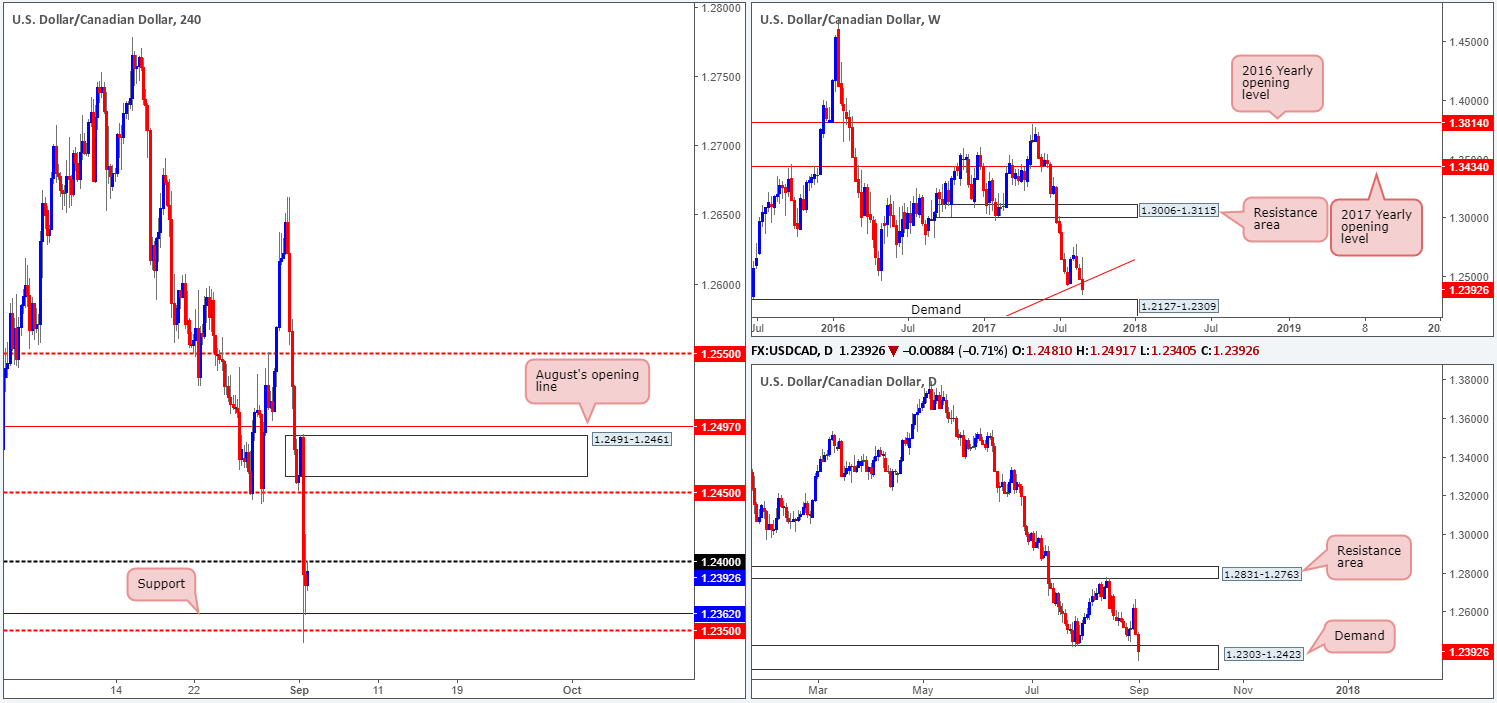
USD/CAD:
Weekly gain/loss: – 88 pips
Weekly closing price: 1.2392
The USD/CAD managed to retain its offered tone last week, after weekly price hammered its way through a long-term weekly trendline support extended from the low 0.9633. Technically speaking, this has likely set the stage for further selling this week at least until we reach weekly demand penciled in at 1.2127-1.2309.
The story on the daily timeframe reveals that the bears did not make a stand until Thursday’s segment, after topping around the 1.2662 neighborhood. The drop from here, shaped by two reasonably decisive bearish candles, brought the unit into the jaws of a demand base drawn from as far back as June 2015 at 1.2303-1.2423.
The result of Friday’s disappointing US job’s report saw price aggressively extend below both the H4 mid-level support at 1.2450 and1.24 handle. It was only once the piece connected with H4 support at 1.2362/H4 mid-level support at 1.2350 did we see price begin mildly paring losses.
Suggestions: To our way of seeing things right now, a H4 close above 1.24 would confirm upside to 1.2450/H4 supply at 1.2491-1.2461. In addition, this move would likely confirm strength from the current daily demand area. On the flip side, a rejection at 1.24 could lead to price retesting 1.2350, and quite possibly the 1.23 boundary (1.23 [not seen on the screen] is positioned just beneath daily demand, and also denotes the top edge of the weekly demand).
Preferably, we would love to be sellers in this market given the pair’s underlying trend. However, selling into daily demand and H4 support is just too risky for our liking. In regard to longs, we would not feel comfortable buying this market above 1.24 due to weekly price showing room to drive lower. To that end, the only place of interest is the 1.23 handle due to its location on the higher timeframes. For us, we would look to place stops below the H4 low @ 1.2276 formed on the 24th June 2015, and target 1.2350 as an initial take-profit level.
Data points to consider: No high-impacting news events on the docket today (US and Canadian banks are closed in observance of Labor Day).
Levels to watch/live orders:
- Buys: 1.23 region (stop loss: 1.2274).
- Sells: Flat (stop loss: N/A).
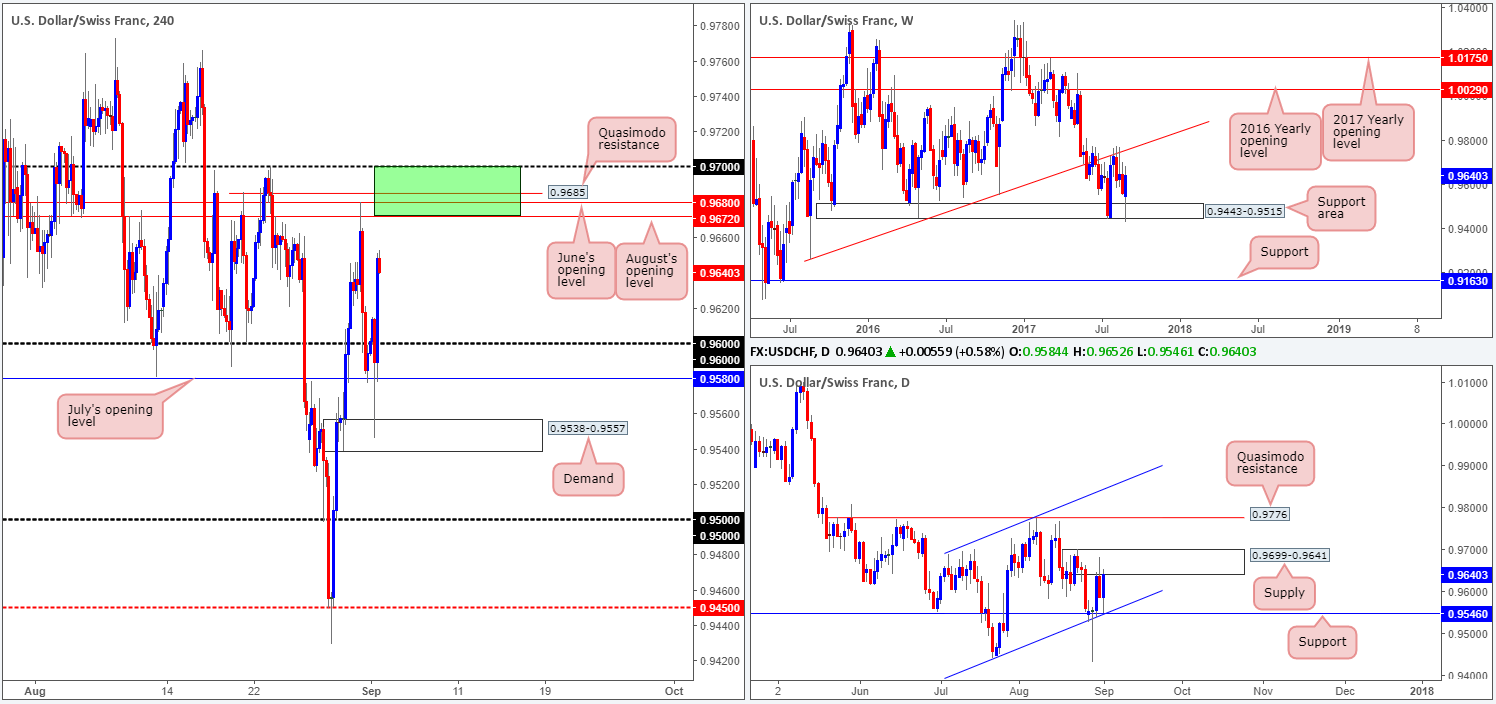
USD/CHF:
Weekly gain/loss: + 81 pips
Weekly closing price: 0.9640
Weekly price turned higher last week after crossing swords with a support area at 0.9443-0.9515, consequently clawing back the majority of the prior week’s losses. Seeing as the USDX also bounced from weekly support at 11854, dollar buying on the Swissy could lead to price retesting the trendline resistance extended from the low 0.9257.
Daily price on the other hand is somewhat restricted at the moment. To the upside, we have supply lodged at 0.9699-0.9641 (daily supply also seen on the USDX at 11969-11938) that held price lower on Thursday. And to the downside, there’s nearby support marked at 0.9546, which converges nicely with a channel support line etched from the low 0.9438.
The impact of Friday’s less-than-stellar US job’s report sent H4 price storming through July’s opening level at 0.9580 to a demand printed at 0.9538-0.9557. Despite the dismal numbers, the pair easily clawed back immediate losses and rose above the 0.96 handle to a high of 0.9652 on the day.
Suggestions: As of current price, we are particularly fond of the green area marked on the H4 chart at 0.97/0.9672. Comprised of June/August’s opening levels at 0.9680/0.9672, a H4 Quasimodo resistance level at 0.9685, a psychological boundary at 0.97 and being positioned within the upper limits of the current daily supply, a bounce lower from here is likely on the cards. The only grumble we have, however, is knowing that weekly price can potentially stretch as far north as the aforementioned trendline resistance! For that reason, we would only recommend executing a sell position between 0.97/0.9672 if H4 candle confirmation is present (preferably in the shape of a full, or near-full-bodied bearish candle).
Data points to consider: No high-impacting news events on the docket today (US banks are closed in observance of Labor Day).
Levels to watch/live orders:
- Buys: Flat (stop loss: N/A).
- Sells: 0.97/0.9672 ([waiting for a reasonably sized H4 bearish candle to form – preferably a full, or near-full-bodied candle – is advised] stop loss: ideally beyond the candle’s wick).
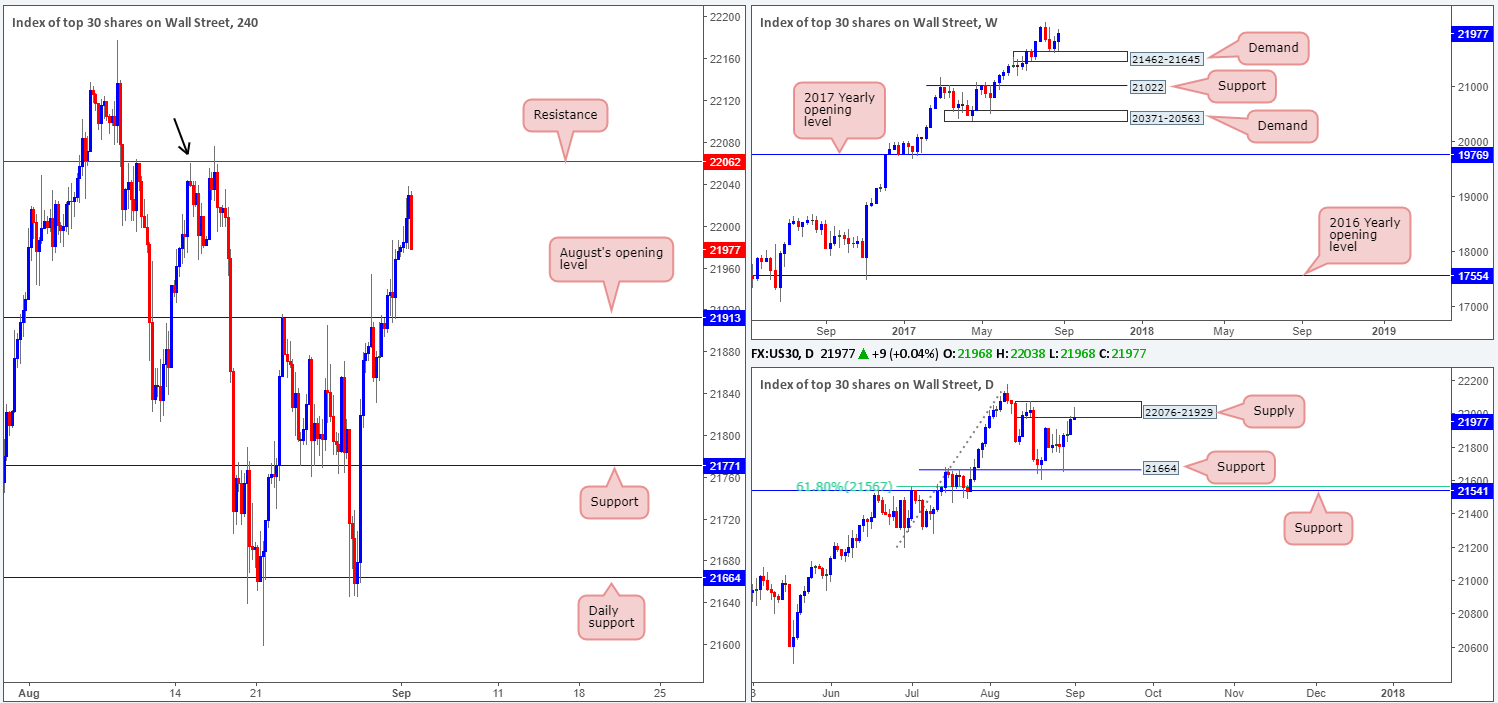
DOW 30:
Weekly gain/loss: + 159 points
Weekly closing price: 21977
Recent dealings show US equities extended its bounce from weekly demand at 21462-21645 last week, finishing near its highs. With little overhead resistance to contend with on the weekly timeframe, a fresh record high could be achieved this week!
On the other side of the field, nevertheless, daily flow recently crossed paths with supply at 22076-21929, and chalked up a nice-looking selling wick into the week’s end. While this supply boasts strong momentum and could send the index lower this week, let’s not forget where weekly price is trading from!
After retesting August’s opening level at 21913 as support on Thursday, the H4 candles extended north on Friday, and managed to clock a high of 22038 before trimming gains into the closing bell. Sited within the upper limits of the aforesaid daily supply, the next area to the upside is a H4 resistance level at 22062 (also denotes a Quasimodo resistance left shoulder marked by the black arrow).
Our suggestions: A difference of opinion is currently being seen on the higher timeframes. On the one hand, the weekly chart shows price is ready for higher levels, and on the other hand, daily movement is capped by a supply. This leaves traders in a somewhat precarious position on the H4 timeframe. A long at 21913 is high-probability according to the weekly scale, but ill-advised from a daily perspective. In a similar fashion, going short from the H4 resistance at 22062 would have you selling into potential weekly buyers, but alongside possible daily flow!
Given the above factors, our team will remain on the sidelines for the time being.
Data points to consider: No high-impacting news events on the docket today (US banks are closed in observance of Labor Day).
Levels to watch/live orders:
- Buys: Flat (stop loss: N/A).
- Sells: Flat (stop loss: N/A).
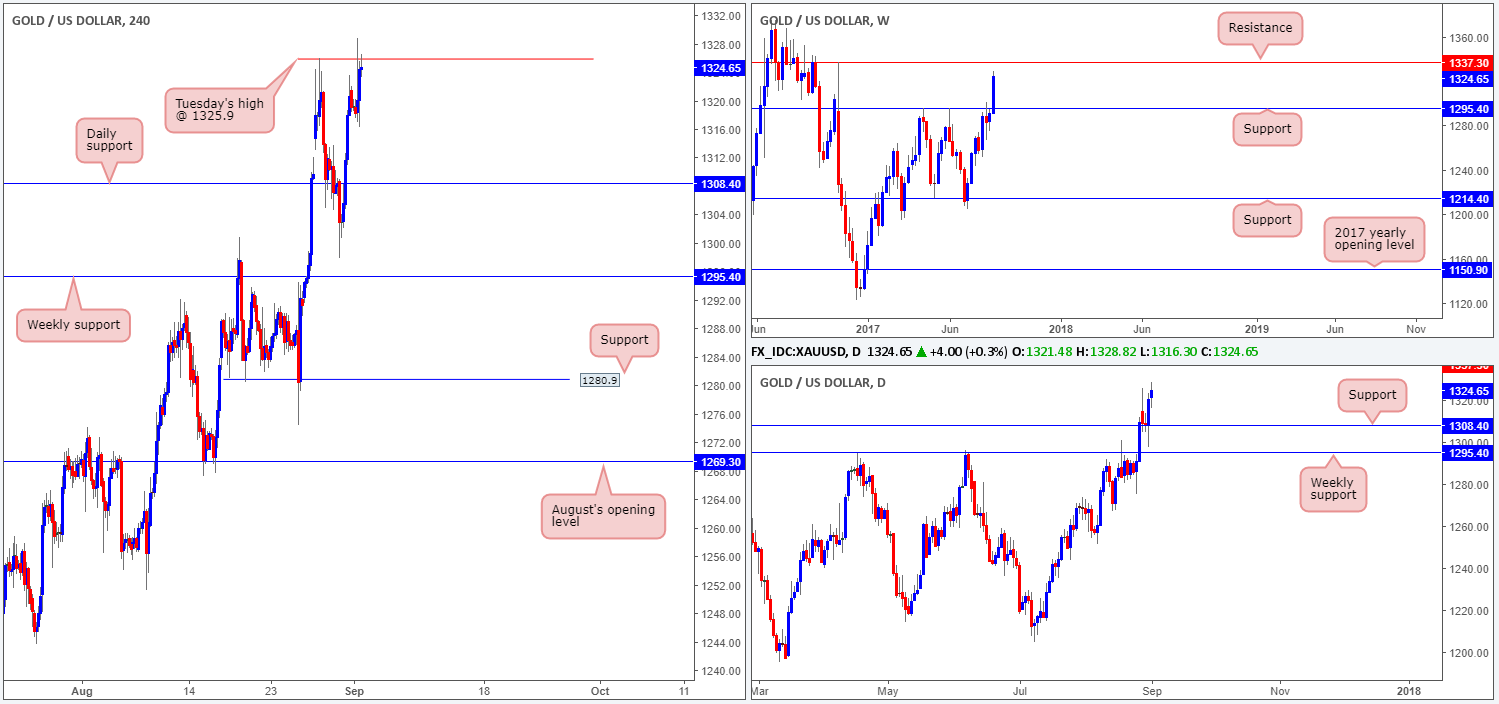
GOLD:
Weekly gain/loss: + $33.4
Weekly closing price: 1324.6
In recent trading, the yellow metal stormed above weekly resistance at 1295.4 and concluded trade closing just ahead of weekly resistance at 1337.3 that stretches all the way back to late 2010!
A quick recap of Friday’s movement on the H4 timeframe shows price challenged Tuesday’s high at 1325.9, but failed to muster enough strength to close beyond the number. As we highlighted in Friday’s report, this is, we believe, the last major obstacle stopping price from gravitating north up to the said weekly resistance.
Our suggestions: A H4 close above Tuesday’s high, followed up with a retest and a H4 bullish candle in the shape of either a full, or near-full-bodied bullish candle would, in our view, be enough to validate a long, targeting the weekly resistance mentioned above at 1337.3.
Levels to watch/live orders:
- Buys: Watch for H4 price to engulf 1325.9 and then look to trade any retest seen thereafter ([waiting for a reasonably sized H4 bull candle to form following the retest is advised] stop loss: ideally beyond the candle’s tail).
- Sells: Flat (stop loss: N/A).