A note on lower timeframe confirming price action…
Waiting for lower timeframe confirmation is our main tool to confirm strength within higher timeframe zones, and has really been the key to our trading success. It takes a little time to understand the subtle nuances, however, as each trade is never the same, but once you master the rhythm so to speak, you will be saved from countless unnecessary losing trades. The following is a list of what we look for:
- A break/retest of supply or demand dependent on which way you’re trading.
- A trendline break/retest.
- Buying/selling tails/wicks – essentially we look for a cluster of very obvious spikes off of lower timeframe support and resistance levels within the higher timeframe zone.
- Candlestick patterns. We tend to stick with pin bars and engulfing bars as these have proven to be the most effective.
We search for lower timeframe confirmation between the M15 and H1 timeframes, since most of our higher-timeframe areas begin with the H4. Stops are usually placed 5-10 pips beyond confirming structures.
EUR/USD:
Weekly gain/loss: + 99 pips
Weekly closing price: 1.0981
Weekly view: Leaving the support at 1.0819 unchallenged, the shared currency bottomed out around the 1.0850 neighborhood last week and closed the session above resistance coming in at 1.0970. Seeing as how the close above this barrier was marginal, we remain unsure as to whether this is a genuine signal to trade higher this week.
Daily view: Despite the weekly candle closing above a resistance, the daily chart depicts a slightly different picture. Given the closing price, supply at 1.1039-1.0998 is now seen within touching distance. Our desk would need to see this zone taken out before we’d consider the close above the aforementioned weekly resistance to be valid, which would likely stimulate further upside toward daily resistance drawn from 1.1135.
H4 view: A quick recap of Friday’s trade on the H4 shows that the bulls aggressively pushed higher, clocking highs of 1.0991 going into the close. According to Bloomberg, the Federal Bureau of Investigation reopened a probe into Hillary Clinton’s use of an unauthorized e-mail server, which, as far as we can see, was the primary reason for the rally north.
Direction for the week: Until the pair can print a decisive close beyond the current daily supply mentioned above at 1.1039-1.0998, higher prices are unlikely.
Direction for today: With the unit closing the week within shouting distance of the key figure 1.10, the bulls may have their work cut out for them if they intend on pushing things higher here. We say this because not only does 1.10 denote the lower edge of the above said daily supply zone, but it also is positioned nearby a H4 alternate AB=CD completion point at 1.1005, a H4 trendline resistance extended from the high 1.1058 and a H4 78.6% Fib resistance level at 1.1012 (green circle).
Our suggestions: In view of the confluence seen around the 1.10 mark, and the uncertainty surrounding the weekly candle’s close (see above), we feel a short from 1.10 is a valid call. To give the trade some room to breathe we would advise placing stops above the current H4 trendline at around the 1.1025ish range. If you prefer, however, you could always wait for price to confirm bearish intent here in the form of a H4 bearish close, but this would likely get you in at a worse price and significantly reduce the risk/reward down to the first take-profit target: the H4 mid-way support 1.0950.
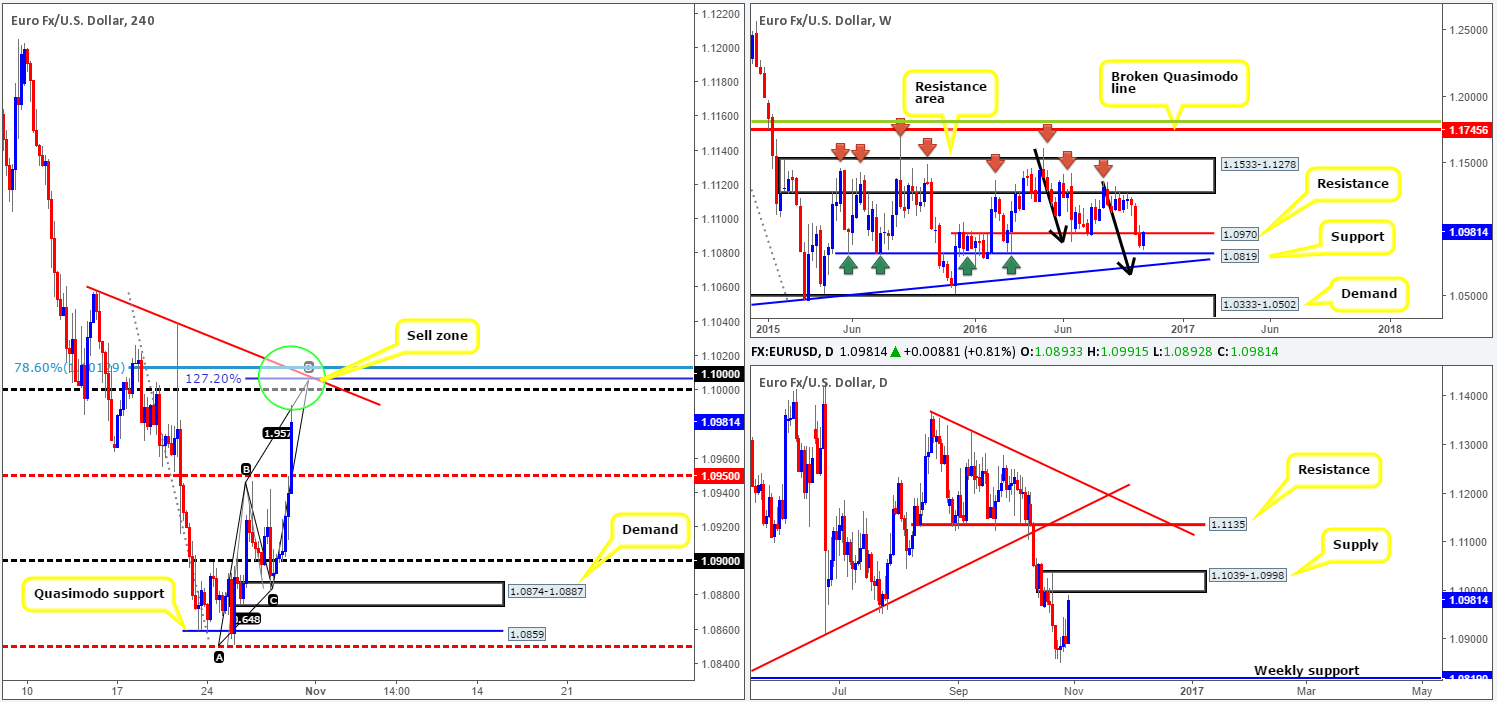
Levels to watch/live orders:
- Buys: Flat (stop loss: N/A).
- Sells: 1.10 ([pending order] stop loss: 1.1025).
GBP/USD:
Weekly gain/loss: – 42 pips
Weekly closing price: 1.2185
Weekly view: Although the pair ranged around 200 pips last week, there was little development seen on the weekly chart which resulted in the market printing an indecision candle. While there’s a strong possibility that the pound may head back down to support at 1.1904, let’s keep in mind that on the monthly chart price is seen trading within a rather large demand base between 1.0438-1.3000:
Daily view: From this viewpoint, however, the daily candles have been busy chiseling out a consolidation zone between 1.2118-1.2292 since the 11/10. Below this range, the next available support is the 1.1904 level. Meanwhile, to the upside, the next barrier of interest comes in at 1.2789-1.2928: a resistance area that sits directly below a weekly resistance at 1.2942.
H4 view: As was highlighted as a possibility in Friday’s report, price caught a bid from around the 1.2118 region (the lower edge of the daily consolidation) instead of touching base with the 1.21 handle, consequently forcing the unit to end the week shaking hands with the 1.22 band.
Direction for the week: In light of price being caught within a daily range, and weekly action not seen trading at any form of structure, direction is somewhat limited this week. Price action, of course, may take off north from the lower edge of the daily range, but this is a rough finger-in-the-wind assessment.
Direction for today: H4 upside is relatively limited, in our opinion. Not only is there the 1.22 level to contend with, but there’s a nearby minor resistance lurking just above that at 1.2237, followed by a supply zone coming in at 1.2328-1.2285. This leaves the downside open to the 1.21 region.
Our suggestions: This is not a particularly attractive market to trade right now. To become buyers, we would like to see the aforementioned H4 supply taken out and by extension, the top edge of the daily range (1.2292), thus, opening the path north up to H4 resistance at 1.2467. To become sellers, however, a close below the 1.21 neighborhood would be ideal, since this takes out the lower edge of the daily consolidation (1.2118) and opens up downside to the key figure 1.20. Nevertheless, do keep in mind that by shorting here, you’re effectively selling into monthly demand (see above).
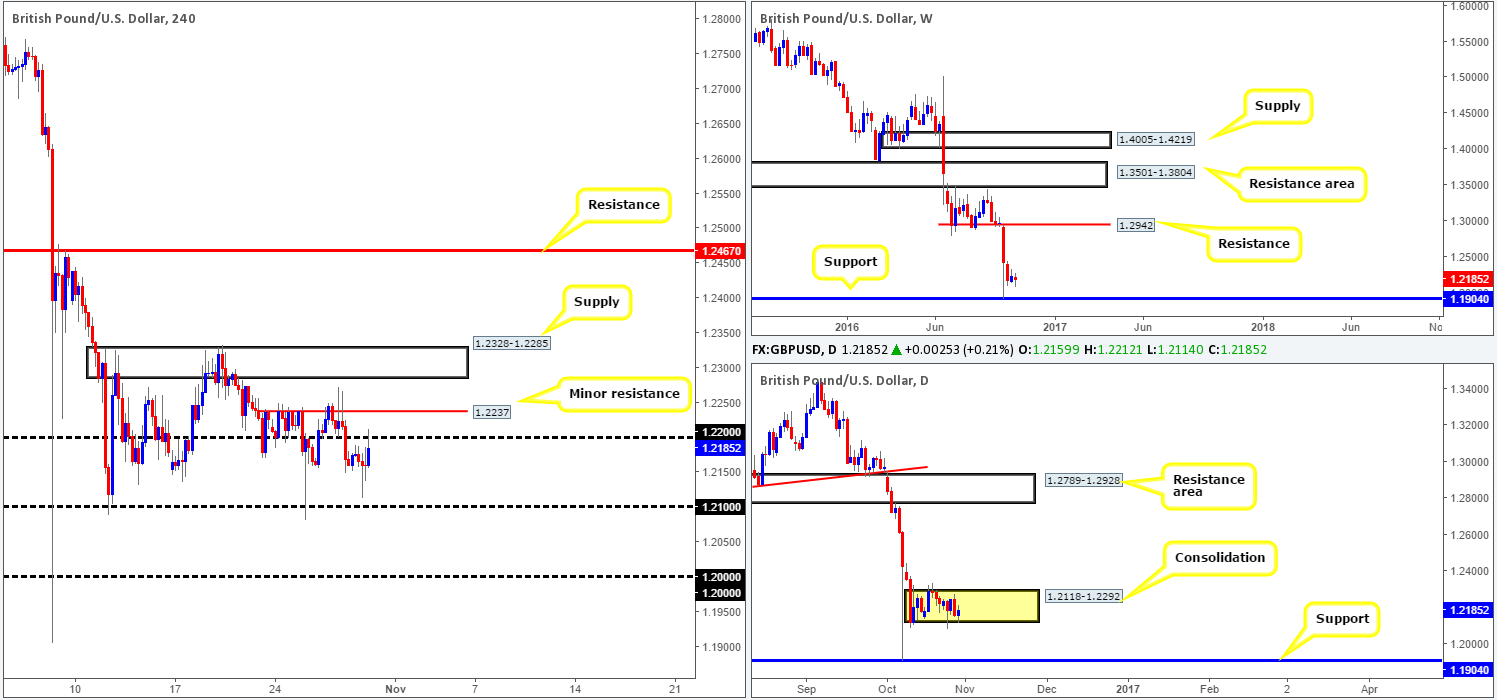
Levels to watch/live orders:
- Buys: Flat (stop loss: N/A).
- Sells: Flat (stop loss: N/A).
AUD/USD:
Weekly gain/loss: – 10 pips
Weekly closing price: 0.7594
Weekly view: Despite the Aussie remaining relatively unchanged by the week’s close, the unit chalked up its second consecutive selling wick that pierced through a trendline resistance extended from the high 0.8295. As a result of this, the bears may look to head down to an ascending channel support line this week drawn from the low 0.6827.
Daily view: The story on the daily chart shows that the commodity currency closed the week mid-range between supply coming in at 0.7765-0.7714 and a support area carved from 0.7517-0.7451. Given that the support area intersects with the above said weekly ascending channel support line (the next downside target), there’s a good chance that this area will see some action this week.
H4 view: During the course of Friday’s sessions, the H4 candles printed a beautiful array of buying tails, which, as you can see, pierced through the demand base at 0.7581-0.7597. Beyond this area, we have our eye on the combined support/Quasimodo level at 0.7533 (sits directly above a daily support area at 0.7517-0.7451), while to the upside, the runway looks clear (assuming price can close above the 0.76 handle that is) for prices to challenge the H4 mid-way resistance 0.7650.
Direction for the week: Through our analysis on the higher timeframes, we feel that the pair is likely heading lower this week, at least until it connects with the above said daily support area.
Direction for today: In that the majority of buyers are likely consumed around the current H4 demand thanks to Friday’s aggressive H4 tails (coupled with the higher-timeframe structures), a downside move, in our estimation, is more favorable.
Our suggestions: Watch for price to close below the current H4 demand. Should this come into view, wait for a retest to the underside of this zone followed up by a H4 bearish close. Once this has been satisfied, a short from here is, at least in our opinion, valid down to the H4 support/Quasimodo at 0.7533.
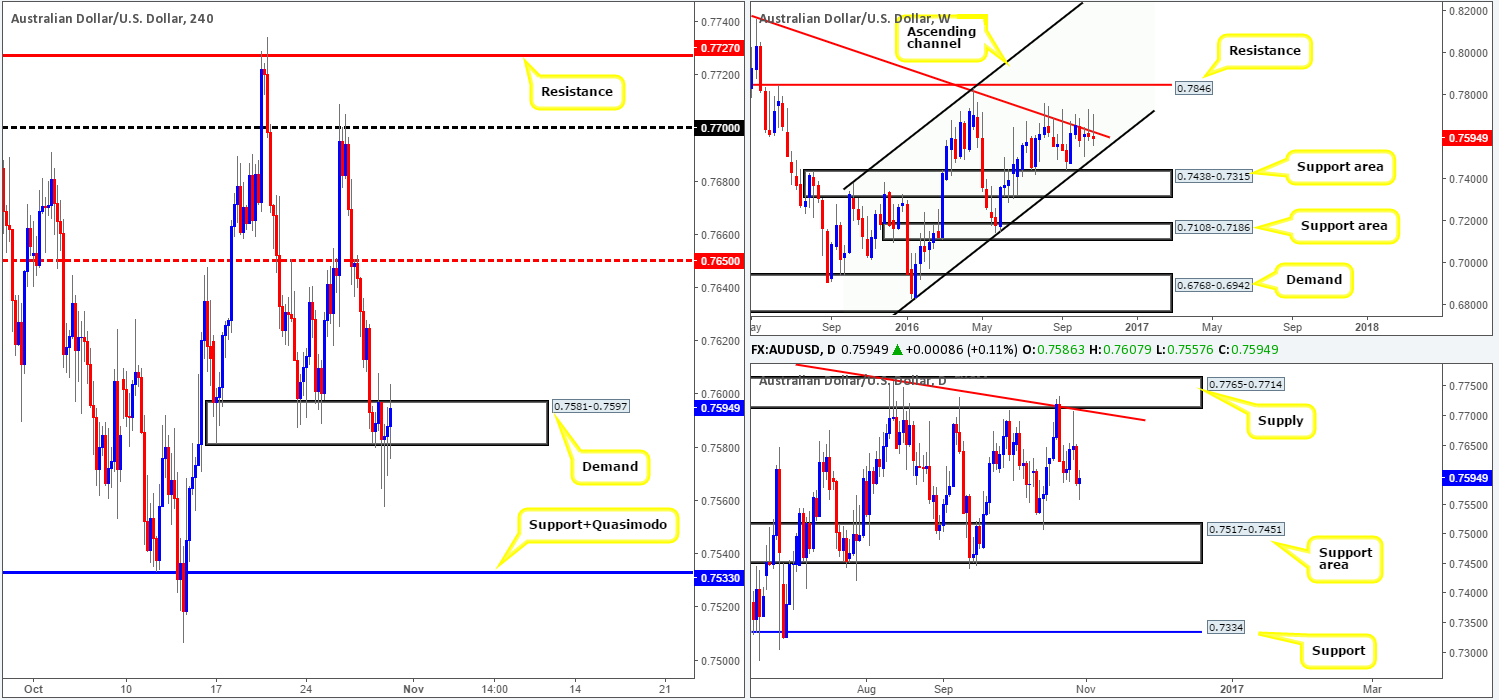
Levels to watch/live orders:
- Buys: Flat (stop loss: N/A).
- Sells: Watch for a close below the H4 demand at 0.7581-0.7597 and then look to trade any retest seen thereafter (H4 bearish close required – stop loss: ideally beyond the trigger candle).
USD/JPY:
Weekly gain/loss: + 84 pips
Weekly closing price: 104.66
Weekly view: Over the last week we saw the bulls press forward, consequently forcing the pair to cross paths with a resistance area penciled in at 105.19-107.54. Bearing in mind that this barrier stretches as far back as 2014, we feel the buyers will have their work cut out for them if they intend on pushing things higher from here. Any sustained move beyond this area, however, would likely place the supply at 111.44-110.10 in the limelight, whereas a rotation from the current resistance area has the support at 100.61 to target.
Daily view: In conjunction with the weekly chart, the daily candles also recently shook hands with a supply zone carved from 105.60-105.25, which happens to sit within the lower limits of the above said weekly resistance zone. In the event that bears remain in the driving seat here, the next target to have on your hit list falls in at 103.50-103.89: a support area.
H4 view: Eleven days before the US elections, the FBI reopened the case into Hillary Clinton’s use of an unauthorized e-mail server. This saw the dollar tumble against the Japanese Yen, taking out the 105 handle and thrusting itself into the H4 mid-way support at 104.50 by the week’s close.
Direction for the week: Technically speaking, we foresee further selling this week down to at least the aforementioned daily support area at 103.50-103.89. Thereafter, a decision will need to be made as to whether to either respect this support zone or to continue pushing lower to support at 102.63.
Direction for today: As we mentioned in Friday’s report, we’re sure most will agree, at least from a technical (structural) standpoint, that this pair is overbought right now. Therefore, we see two possible scenarios playing out today.
- The bears continue to push lower and close below 104.50, and therefore open the doors to a move down to the 104 handle (essentially the top edge of the above mentioned daily support area).
- The bulls defend 104.50 and bid price back up to retest the 105 number, which will likely be respected as resistance.
Our suggestions: Both scenarios are tradable according to our desk. However, to trade option one we’d require a retest of 104.50 as resistance followed by a H4 bearish close, before a short trade is permitted. Option two would also have need of a H4 bearish close prior to pulling the trigger.
Both of the noted levels are fixed, and, therefore, are susceptible to fakeouts, hence the need for H4 confirmation.
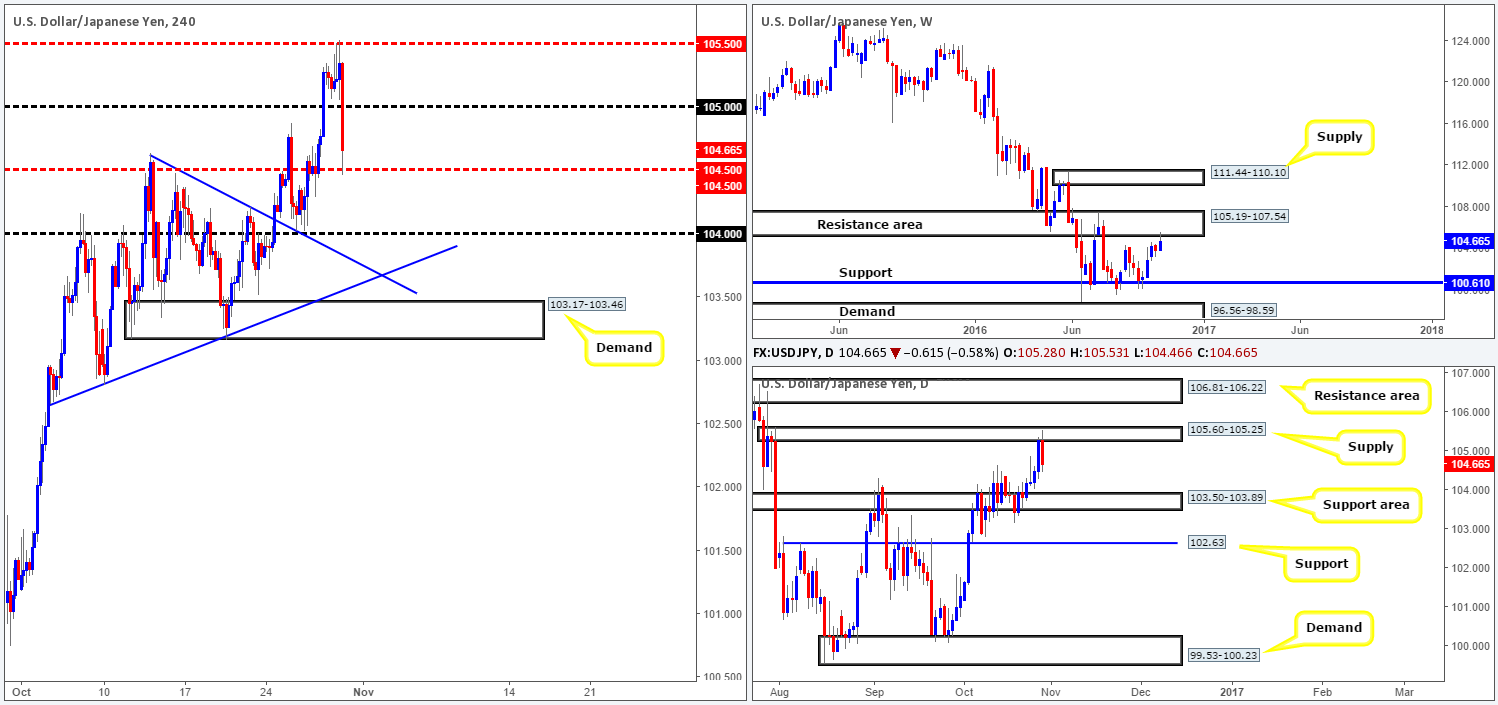
Levels to watch/live orders:
- Buys: Flat (stop loss: N/A).
- Sells: Watch for a close below the H4 mid-way support at 104.50 and then look to trade any retest seen thereafter (H4 bearish close required – stop loss: ideally beyond the trigger candle). 105 region (H4 bearish close required] stop loss: ideally beyond the trigger candle).
USD/CAD:
Weekly gain/loss: + 58 pips
Weekly closing price: 1.3391
Weekly view: The USD/CAD appreciated for a second straight week last week, consequently closing slightly above the resistance level seen at 1.3381 by the week’s end. In the event that market participants take this close as positive, the next goal will likely be to achieve 1.3814: a resistance level.
Daily view: In recent trading, we can see that two back-to-back indecision candles were printed during Thursday and Friday’s sessions. Generally speaking, this is considered to represent uncertainty within the market. However, taking into account the location of these candles: a resistance level at 1.3414, an AB=CD completion point around the 1.3376ish range and a channel resistance taken from the high 1.3241, we feel the path of least resistance is south.
H4 view: (Trade update: Stop was hit at 1.3410 for a loss).
Let’s be honest here, Friday’s candles are a mess. We feel for anyone who got caught up in all of this, which includes us! With that being said though, one thing was evident, the 1.34 handle stood its ground as the buyers attempted to close above this number on several occasions going into the close.
Direction for the week: Although our desk has suffered two consecutive losses attempting to short this market, the technical structure shows price remains trading in overbought territory. Therefore, a rotation to the downside is likely on the cards, possibly bringing the unit back down to daily support at 1.3029.
Direction for today: Ultimately, we would like to see the bears continue to defend 1.34 today/this week. To our way of seeing things, there’s little active demand seen to the left of current price and, as such, we may see 1.33 tagged into the action sometime soon.
Our suggestions: The closing H4 bearish selling wick is very attractive given that it pierced through 1.34 and also taking into account where it formed on the higher-timeframe picture. That being said, nevertheless, we’ll require a lower timeframe sell signal to form before we look to short this market (see the top of this report for lower timeframe entry techniques), since there’s a good chance that yet another whipsaw through the 1.34 handle may take shape today.
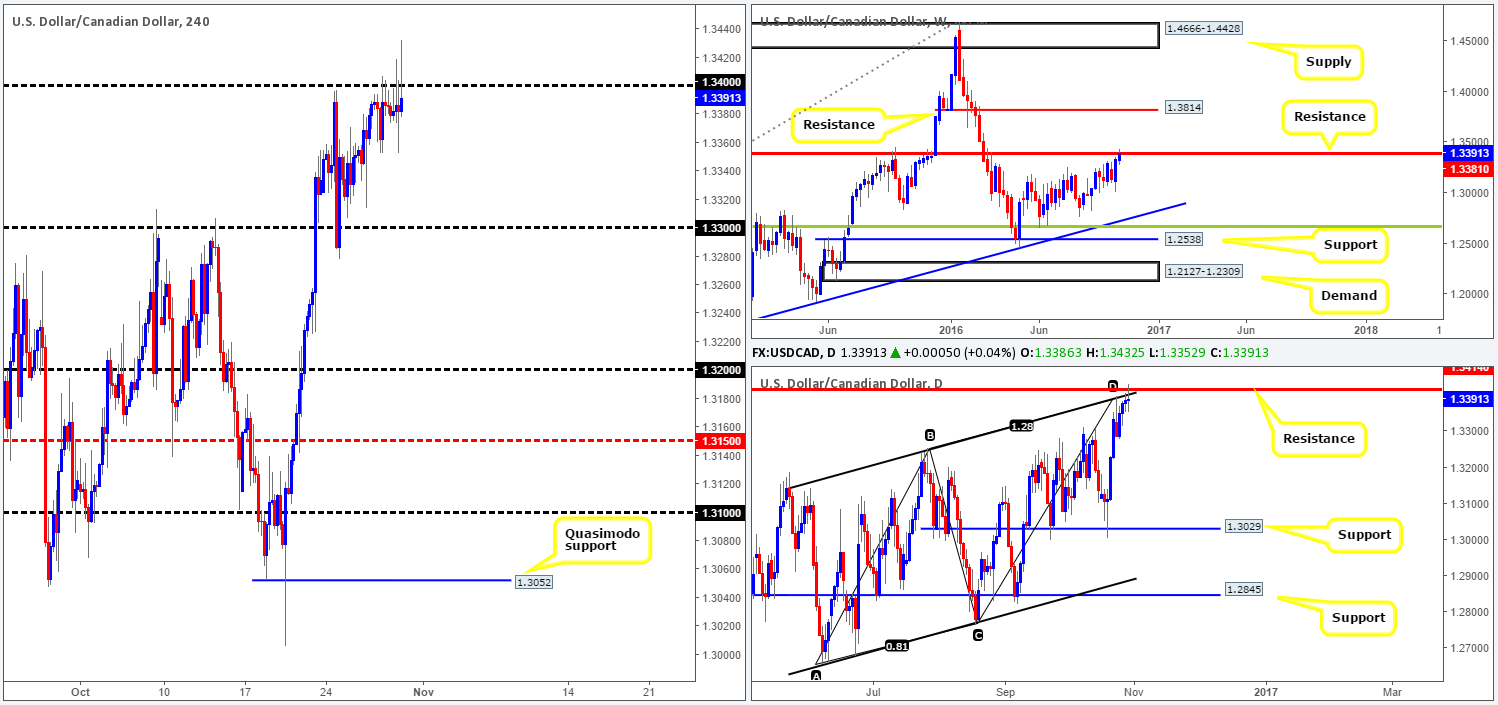
Levels to watch/live orders:
- Buys: Flat (stop loss: N/A).
- Sells: 1.34 region ([lower timeframe confirmation required] stop loss: dependent on where one confirms this area).
USD/CHF:
Weekly gain/loss: – 58 pips
Weekly closing price: 0.9874
Weekly view: From this angle, we can see that the pair has spent the last six months consolidating between a supply zone painted at 1.0092-0.9928 and a support band drawn from 0.9581. As you can see from the chart, however, the recently closed weekly candle sold off from within the supply area last week, consequently erasing the prior week’s gains.
Daily view: The Swissy spent the best part of last week loitering within a supply zone seen at 0.9956-0.9921 that is glued to the underside of the above said weekly supply. In consequence to Friday’s selloff from here, the unit is now seen within striking distance of a support level coming in at 0.9841. While this level stands a good chance of stabilizing price, we feel, given the weekly picture, that it will be a short-lived defense and the pair will head on down to test the trendline support extended from the high 1.0256.
H4 view: Thanks to Friday’s heavy bout of selling, instigated by the FBI reopening the case into Hillary Clinton’s use of an unauthorized e-mail server, the support at 0.9909 (now acting resistance) was violently taken out, allowing price to freely connect with a broken Quasimodo level at 0.9863 (fuses with a trendline support taken from the high 0.9817).
Direction for the week: We feel direction will, at least at the beginning of the week, likely see price consolidate around the daily support level mentioned above at 0.9841. Ultimately though, we believe this level will be consumed and prices will drive lower in line with weekly expectations (see above).
Direction for today: Just because both the weekly and daily charts advocate selling, this does not mean that the current H4 broken Quasimodo line will not hold firm today. A break through this barrier, however, will almost certainly confirm that the daily candles are going to shake hands with the aforementioned daily support level.
Our suggestions: Although H4 price may hold at 0.9863, we would not feel comfortable buying from here into potential weekly sellers. By the same token, we would also not feel happy about selling beyond 0.9863, knowing that the daily support at 0.9841 lurks just below. As a result, our team has come to a consensus that remaining flat for the time being is likely the better path to take.
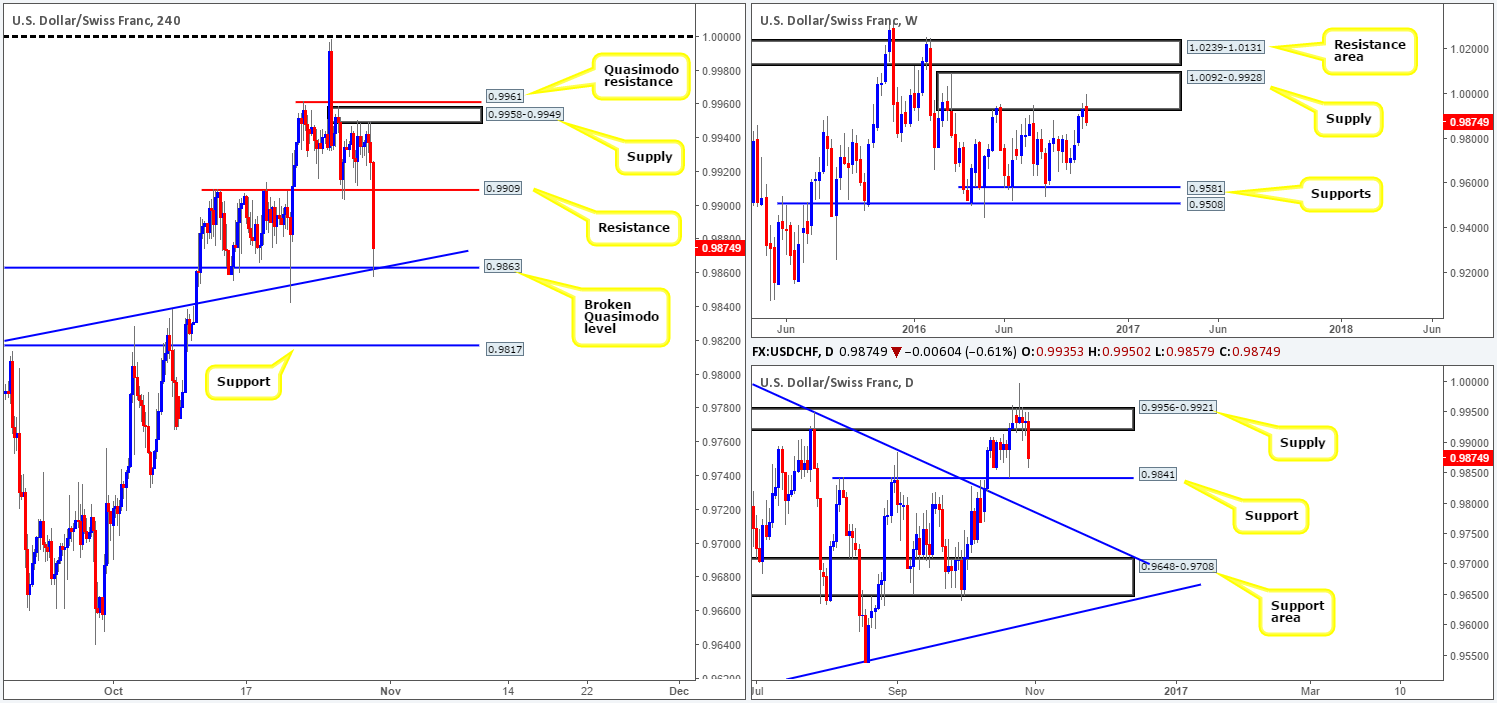
Levels to watch/live orders:
- Buys: Flat (stop loss: N/A).
- Sells: Flat (stop loss: N/A).
DOW 30:
Weekly gain/loss: +31 points
Weekly closing price: 18177
Weekly view: The DOW, once again, remained pretty much unchanged by the week’s closing point, recording a mere 31-point gain and printing its second consecutive indecision candle. Since September 12, the weekly candles have been sandwiched between a resistance drawn from 18365 and a support level coming in at 17977. Correct us if we’re wrong here, but we believe this consolidation is due to the uncertainty surrounding the upcoming US elections.
If the range support is consumed, the support area at 17446-17606 would likely be the next objective to reach. A push above the range resistance level on the other hand, could signal that the bulls are ready to strike fresh highs and continue trading northbound.
Daily view: In a similar fashion to the weekly chart, the daily candles are seen consolidating between a resistance at 18322 and a broken Quasimodo line penciled in at 18018. A violation of this Quasimodo boundary would likely lead to a test of the demand base seen at 17710-17863, whereas a break above the resistance could force price to connect with supply carved from 18553-18492.
H4 view: Looking across to the H4 chart, the buyers and sellers have been locked between a resistance area at 18276-18248 and a support registered at 18066 since mid-Oct. Taking into account that this consolidation has very little higher-timeframe confluence, our desk has absolutely no interest in trading within these walls. Instead, as we have mentioned several times in previous reports, the only areas we have interest in at the moment is the Quasimodo support at 17999 and the resistance area at 18370-18321. The Quasimodo is attractive because it fuses with nearby weekly support at 17977 and also the daily broken Quasimodo line at 18018.The resistance zone, however, is equally attractive since it houses both the daily resistance level at 18322 and the weekly resistance at 18365.
Direction for the week: Direction for the week is difficult to pin down at this point given that all three timeframes we follow show a complete range-bound market.
Direction for today: Given how well respected the H4 range limits have been over the past couple of weeks, traders may want to consider trading within this box (we would not advise entering from these lines, however, until a reasonably sized H4 candle has taken shape to show possible intent).
Our suggestions: For us personally, at least for the time being, we’ll stick with our original outlook and target the above said zones outside of the current H4 range. For those who agree with our analysis, we would still advise waiting for a H4 close prior to risking capital at these areas.
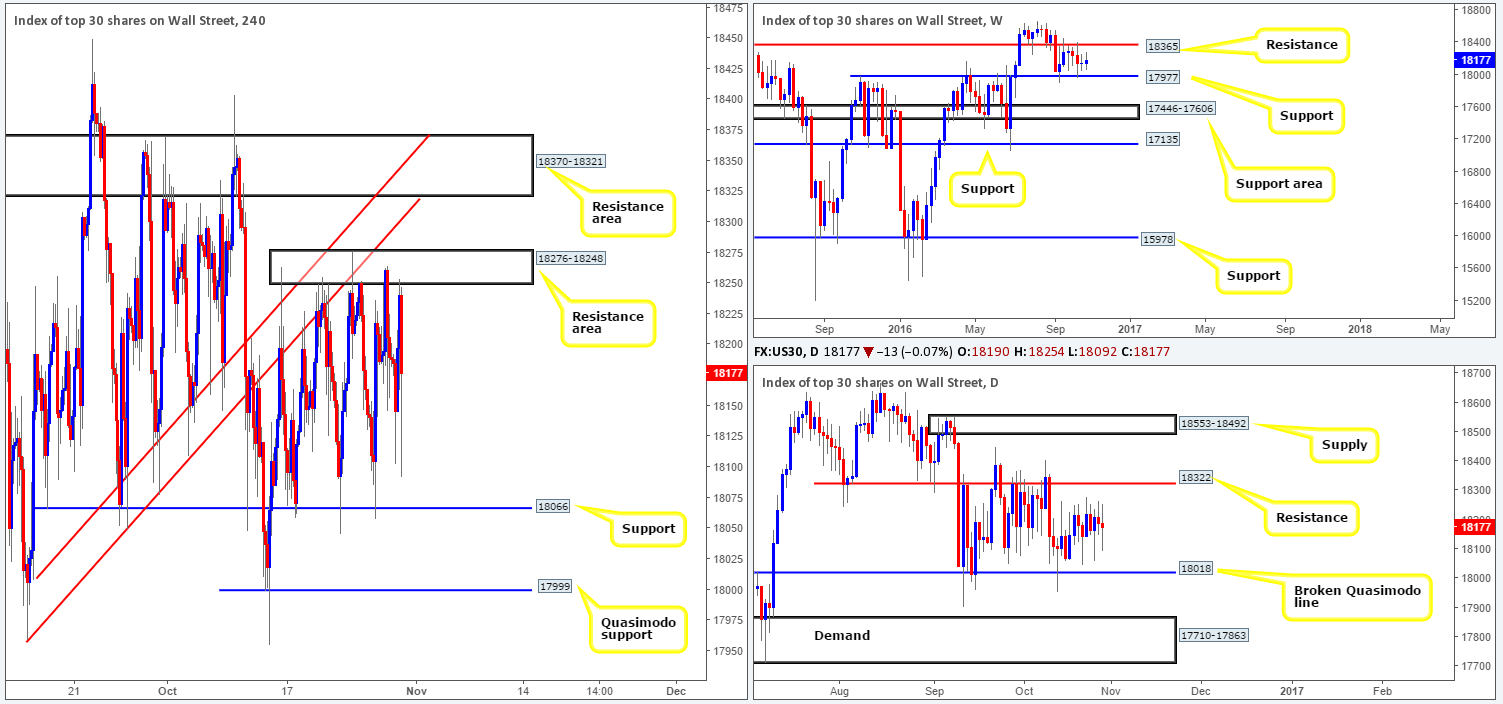
Levels to watch/live orders:
- Buys: 17999 ([H4 bullish close required] stop loss: ideally beyond the trigger candle).
- Sells: 18370-18321 ([H4 bearish close required] stop loss: ideally beyond the trigger candle).
GOLD:
Weekly gain/loss: + $9.7
Weekly closing price: 1275.7
Weekly view: Following an aggressive move through the 1307.4-1280.0 area some four weeks back, the metal recently retested the underside of this zone as resistance. Assuming that the sellers hold ground here, there’s potential for move down to the support area coming in at 1205.6-1181.2 (fuses with two weekly trendline supports [1071.2/1130.1]).
Daily view: On the other side of the field, however, the gold market still appears to be trading in no-man’s-land at the moment between the daily resistance level at 1301.5 and a daily demand zone coming in at 1234.6-1244.9.
H4 view: Across the board, we saw the US dollar selloff on Friday a few hours before the market closed for the week, thus reviving demand for the safe-have commodity. This move, which was likely triggered by the FBI’s recent action concerning the reopening of the case into Hillary Clinton’s use of an unauthorized e-mail server, saw the yellow metal aggressively attack the H4 supply area at 1277.1-1272.4 going into the close.
Direction for the week: Though weekly action recently connected with the underside of a resistance area at 1307.4-1280.0, suggesting lower prices may be in order, there is, however, room seen for the unit to appreciate on the daily timeframe up to the daily resistance coming in at 1301.5. Therefore, judging medium-term direction is tricky for now.
Direction for today: Given that the H4 candles have been trading within a phase of consolidation between the current supply zone and a demand at 1260.2-1263.8 since Oct 20, there is a chance that price may remain within this consolidation today, as Mondays are notoriously quiet trading days.
Our suggestions: With the above notes taken on board, our desk is still interested in seeing a break above the current H4 supply barrier. The reason being is that beyond this area the pathway north on the H4 is clear up to the aforementioned daily resistance. As such, should price retest this boundary as demand (after a close higher) followed by a reasonably sized H4 bull candle, one could look to go long from here targeting the daily level. However, do remain aware that by entering long from here, even with the confirmation of a H4 bull candle, you’re effectively buying directly into a weekly resistance area.
Should a close be seen below the current H4 demand on the other hand, we may, depending on if the H4 candles retest the underside of this area as supply, look to short from here (H4 bearish close required), given that price recently came into contact with the aforementioned weekly resistance area.
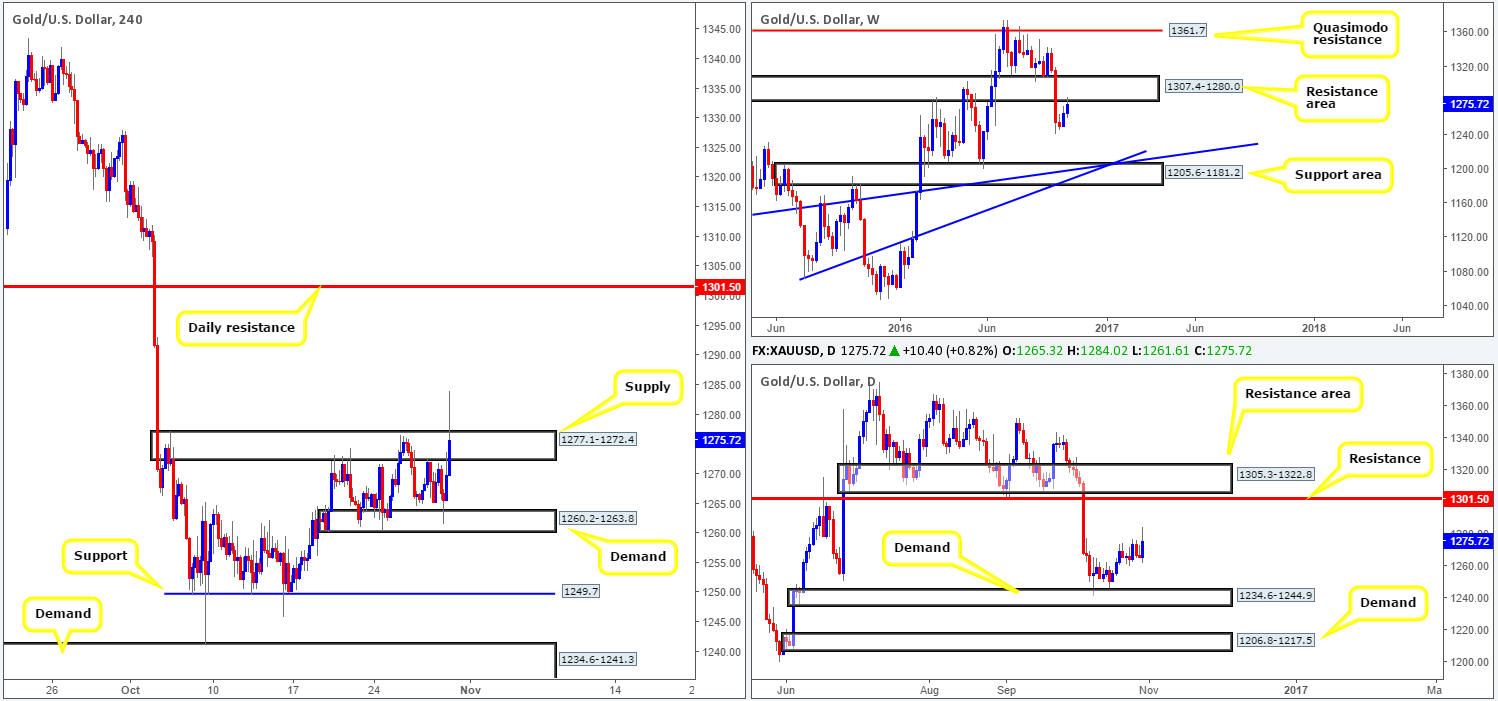
Levels to watch/live orders:
- Buys: Watch for a close above the H4 supply at 1277.1-1272.4 and then look to trade any retest seen thereafter (H4 bullish close required – stop loss: ideally beyond the trigger candle).
- Sells: Watch for a close below the H4 demand at 1260.2-1263.8 and then look to trade any retest seen thereafter (H4 bearish close required – stop loss: ideally beyond the trigger candle).


