A note on lower timeframe confirming price action…
Waiting for lower timeframe confirmation is our main tool to confirm strength within higher timeframe zones, and has really been the key to our trading success. It takes a little time to understand the subtle nuances, however, as each trade is never the same, but once you master the rhythm so to speak, you will be saved from countless unnecessary losing trades. The following is a list of what we look for:
-
A break/retest of supply or demand dependent on which way you’re trading.
-
A trendline break/retest.
-
Buying/selling tails – essentially we look for a cluster of very obvious spikes off of lower timeframe support and resistance levels within the higher timeframe zone.
-
Candlestick patterns. We tend to only stick with pin bars and engulfing bars as these have proven to be the most effective.
EUR/USD:
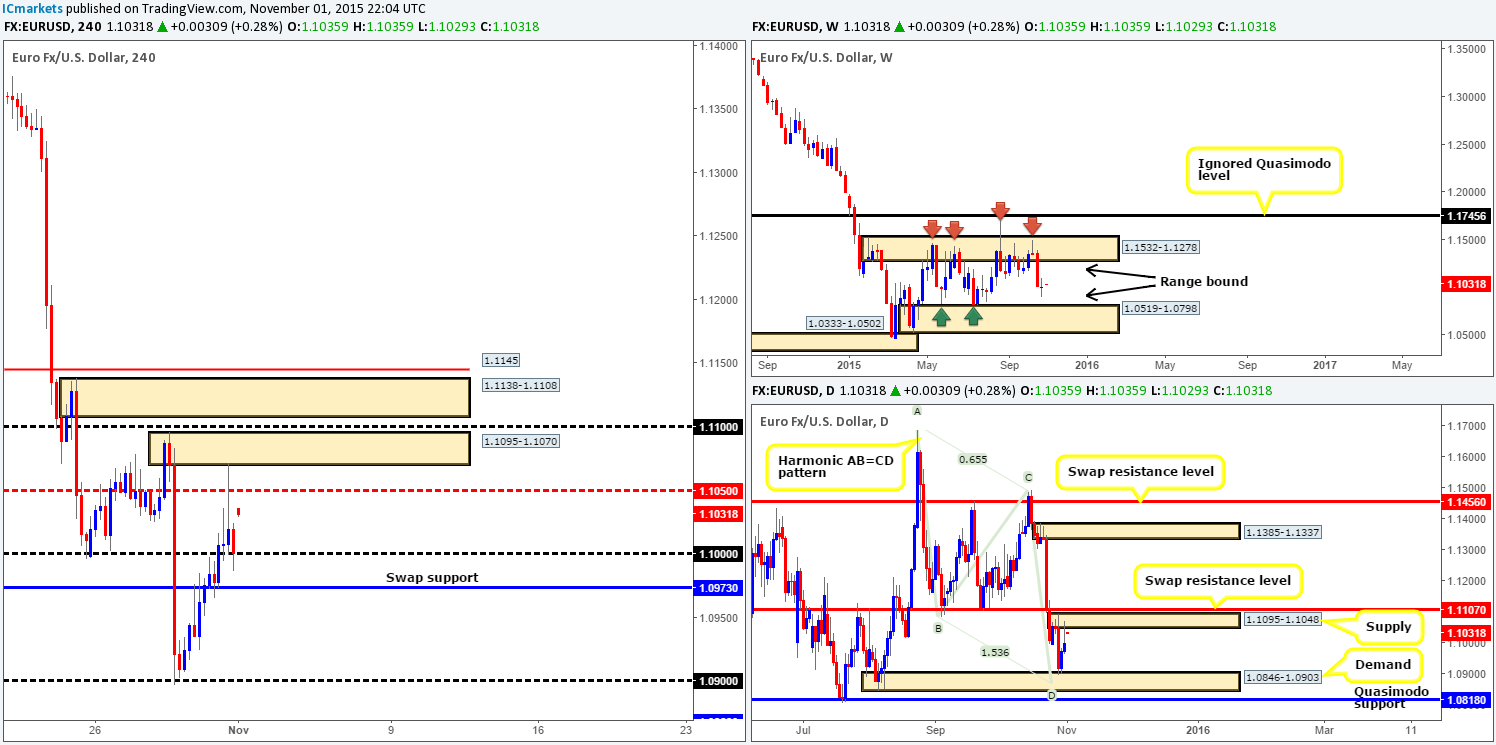
Weekly view: All in all, the month of October ended with the EUR/USD remaining unchanged at the close 1.1000. Price peaked at 1.1095 and recorded lows of 1.0896, consequently forming a clear-cut indecision candle. Ultimately, we’re labeling this timeframe: ‘mid-range’ right now, as price is trading between demand at 1.0519-1.0798, and supply coming in from 1.1532-1.1278. This, from our perspective, is never a good thing when attempting to determine direction unless price is trading at the extremes of the range! It will be interesting to see what’s on offer lower down the scale…
Weekly levels to watch this week fall in at: 1.1532-1.1278/1.0519-1.0798.
Daily view: On the other side of the spectrum, daily action shows price rebounded beautifully from the top-side of demand on Thursday at 1.0846-1.0903 (also coincides with a nice-looking Harmonic AB=CD bull pattern at 1.0869). Following this, price rallied higher to connect with supply drawn from 1.1095-1.1048, which also reacted with beautiful precision, and formed a bearish selling wick, effectively (like the weekly timeframe) placing price mid-range between the two aforementioned zones by the week’s end.
Daily levels to watch this week fall in at: 1.1095-1.1048/ 1.0846-1.0903.
4hr view: Following the close above and retest of the swap resistance (now support) level at 1.0973 on Friday, price continued north, breaking above and retesting psychological resistance 1.1000 as support. From here, the U.S. open, we saw the EUR aggressively spike north, surpassing mid-level resistance 1.1050 to tag in offers around supply sitting at 1.1095-1.1070, before ending the week back down on top of 1.1000.
Breaking into a new week with a gap north of over thirty pips at 1.1035, we see very little opportunity for medium-term positions today unless prices cross swords with supply mentioned above at 1.1095-1.1070 (as it is located deep within daily supply at 1.1095-1.1048), or psychological support 1.0900 (positioned just above daily demand at 1.0846-1.0903).
Intraday, however, we’re currently watching 1.1000. In the event of a trade being taken from this number, we would require lower timeframe confirming price action before committing capital here. Targets from this support come in at 1.1050, followed closely by the aforementioned 4hr supply zone.
Levels to watch/live orders:
-
Buys: 1.0900 [Tentative – confirmation required] (Stop loss: dependent on where one confirms this level) 1.1000 [Tentative – confirmation required] (Stop loss: dependent on where one confirms this level).
-
Sells: 1.1095-1.1070 [Tentative – confirmation required] (Stop loss: dependent on where one confirms this area).
GBP/USD:
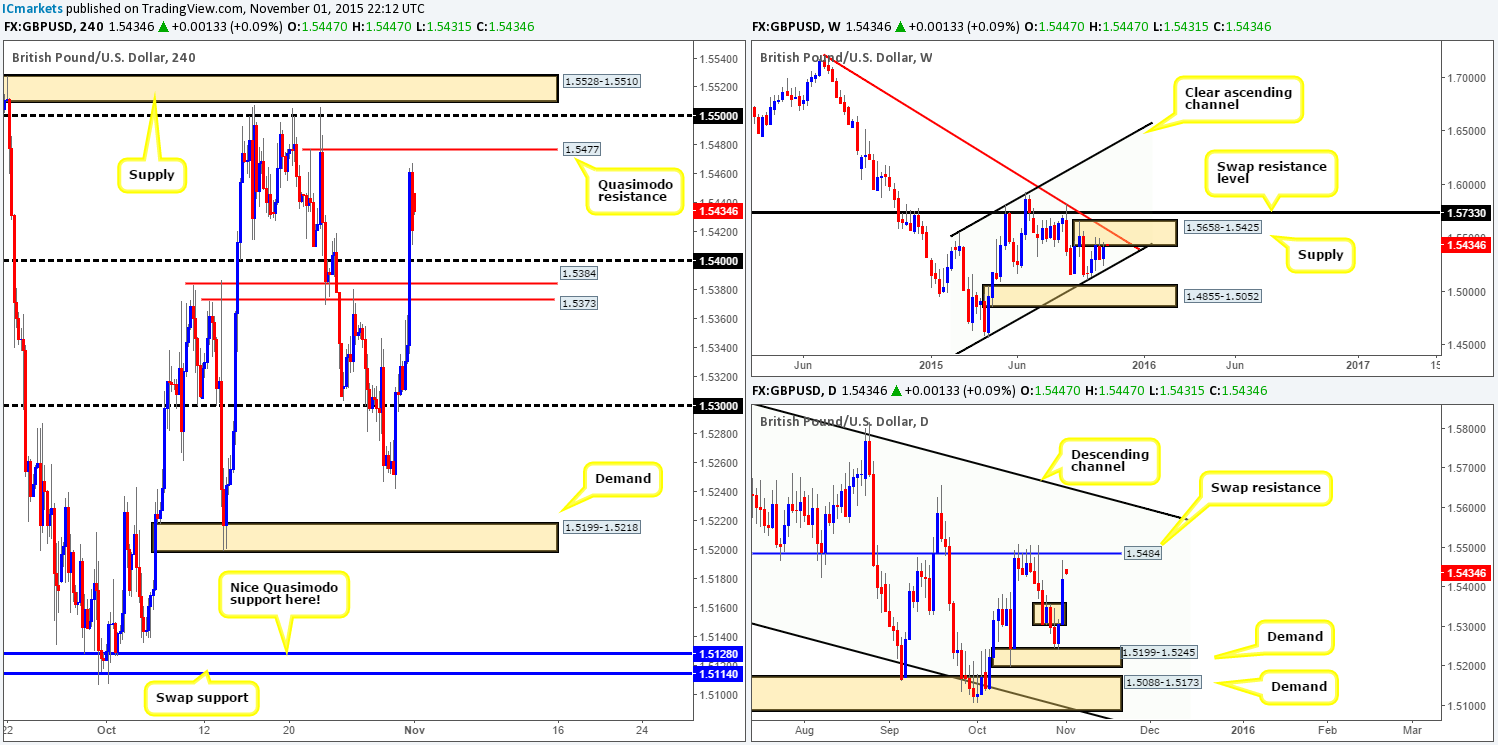
Weekly view: Cable posted a moderate gain of 115 pips by the close 1.5306 last week. This, as you can see, pushed market action back up into the jaws of supply drawn from 1.5658-1.5425 (converges with trendline resistance from the high 1.7190). A break above this barrier this week would likely force price to touch gloves with a swap resistance level seen at 1.5733. Meanwhile, a push lower from this supply could see price connect with channel support extended from the low 1.4564.
Weekly levels to watch this week fall in at: 1.5658-1.5425/1.5733/Channel support.
Daily view: From this angle, we can see that price responded positively to demand coming in at 1.5199-1.5245 on Thursday. Consequent to this, relatively aggressive follow-through buying was seen on Friday, taking out offers sitting around a minor supply area at 1.5358-1.5306, and almost crossing swords with a swap resistance hurdle at 1.5484 before slightly selling off into the weekend. Therefore, both this resistance level and the demand zone mentioned above are definitely worth noting on your watch lists for this week’s trade.
Daily levels to watch this week fall in at: 1.5199-1.5245/ 1.5484.
4hr view: As we already mentioned above, Friday’s action was heavily bid. From this timeframe, both the closely-linked swap resistance levels at 1.5384/1.5373 were taken out, along with psychological resistance 1.5400, reaching highs of 1.5467 on the day before pulling back to lows of 1.5411 by the week’s end.
Pushing forward, this morning’s gap higher of 26 pips at 1.5547 made very little difference to the overall structure of this market. Taking into consideration that current action on the weekly timeframe is kissing the underside of supply at the moment, and price is relatively close to touching gloves with a swap resistance level on the daily timeframe (see above), buying this market today/early this week could be risky. That being the case, we’re ultimately eyeing the following zones for shorts:
-
Quasimodo resistance at 1.5477. This is the last fresh barrier of offers left in the market until psychological resistance 1.5500. Therefore, it is likely going to bounce price when or indeed if we see a touch of this level (confirmation required).
-
Supply at 1.5528-1.5510. Given that the round number 1.5500 is lurking just below this area, we believe this number will be faked should price reach this high. Traders are likely looking at how well 1.5500 held from the 15th to the 22nd of October and likely believe it will do so again (and it might). However, there is a high probability well-funded traders will fake this number to collect stops, and at the same time, this will stab into fresh orders above at near-term supply. Due to where this area is positioned on the higher timeframe picture on both the daily and weekly timeframes (see above), we have set a pending sell order at 1.5506 with a stop above at 1.5532.
Levels to watch/ live orders:
-
Buys: Flat (Stop loss: N/A).
-
Sells: 1.5477 [Tentative – confirmation required] (Stop loss: dependent on where one confirms this level) 1.5506 [Pending order] (Stop loss: 1.5532).
AUD/USD:
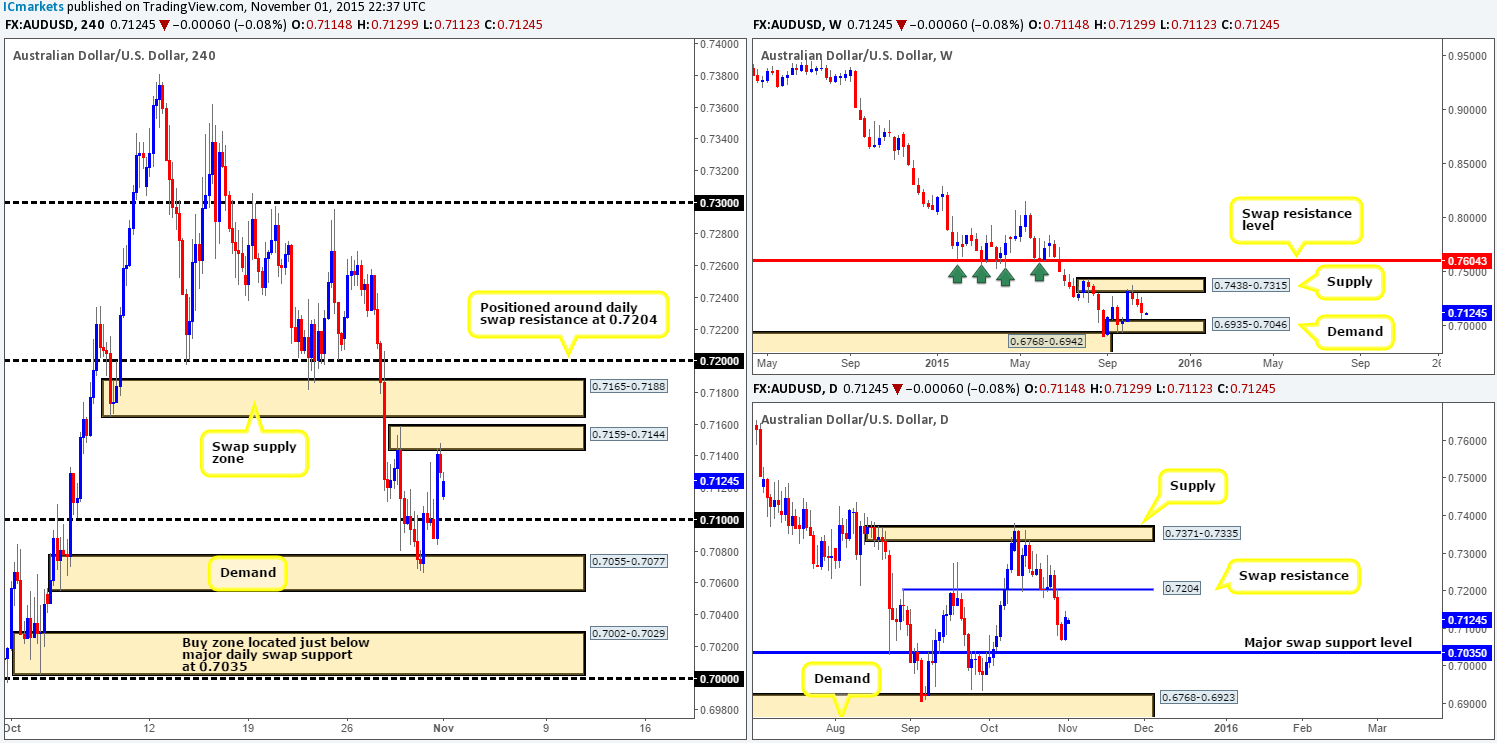
Weekly view: The Aussie dollar sustained further losses for a third consecutive week, erasing eighty pips off of the currency’s value. As a consequence of this decline, price came within twenty pips of hitting demand seen at 0.6935-0.7046, which, as you can see, saw price begin to recover going into the week’s close 0.7130. To our way of seeing things, at least from this timeframe, this pair has little direction until either the above said demand area, or the supply zone where price came from at 0.7438-0.7315 is hit. It will be interesting to see what the lower timeframes have to offer…
Weekly levels to watch this week fall in at: 0.7438-0.7315/ 0.6935-0.7046.
Daily view: Early on last week, swap support at 0.7204 gave way thus clearing the path south for further selling down to a major swap support level coming in at 0.7035 (sits just within the above said weekly demand). Both Wednesday and Thursday did indeed continue to fall as expected; it was Friday’s action, however, that spoiled the fun! Buying interest came into the market from lows of 0.7066 and completely engulfed Thursday’s bear candle. With this in mind, we see it as price can either do two things this week: (1) Reverse and continue on its descent lower to connect with 0.7035, as let’s not forget this rally could have simply been traders squaring positions for the week/month, (2) price could push higher and run on to connect with 0.7204, which is now considered resistance.
Daily levels to watch this week fall in at: 0.7035/0.7204.
4hr view: Following on from Friday’s reaction to supply at 0.7159-0.7144, a minor gap lower of sixteen pips was seen this morning. This gap was quickly filled by eager bids and little difference has been made to the overall structure of this pair.
Overall, this is what we have jotted down so far for this week:
On the buy side, we’re looking at the following for an intraday bounce…
-
Psychological support 0.7100. Although little response was seen from this number last week, we still believe it is worth keeping an eye on for a possible trade.
-
Demand at 0.7055-0.7077. This barrier responded better than expected during Thursday’s trade last week and could potentially bounce price again later on today/this week.
-
Demand at 0.7002-0.7029. Now, this is a beauty and could provide much more than an intraday bounce seeing as it is positioned just below the major daily swap (support) level mentioned above at 0.7035.
On the sell side, we’re looking at:
-
Supply at 0.7159-0.7144. Play carefully here guys, since a fake above to the swap supply area at 0.7165-0.7188 (also a possible sell zone to keep a tab on) could be seen.
-
Psychological resistance 0.7200. This level has not only provided significant support and resistance to this market over the past month, it is also seen on the daily scale as a proven swap resistance level at 0.7204. Therefore, this barrier could be one to watch for more than an intraday move this week.
Levels to watch/ live orders:
-
Buys: 0.7100 [Tentative – confirmation required] (Stop loss: dependent on where one confirms this level) 0.7055-0.7077 [Tentative – confirmation required] (Stop loss: dependent on where one confirms this area) 0.7002-0.7029 [dependent on the approach to this zone and time of day, we may consider entering at market here] (Stop loss: likely below 0.7000 by about 10 pips).
-
Sells: 0.7159-0.7144 [Tentative – confirmation required] (Stop loss: dependent on where one confirms this area) 0.7165-0.7188 [Tentative – confirmation required] (Stop loss: dependent on where one confirms this area) 0.7200 [Tentative – confirmation required] (Stop loss: dependent on where one confirms this level).
USD/JPY:
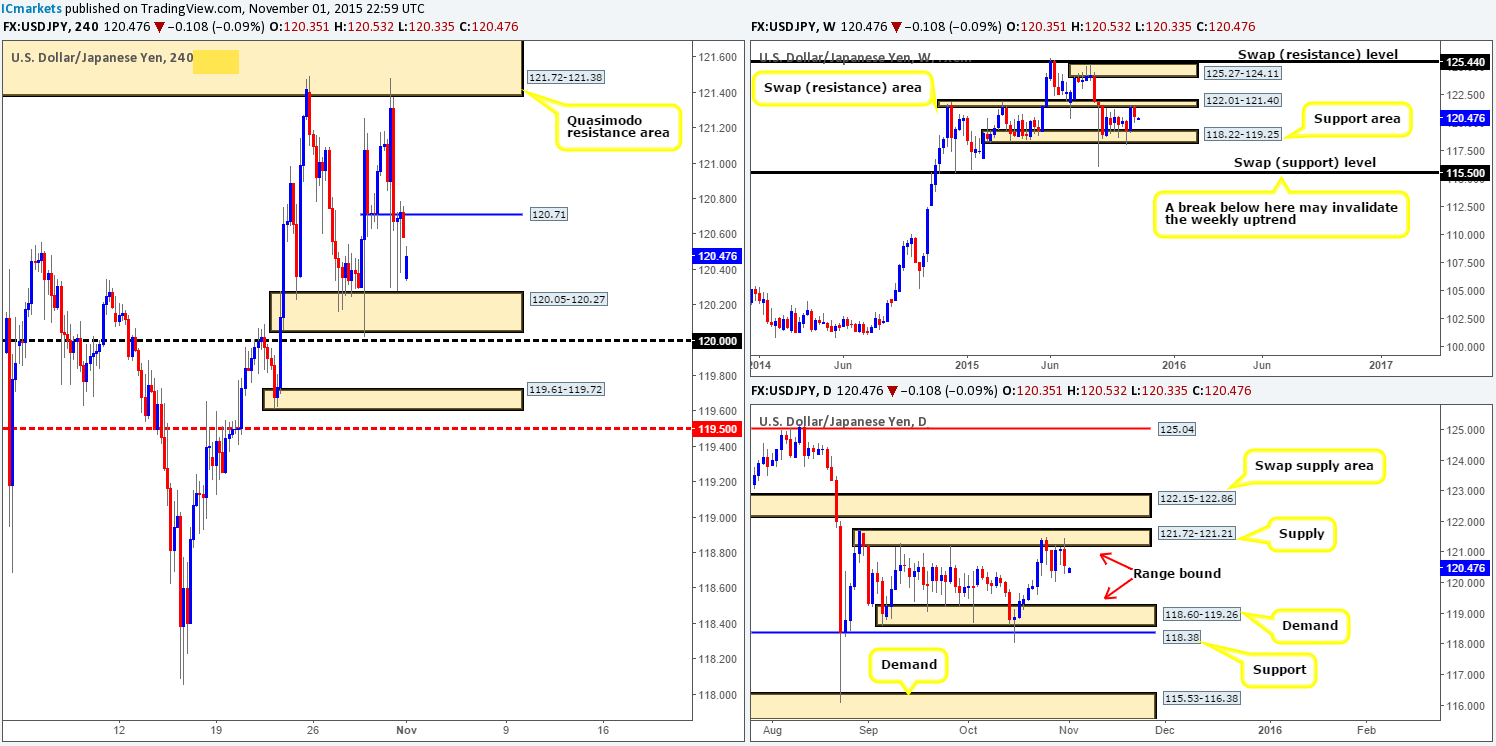
Weekly view: As can be seen from the chart, the USD/JPY responded bearishly to the range resistance area at 122.01-121.40 last week, erasing around 40% of the prior week’s gains by the close 120.58. Now, taking into account that this pair has been consolidating for two months now, we could potentially see this market drive lower this week to connect with the range support area at 118.22-119.25. A breakout north above this range, however, places supply at 125.27-124.11 in the firing line.
Weekly levels to watch this week fall in at: 122.01-121.40/ 125.27-124.11/ 118.22-119.25.
Daily view: Similar to the weekly timeframe, the buyers and sellers on the daily timeframe have been seen battling for position around the underside of a range supply area visible at 121.72-121.21. What is clearer from this chart, nonetheless, is price painted a nice-looking bearish engulfing candle on Friday, which could portend to further selling this week back down into this consolidated zone, possibly to the range demand coming in at 118.60-119.26.
A break above this range has little wiggle room to move as a swap supply area is lurking just above at 122.15-122.86. Regarding a break below this consolidation, we can see this has effectively already taken place and near-term support just below it at 118.38 was there to save the day!
Daily levels to watch this week fall in at: 121.72-121.21/ 118.60-119.26/118.38/ 122.15-122.86.
4hr view: Early on going into Friday’s sessions, the USD/JPY stabbed higher to fill offers around the Quasimodo resistance area at 121.72-121.38 (a noted area of interest for shorts in Friday’s report). This, as you can see, saw this pair aggressively drop lower, closing below 120.71 and eventually stabbing into demand at 120.05-120.27.
As we can all see, price closed the week responding bearishly to the underside of 120.71 and opened this morning with a gap lower of around 23 pips at 120.35. Given that price is effectively now capped between 120.71 and the above said demand, where do we see this market heading to today and possibly into the week?
Well, as we noted above, both the weekly and daily timeframes are showing bearish intention from respective range supplies (see above). However, from the 4hr timeframe, selling this market is not something we’d be comfortable with due to demand at 120.05-120.27 and psychological support 120.00 lurking just below.
Therefore, opting to stand on the sidelines today, at least until there is more development seen on the 4hr scale, may be the best path to take.
Levels to watch/ live orders:
-
Buys: Flat (Stop loss: N/A).
-
Sells: Flat (Stop loss: N/A).
USD/CAD:
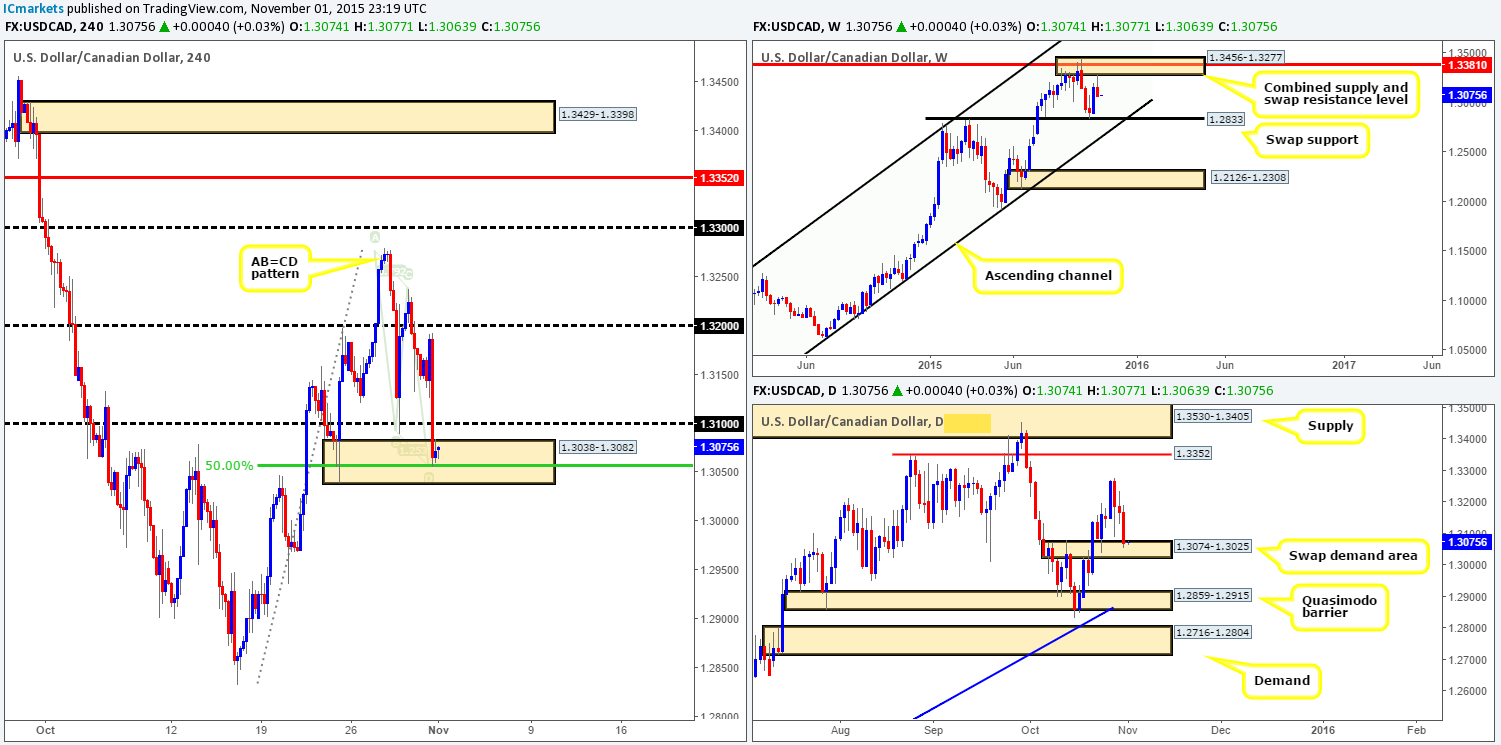
Weekly view: The Canadian dollar gained close to 100 pips against the Greenback last week. This sell-off began from the underside of supply at 1.3456-1.3277, consequently printing a bearish selling tail in the process and finishing the week off on its lows at 1.3071. Should the sellers remain dominant this week, we might see further shorts come into this market and push prices back down to the swap support barrier at 1.2833.
Weekly levels to watch this week fall in at: 1.3456-1.3277/1.2833.
Daily view: From this angle, we can see that the USD/CAD ended the week kissing the top-side of a swap demand base drawn from 1.3074-1.3025. Whether or not this area will hold is difficult to judge since let’s not forget that there is currently room for weekly action to continue driving lower (see above). In the event buyers do defend this zone this week, however, we’ll be looking at Wednesday’s high 1.3279, followed closely by the Quasimodo resistance 1.3352. On the other side of the coin, a break below this barrier could indicate that this market is ready to decline further down into the hands of a Quasimodo area seen at 1.2859-1.2915. It will be interesting to see what the 4hr timeframe has to say on the matter…
Daily levels to watch this week fall in at: 1.3074-1.3025/1.3279/ 1.3352/ 1.2859-1.2915.
4hr view: Going into the early hours of Friday’s American session, price aggressively sold off from highs of 1.3192. Consequent to this, bids were taken out at psychological support 1.3100, and price jabbed deep into demand at 1.3038-1.3082. Not only does this demand area converge nicely with the 50.0% Fibonacci level at 1.3057, but it also lines up beautifully with an AB=CD bottom coming in around 1.3057 as well.
It is a good job this morning’s open was stable at 1.3074, as we entered into a small long position at 1.3059 on Friday (area was noted to watch for longs in Friday’s report). Granted, we know we have potentially bought into weekly flow (see weekly section above), but with price trading around a swap demand base on the daily timeframe at 1.3074-1.3025, we felt relatively confident that price will at least reach our first take-profit target at 1.3100 today.
Levels to watch/ live orders:
-
Buys: 1.3059 [LIVE] (Stop loss: 1.3031).
-
Sells: Flat (stop loss: N/A).
USD/CHF:
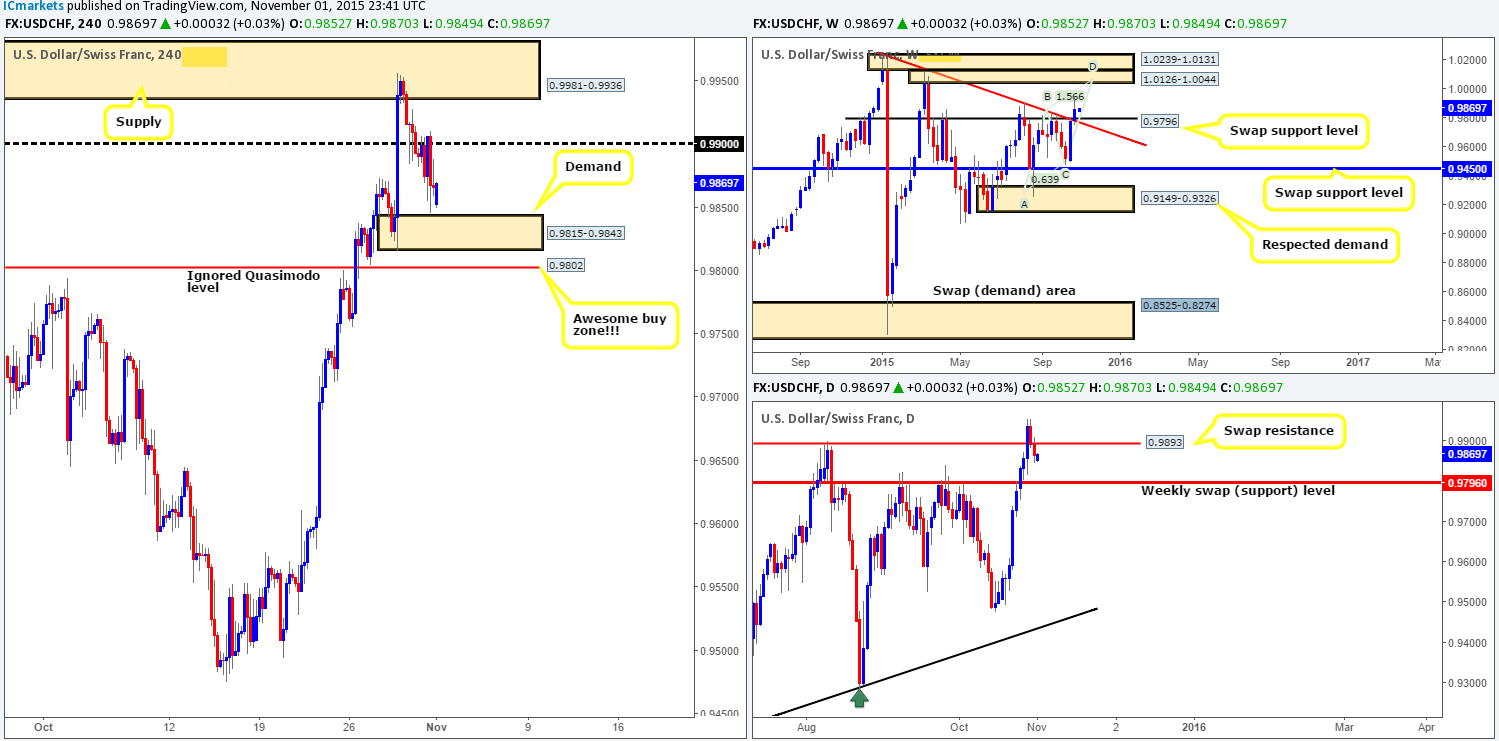
Weekly view: The U.S. dollar continued to flex its financial muscle last week as price closed (0.9866) above both the swap resistance (now support) level coming in at 0.9796, and also trendline resistance taken from the high 1.0239. For now, the weekly shows a clear run north up to a stacked area of supply coming in at 1.0239-1.0131/1.0126-1.0044. In addition to this formation, we also see a nice-looking AB=CD Harmonic pattern completing around 1.0046, thus forming one heck of a sell zone to keep an eye on! However, before price reaches here, we believe there is likely going to be buying opportunities lower down on the scale…
Weekly levels to watch this week fall in at: 0.9796/ 1.0239-1.0131/ 1.0126-1.0044.
Daily view: Daily movement shows that selling interest came into the market around the 0.9956 mark on Wednesday. As a result, this forced price below the swap support (now resistance) at 0.9893, and has potentially opened the door to further downside this week to the weekly swap (support) level at 0.9796. Should this be the case, buying from this weekly barrier is certainly something we may consider…
Daily levels to watch this week fall in at: 0.9893/0.9796.
4hr view: Moving down one lower to the 4hr scale, it is clear to see that psychological resistance 0.9900 held firm during Friday’s trade. This forced price to lows of 0.9845 on the day – just two pips shy of demand at 0.9815-0.9843.
Consequent to a relatively stable opening this morning at 0.9852, the pair still remains lurking above the aforementioned demand zone. Considering the strong momentum seen from this demand base itself, would we deem this a suitable platform in which to look for buys today? The answer to this is a resounding no. Here’s why:
-
Firstly, there is a very high probability price will fake below this area of demand into the ignored Quasimodo level (IQM) at 0.9802.
-
Secondly, unlike the IQM, this demand has no higher timeframe converging support. The IQM, on the other hand, sits just above a weekly swap (support) level at 0.9796. In addition to this, it is also positioned just two pips above psychological support 0.9800!
Therefore, given these points and depending on how price behaves within the above said demand, we may consider taking a long at 0.9802 at market today. Should this come to fruition, we’re not simply looking for a small intraday bounce from here; we’re actually looking for a good-sized move due to its relationship with the weekly timeframe (see above). It will be interesting to see how this plays out.
Levels to watch/ live orders:
-
Buys: 0.9802 [Tentative – confirmation MIGHT be required] (Stop loss: dependent on where one confirms this level).
-
Sells: Flat (Stop loss: N/A).
DOW 30:
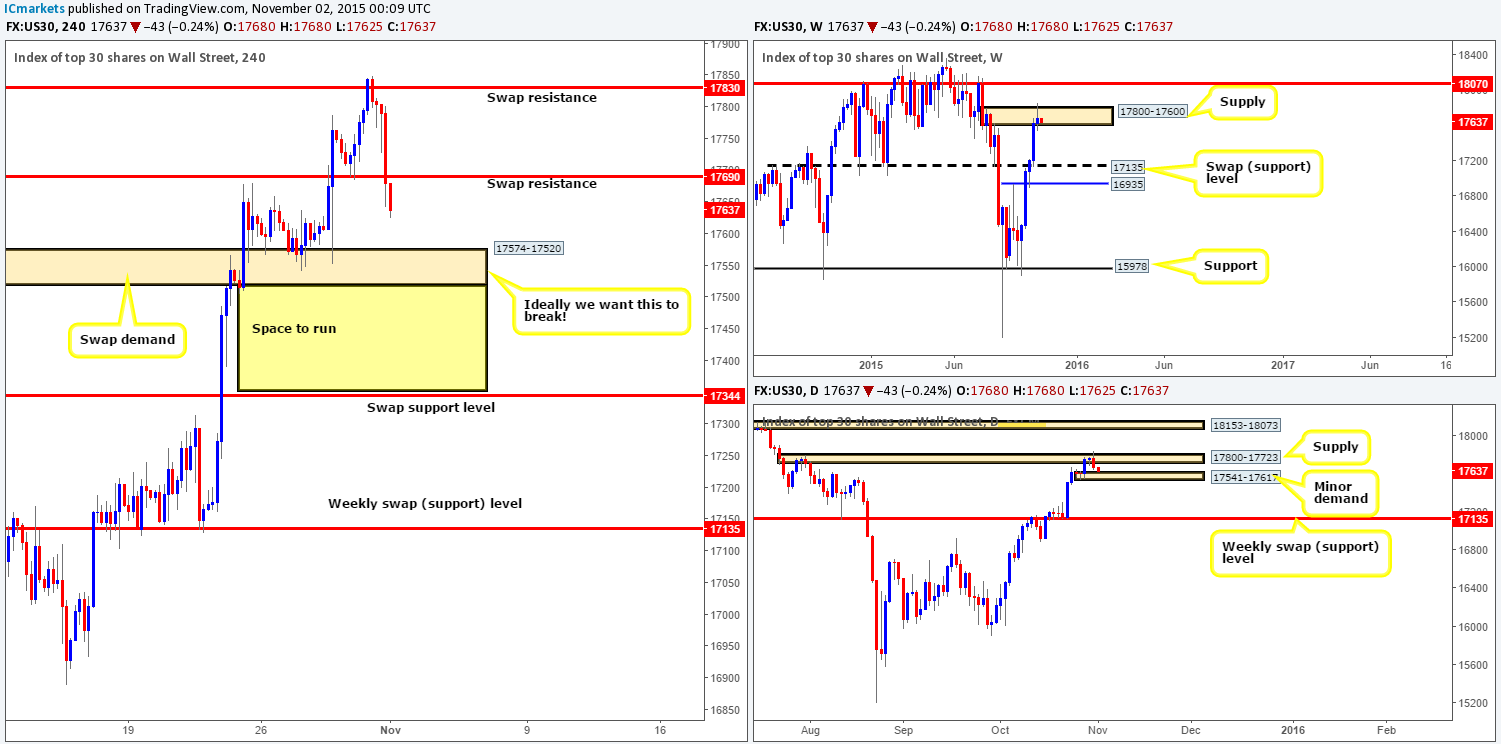
Weekly view: In comparison to the past few weeks, the momentum on the DOW appears to have slowed down last week with a small gain of 52 points being recorded. However, this is not to say that the buyers did not try! Price reached highs of 17849 on the week, piercing above supply at 17800-17600, before selling off and painting a decent-sized selling wick into the close 17680. Assuming that this was genuine selling and not simply traders squaring positions, we potentially could see a further down move all the way to the swap support level coming in at 17135. On the contrary, if this spike above supply was merely to consume sellers to continue trading north, the next objective to reach is 18070.
Weekly levels to watch this week fall in at: 17800-17600/17135/18070.
Daily view: Turning our attention to the daily chart reveals that price (which should be obvious) also spiked above the weekly’s partner supply on the daily timeframe at 17800-17723 last week. However, from this angle, a clear-cut bearish engulfing candle formed at this area into the weekend – anyone for shorts? Personally, we would be cautious selling here due to there being a minor demand base sitting just below current price at 17541-17617. Beyond this barrier, nonetheless, there is room to continue lower down to the aforementioned weekly swap (support) level.
A break above the current supply area is also something to keep an eye on this week, traders, since there is a clear run from here seen up to supply drawn from 18153-18073 (just above the 18070 weekly level).
Daily levels to watch this week fall in at: 17800-17723/ 17541-17617/17135/18153-18073.
4hr view: It was clearly not a good day for anyone long this market on Friday! Shortly after a small break above swap resistance at 17830 (which stopped us out of our position taken from 17527), the floor was removed from the DOW. Swap support (now resistance) at 17690 was taken out, with price reaching lows of 17643 by the day’s end.
So far, the open 17680 has seen a surge of offers come into the market, with room to continue south until a swap demand base drawn from 17574-17520.
Given everything, we are very eager to sell this market, but will not be prepared to risk capital until the 4hr swap demand base mentioned above at 17574-17520 is taken out. Just look at the space below this barrier! A clear run down to at least swap support coming in at 17344!
Levels to watch/ live orders:
-
Buys: Flat (Stop loss: N/A).
-
Sells: Watch for bids to be consumed around 17574-17520 and then look to trade any retest seen at this area (confirmation required).
XAU/USD: (Gold)
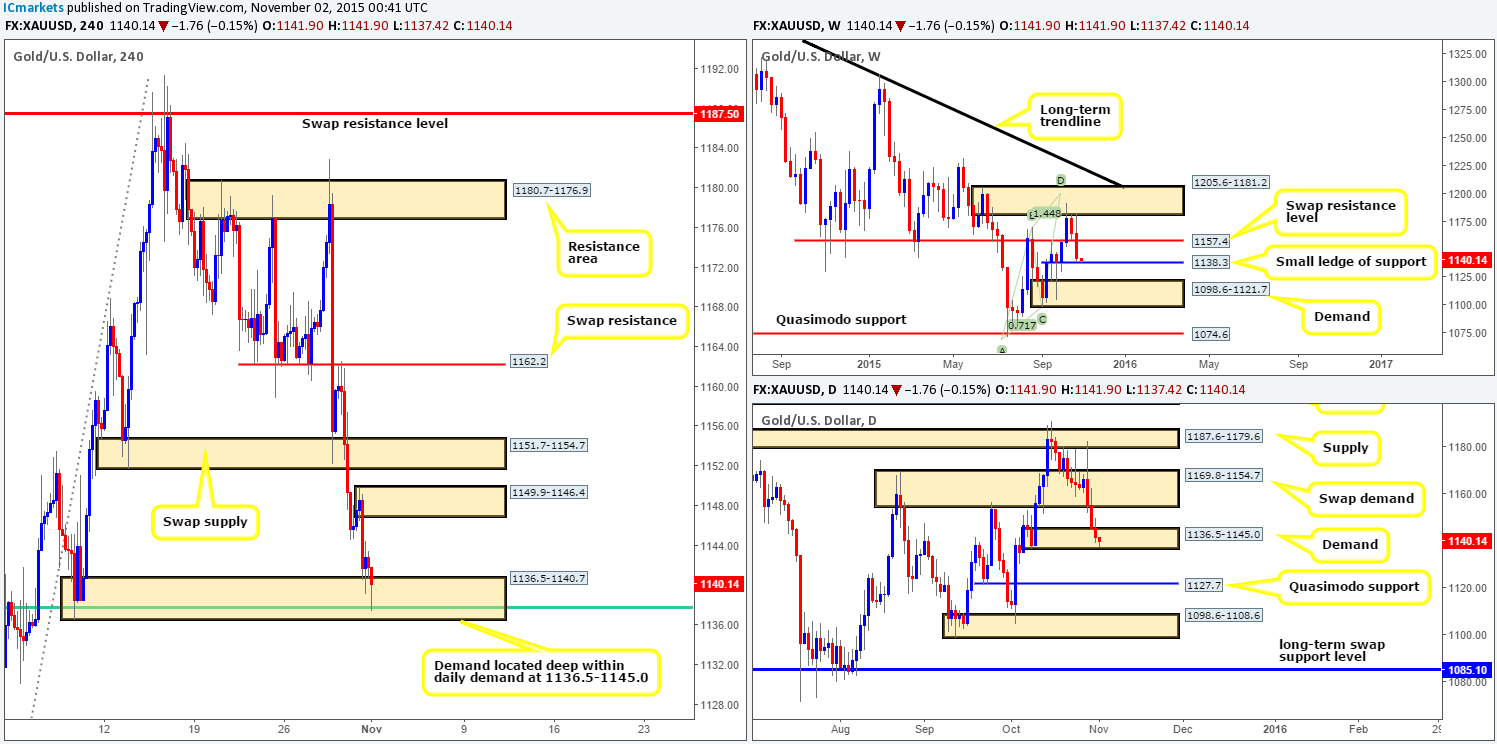
Weekly view: Last week’s action shows that Gold continued to decline in value following a second stab to the underside of supply at 1205.6-1181.2. As a consequence, bids at the swap support (now resistance) level 1157.4 were taken out, and price closed heavily in the red at 1141.9, losing over $22 in value by the week’s end. From here, other than a small ‘ledge’ of support seen around the 1138.3 mark, the pathway south is likely clear for prices to continue lower to demand coming in at 1098.6-1121.7.
Weekly levels to watch this week fall in at: 1205.6-1181.2/1157.4/1138.3/1098.6-1121.7.
Daily view: Last week’s descent took out the swap demand (now supply) area at 1169.8-1154.7 with relative ease, and ended the week with price slam dunking itself into a strong-looking demand at 1136.5-1145.0. Considering there is a minor weekly support (1138.3) lurking within this zone, there is a chance we may see prices advance from here up to at least to 1154.7, the underside of the aforementioned swap supply area this week (notice that the base of this area is positioned very close to the weekly swap [resistance] level at 1157.4, so be extra cautious around this area!).
A breakdown below the current demand on the other hand, would likely stimulate further downside towards Quasimodo support coming in at 1127.7.
Daily levels to watch this week fall in at: 1169.8-1154.7/ 1136.5-1145.0/1127.7.
4hr view: A quick recap of Friday’s movement shows price did indeed continue to fall and connect with demand at 1136.5-1140.7. For those who read Friday’s report (http://www.icmarkets.com/blog/friday-30th-october-daily-technical-outlook-and-review/), you may recall that we placed a pending buy order at 1141.4 just above the aforementioned demand which was filled just before the American open. The reason for having the confidence to place such an order on a Friday came from this area being located deep within daily demand mentioned above at 1136.5-1145.0, and also additional support seen from the 61.8% Fibonacci level at 1137.7.
Thankfully, the open 1141.9 saw very little change to the structure of this market. Given that the current demand area boasts higher timeframe confluence, we’re ultimately targeting the supply seen at 1149.9-1146.4 as our immediate profit target, followed closely by the swap supply zone seen above it at 1151.7-1154.7. At this point, price will be trading close to not only the weekly swap (resistance) level at 1157.4, but also the swap supply zone from the daily chart drawn at 1169.8-1154.7. Therefore, most of our position will be liquidated before reaching this point.
Levels to watch/ live orders:
-
Buys: 1141.4 [LIVE] (Stop loss: 1135.3).
-
Sells: Flat (Stop loss: N/A).