A note on lower timeframe confirming price action…
Waiting for lower timeframe confirmation is our main tool to confirm strength within higher timeframe zones, and has really been the key to our trading success. It takes a little time to understand the subtle nuances, however, as each trade is never the same, but once you master the rhythm so to speak, you will be saved from countless unnecessary losing trades. The following is a list of what we look for:
- A break/retest of supply or demand dependent on which way you’re trading.
- A trendline break/retest.
- Buying/selling tails/wicks – essentially we look for a cluster of very obvious spikes off of lower timeframe support and resistance levels within the higher timeframe zone.
- Candlestick patterns. We tend to only stick with pin bars and engulfing bars as these have proven to be the most effective.
We search for lower timeframe confirmation between the M15 and H1 timeframes, since most of our higher-timeframe areas begin with the H4. Stops are usually placed 5-10 pips beyond confirming structures.
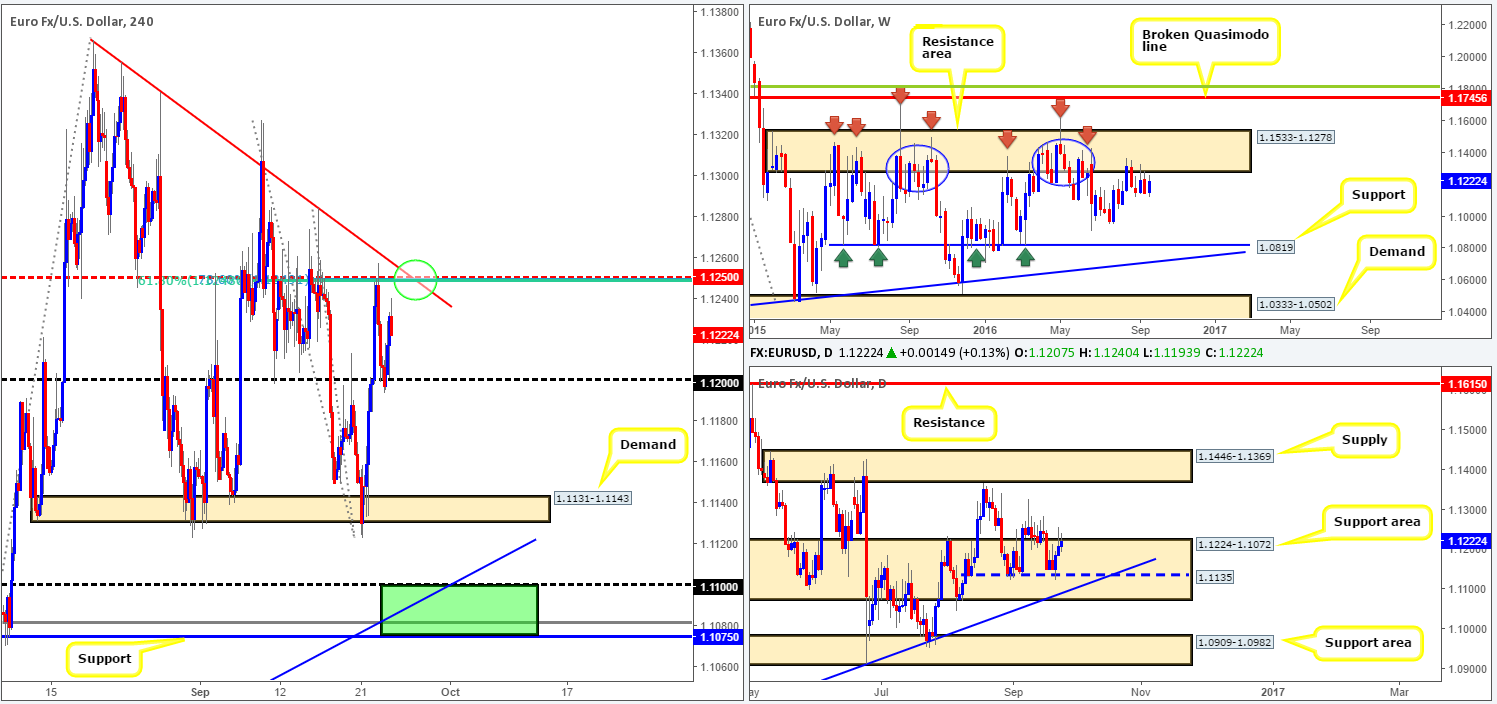
EUR/USD:
Weekly gain/loss: + 73 pips
Weekly closing price: 1.1222
Weekly view: Despite last week’s gains, price remains hugging the underside of a major resistance area seen at 1.1533-1.1278. Although we’re confident that this zone will eventually push the pair lower, it’s difficult to judge when that will be as in the past we’ve seen price consolidate for long periods before descending lower (see blue circles). The next downside targets to have an eyeball on from here can be seen at the 1.0970 region, followed closely by a major support seen at 1.0819.
Daily view: On the other side of the field, nevertheless, daily price was seen relatively well-bid from Wednesday onwards last week from within the support area seen at 1.1224-1.1072, more specifically, a double-bottom base at 1.1135 (now a triple bottom). In the event that a break above the September 15th high at 1.1284 comes into view this week, there’s little active supply seen until the 1.1446-1.1369 region.
H4 view: A quick recap of Friday’s sessions show the shared currency found a pool of bids around the psychological boundary 1.12, rallying to highs of 1.1240, before sporting a small end-of-day correction going into the close.
Direction for the week: As of this point it’s difficult to judge weekly direction given the conflicting signals we’re getting from the higher-timeframe structures (see above).
Direction for today: In spite of the above points, we do not see prices breaching the H4 mid-way resistance 1.1250 today. This is due to it boasting a H4 Fibonacci cluster formation (61.8%/78.6%) taken from the highs 1.1284/1.1327, and also a H4 trendline resistance extended from the high 1.1366 (green circle).
Our suggestions: Look to begin the week hunting for shorts around the 1.1250 mark. This barrier is very likely to produce a bounce lower today given that we are also coming off of a major weekly resistance area. However, as you’re probably already aware, selling 1.1250 puts you in direct fire with the daily candles, so waiting for at least a H4 bearish close to from prior to pulling the trigger might be the best path to take.
Targets for this trade, should it move in favor, are as follows: the 1.12 handle, the H4 demand base seen at 1.1131-1.1143 and finally the H4 support at 1.1075 and the 1.11 band (green zone). Not only is 1.1075/1.11 a good take-profit area for any shorts in this market, it’s also a fantastic barrier to look for longs. It sits within the depths of the aforementioned daily support area, as well as merging with both the daily trendline support taken from the low 1.0516/ H4 trendline support extended from the low 1.0951 and a deep H4 88.6% Fib support at 1.1081. Although this H4 buy zone will very likely bounce price, do take into account that by entering long from here you’re effectively buying into weekly flow.
In addition to the above guys, do keep in mind that German ifo data is scheduled to be released at 8am along with ECD President Draghi taking the stage at 2pm (GMT). Therefore, technicals could take a backseat during this time.
Levels to watch/live orders:
- Buys: 1.1075/1.11 [strong-looking buy zone which could, dependent on the time of day and approach, be sufficient enough to condone an entry without waiting for lower timeframe confirmation] (Stop loss: 1.1060).
- Sells: 1.1250 region [H4 bearish close required] (Stop loss: beyond the trigger candle).
GBP/USD:
Weekly gain/loss: – 38 pips
Weekly closing price: 1.2957
Weekly view: Last week’s session printed the GBP’s third consecutive losing week, consequently bringing price down into the jaws of a support level coming in at 1.2942. To our way of seeing things from here at the moment, even though this support barrier held prices higher back in mid-August, it failed to reach new highs. This – coupled with the pair currently being entrenched within a rather prominent downtrend, we could see this level taken out this week.
Daily view: Since price peaked at 1.3445 earlier in the month, we have seen a succession of offers flood the market, with very little bullish interest being seen. Current structure shows prices failed to close above the resistance area at 1.3064-1.3104, before pummeling lower on Friday and wiping out any gains the market had accrued in the week. As price is now seen kissing the topside of a demand base at 1.2789-1.2928 that converges with a trendline support taken from the low 1.2789, we should see prices stabilize here. A close beyond the above said trendline support, however, could be an early sign that weekly support is failing and the current daily demand is likely to be taken out sometime soon.
H4 view: Followin comments made by UK foreign minister Boris Johnson on Friday, the pound fell sharply against its US counterpart. As a result, the key figure 1.30 was wiped out along with prices attacking Wednesday’s low 1.2945 into the close.
Direction for the week: On the whole, we feel the unit will print a lower close going into the week’s end. However, this is merely a rough finger-in-the-wind assessment since there are still higher-timeframe supports in play at this time (see above).
Direction for today: Levels to watch today are 1.30 and 1.29. 1.30 simply because there are likely unfilled sell orders still lurking around this region from Friday’s aggressive break, and 1.29 because it is not only a psychological boundary but it is also a H4 Quasimodo support.
Our suggestions: Seeing as we are unsure of higher-timeframe direction at present, we’ll be looking to play for intraday bounces off of 1.30 and 1.29 today. However, in that fakeouts are common around fixed levels such as these, we would recommend waiting for lower timeframe price action to confirm there’s interest residing here before placing capital on the line (see the top of this report for lower timeframe confirming entry techniques).

Levels to watch/live orders:
- Buys: 1.29 region [lower timeframe confirmation required] (Stop loss: dependent on where one confirms this area).
- Sells: 1.30 region [lower timeframe confirmation required] (Stop loss: dependent on where one confirms this area).
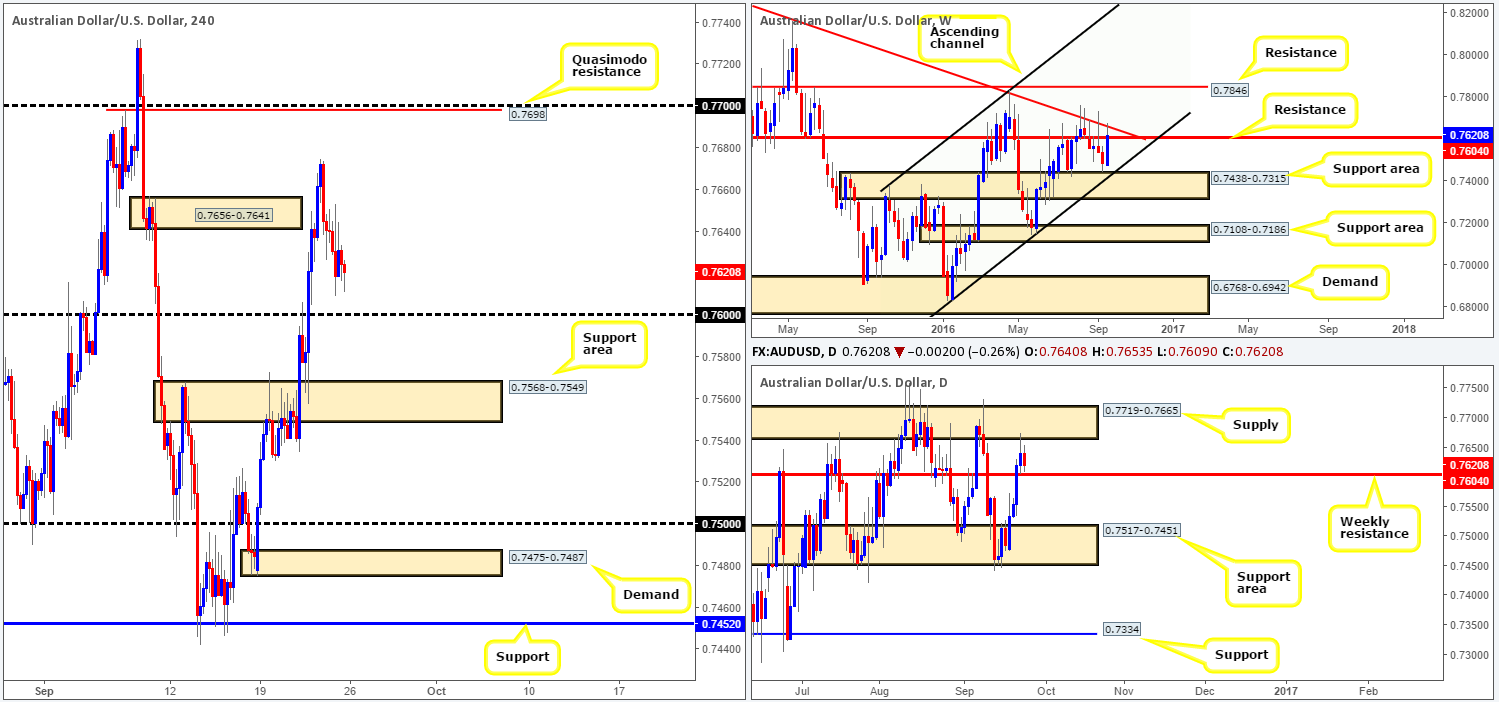
AUD/USD:
Weekly gain/loss: +136 pips
Weekly closing price: 0.7620
Weekly view: After a rather aggressive move north seen last week, prices settled just above resistance coming in at 0.7604, following a rebound off of trendline resistance taken from the high 0.8295. Although price has effectively closed above the aforementioned resistance barrier, we feel a more decisive close is required before one can say that this level is consumed. In the event that we see the sellers retaliate this week, the next downside target for us would be the channel support line taken from the low 0.6827. Conversely, a continuation move north from here would need to take out offers around the trendline resistance before being able to play for the resistance level at 0.7846.
Daily view: Thursday’s rebound from the underside of supply seen at 0.7719-0.7665, followed by Friday’s extension lower placed prices just ahead of the above noted weekly resistance level. As we already mentioned, we are not yet discounting this weekly level as resistance, but if daily prices find support above this line during the week, we may see higher prices eventually come into view.
H4 view: On the H4 chart, we can see that Friday’s action sold off following Thursday’s breach of H4 supply at 0.7656-0.7641 down to lows of 0.7609 on the day, clearly helped by the aforementioned daily supply zone.
Direction for the week: This is a rather tricky beast to judge at the moment, as we’re unsure in regard to the weekly resistance level mentioned above. As such, higher-timeframe direction, at least in our view, is rather limited for the time being.
Direction for today: Again, this unfortunately depends on how prices behave around the weekly resistance level today.
Our suggestions: On account of the above points, here is what we have logged going forward…
- Watch for a decisive close below the 0.76 handle (represents the weekly resistance level). Supposing that the H4 candles maintain a bearish tone beyond this number, we may start thinking about considering shorts down to the H4 support area at 0.7568-0.7549, followed by the 0.75 hurdle.
- If 0.76 holds as support, nonetheless, we will not be comfortable buying above here until we’ve seen a more decisive weekly close higher. With that being the case, the only resistance we see worthy of consideration above this number is 0.7698: a H4 Quasimodo resistance barrier, which unties beautifully with the 0.77 handle. Given the confluence seen here and the higher-timeframe structures surrounding this zone, we feel a pending sell order is viable, with stops placed above the apex of this formation at 0.7735.
Levels to watch/live orders:
- Buys: Flat (Stop loss: N/A).
- Sells: 0.7697 [pending order] (Stop loss: 0.7735).
USD/JPY:
Weekly gain/loss: – 126 pips
Weekly closing price: 100.98
Weekly view: The past week’s performance has, as you can see, placed the USD/JPY back around the support level penciled in at 100.61. This is the pair’s third consecutive losing week. On the assumption that further selling is seen from here, the next area to watch beyond current support is a demand base drawn from 96.56-98.59. On the other hand, a rotation from the support level this week has, at least in our view, the potential to drag prices back up to the resistance area seen at 105.19-107.54.
Daily view: The story on the daily chart, nevertheless, shows that the unit rebounded beautifully from the topside of demand chiseled in at 99.53-100.23. From this timeframe, we see very little stopping prices from reaching the resistance area coming in at 103.50-103.89. Take note of, what we believe to be, the supply consumption wicks seen marked with red arrows at 102.78 and 103.35.
H4 view: During last week’s sessions, our team made a call to buy from the 100.00/100.21 range (green zone). This worked out to be a fantastic buy zone so well done to any of our readers who managed to lock down a position from here! Adding to this, we can see prices went a step further early on in Friday’s sessions and closed above H4 resistance seen at 100.82, and ended the week retesting this boundary as support.
Direction for the week: Despite the weekly trend clearly pointing in a southerly direction right now, our team believes there is upside potential still left in this market to at least the daily resistance area mentioned above at 103.50-103.89. This is mainly due to recent movement on the H4 retesting 100.82 as support!
Direction for today: With the most recently closed H4 candle looking as though it consumed the majority of supply to the left, further buying is highly possible up to at least the H4 resistance area at 101.41-101.62/102 handle.
Our suggestions: Taking the above points into consideration, our team will be looking for price to retest the H4 support 100.82 for a second time today and hold. Should this come into view and we see a reasonably sized H4 bull candle take shape, we would look to buy the dollar, targeting the above said H4 resistances in bold.
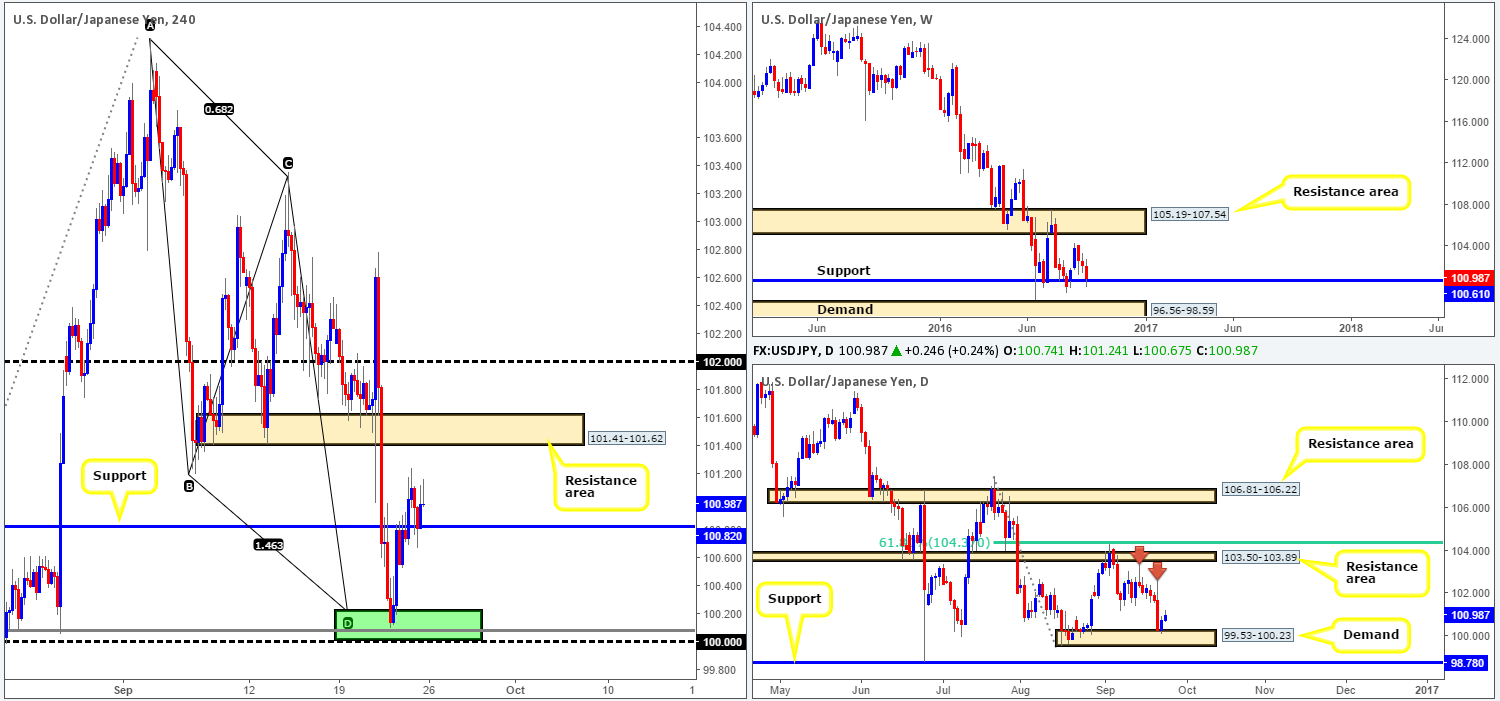
Levels to watch/live orders:
- Buys: 100.82 region [H4 bullish close required] (Stop loss: beyond the trigger candle).
- Sells: Flat (Stop loss: N/A).
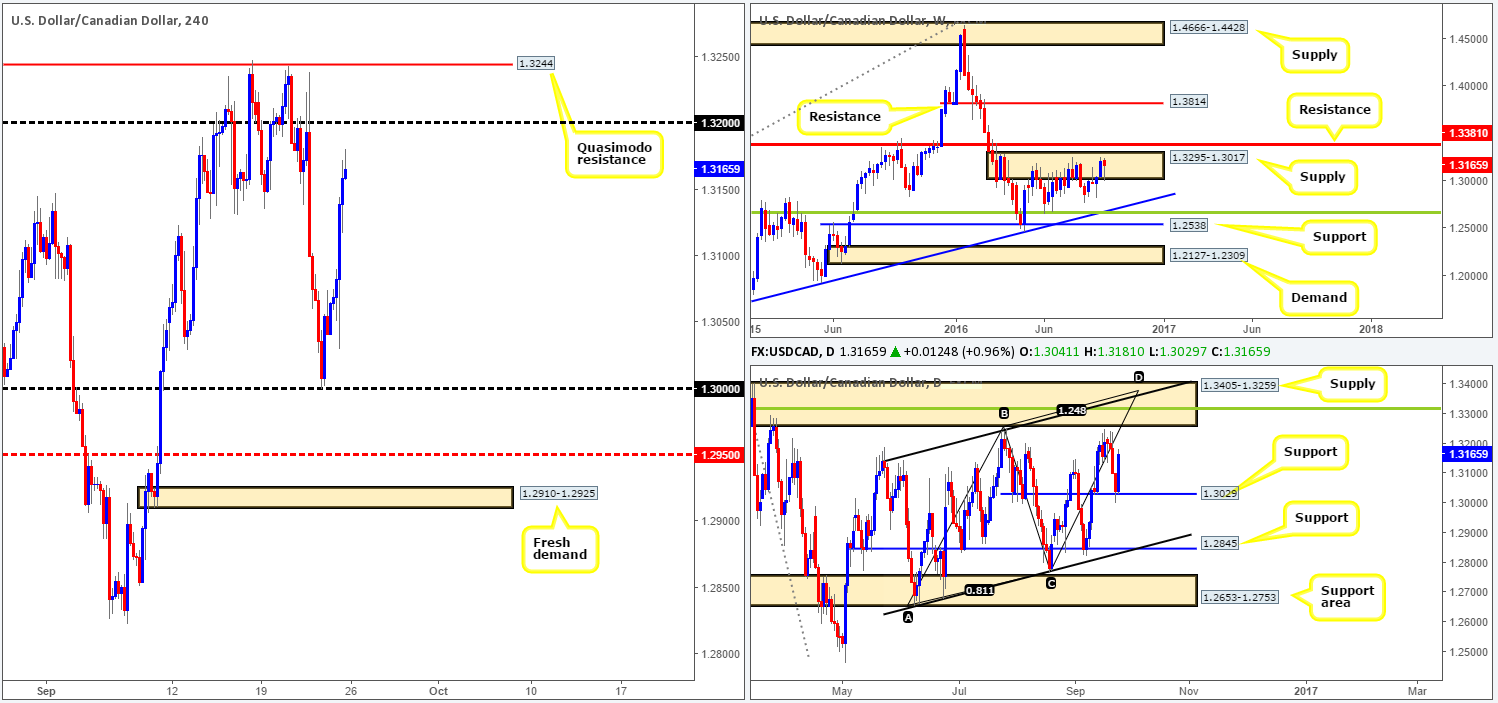
USD/CAD:
Weekly gain/loss: – 42 pips
Weekly closing price: 1.3165
Weekly view: Things are not looking too bright for any sellers positioned within the supply zone fixed at 1.3295-1.3017 right now. Although the bears do still have a hand in this fight, offers slowly appear to be diminishing. However, it won’t be until we see a decisive close beyond the resistance level located directly above this zone at 1.3381, will we feel the buyers really have a good handle on things here.
Daily view: Looking at the daily chart, the pair found a pocket of bids around a minor level of support registered at 1.3029 towards the end of last week. Other than minor supply seen at 1.3248-1.3201, we don’t see anything stopping the pair advancing up to supply seen at 1.3405-1.3259. Also worthy of consideration here is the daily convergence point located within this barrier: a 38.2% Fib resistance level at 1.3315 (green line), the weekly resistance level at 1.3381, a channel resistance taken from the high 1.3241 and an AB=CD completion point around the 1.3376ish range.
H4 view: The Canadian dollar came under pressure on Friday, following a string of lower than expected data. This propelled the US dollar to highs of 1.3181 by the day’s end, leaving the upside looking favorable towards the 1.32 handle, followed closely by the Quasimodo resistance level at 1.3244.
Direction for the week: In light of the recent reaction seen from within the current weekly supply, and daily action showing a reasonably clear path north this week, further upside may be on the cards, at least until prices crosses paths with the above said daily supply.
Direction for today: Well, we believe 1.32 is likely to get tagged early on in today’s sessions. Be that as it may, the H4 Quasimodo level seen above it at 1.3244 was clearly the more attractive barrier over the past week or so, therefore, we’re expecting price to eventually squeeze shorts from 1.32 and go on to attack the Quasimodo.
Our suggestions: Despite how well price responded to the above said H4 Quasimodo level recently, however, our team is not really looking to sell from here, since there is a good chance of price faking above this level to tag in offers around the daily supply area mentioned above at 1.3405-1.3259. With that being said, If price reaches the 1.3310/15 region within the current daily area we’d have no hesitation (apart from if high-impacting news is scheduled for release) in shorting here at market with stops placed above the daily supply zone at 1.3407.
On the data front today guys, we have the BoC Gov. Poloz speaking later on at 11.10pm GMT, which is likely to stir things up in this market. As such, you may want to hold fire on any technical setups you see during this time.
Levels to watch/live orders
- Buys: Flat (Stop loss: N/A).
- Sells: 1.3310/15 region [potential area to look for shorts at market] (Stop loss: 1.3407).
USD/CHF:
Weekly gain/loss: – 102 pips
Weekly closing price: 0.9697
Weekly view: Since the beginning of May, the USD/CHF pair has been consolidating between a supply zone painted at 1.0092-0.9928 and a support band drawn from 0.9581. In spite of last week’s decline which chalked up a bearish engulfing candle, we feel it’s unlikely that price will breach the lower walls of this range this week.
Daily view: Zooming in and looking at the daily picture, nonetheless, price is currently positioned within a support area carved from 0.9648-0.9708. Of particular interest here is the most recently closed daily candle: it’s what candlestick traders would call an inverted pin bar, which is, if we’re not mistaken, considered a buy signal. Should buyers fail to follow through here, nevertheless, the next barrier of interest beyond this zone can be seen at 0.9541: a support level. Meanwhile, a break to the upside from the current base could see prices challenge supply coming in at 0.9818-0.9793.
H4 view: A brief look at recent dealings on the H4 shows that price aggressively walloped its way through both the 0.97 handle and a resistance area at 0.9706-0.9721, and went on to tag a trendline resistance extended from the low 0.9537, before closing the day back below 0.97.
Direction for the week: In view of the weekly bearish engulfing candle, we feel this market is headed down to touch gloves with the weekly support level seen at 0.9541, despite daily price currently housed within a support area.
Direction for today: Assuming that the sellers continue to defend the 0.97 boundary, the H4 support at 0.9648 (also represents the lower edge of the above said daily support area) will likely see action today.
Our suggestions: Watch for a reasonably sized H4 bearish close to form around 0.97 today. Should this come to fruition, traders may look to short from here, targeting the above noted H4 support boundary as a first take-profit zone. Our only concern here is that our team is also looking to short on the EUR/USD pair (see above): an inversely correlated market to the USD/CHF, as well as we have the SnB Chairman Jordan taking the stage at 9.30am GMT today. Therefore, do remain careful here guys!
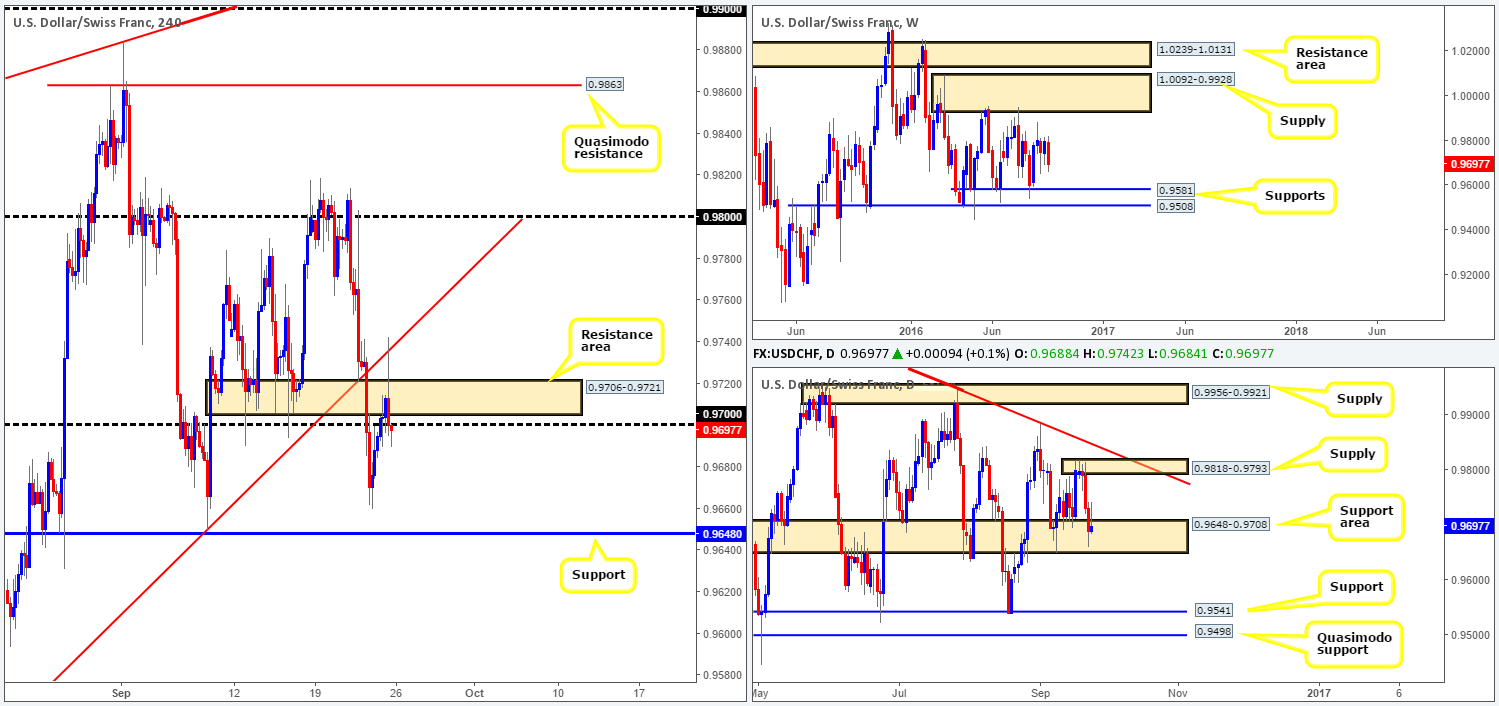
Levels to watch/live orders:
- Buys: Flat (Stop loss: N/A).
- Sells: 0.97 region [H4 bearish close required] (Stop loss: beyond the trigger candle).
DOW 30:
Weekly gain/loss: + 142 points
Weekly closing price: 18278
Weekly view: US stocks rallied for a second consecutive week last week, reaching highs of 18450. In spite of this, we can see that buyers failed to close above the resistance area formed from 18365-18158. With that said, there’s still a chance that this index could selloff from here and tag the support area seen at 17446-17606.
Daily view: The situation on the daily chart shows price action recently printed a two-candle whipsaw through resistance given at 18322. This could lead to further selling this week down to the trendline support taken from the low 15501, followed closely by the broken Quasimodo line at 18018.
H4 view: Going into Friday’s US session, prices extended Thursday’s bounce from supply at 18466-18447, consequently breaking through a support area at 18321-18349 and testing the 18215-18256 region (another support area) by the week’s end.
Direction for the week: Given the close back below the daily level 18322 along with weekly price remaining firm within the current weekly resistance area, we feel lower prices are likely to be seen this week at least until we get to the aforementioned daily trendline support.
Direction for today: While higher-timeframe action suggests that the current H4 support area will be taken out, there is a good chance that we may see prices consolidate here today, or even slightly reverse as traders look to cover shorts here.
Our suggestions: Personally, we would not feel comfortable placing money on the line around the current H4 support area, even if it does blend nicely with a H4 trendline support from the high 18248. In that case, would our team encourage sells beyond this zone? We would, if prices not only take out the current H4 support area, but also the H4 trendline support extended from the low 18066, since the path below here on the H4 looks relatively clear down to the H4 Quasimodo support at 18023 (sits just above the aforementioned daily broken Quasimodo line).
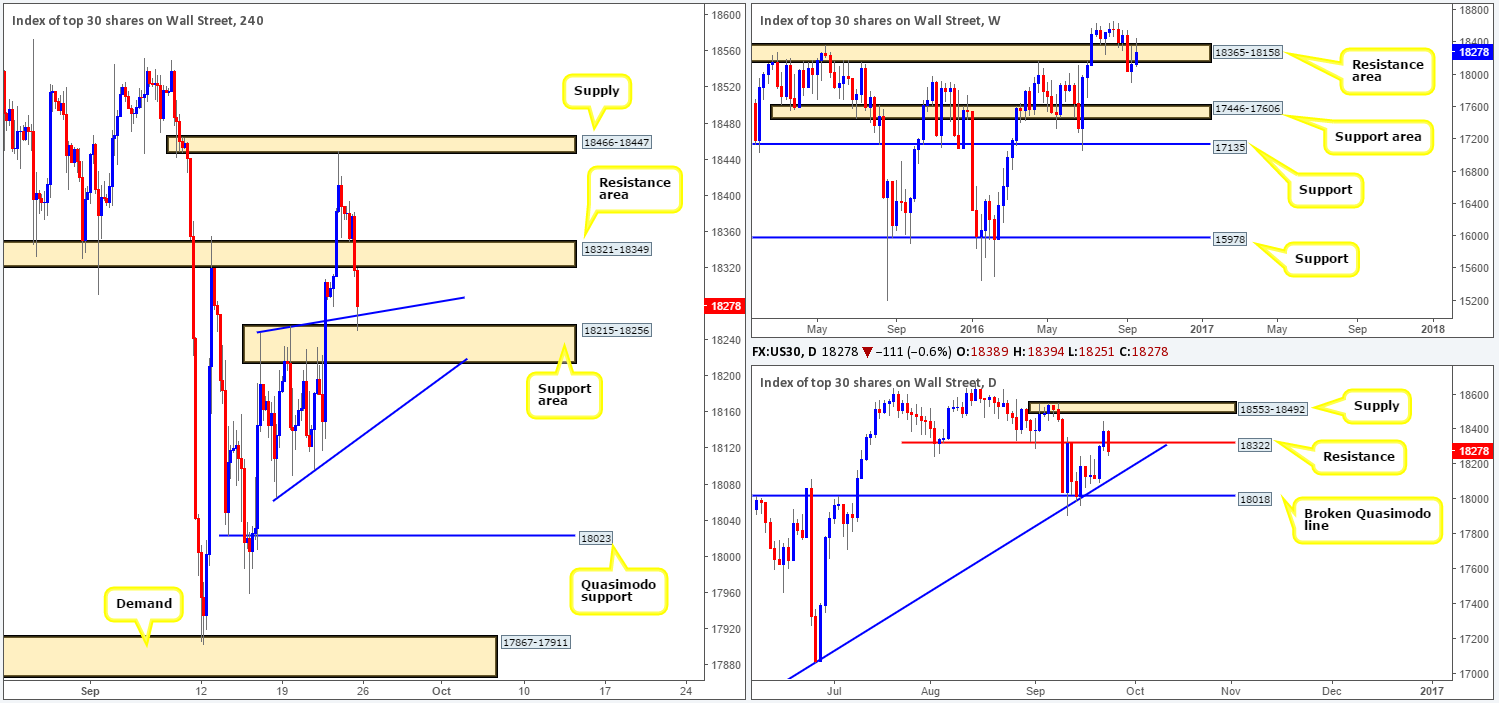
Levels to watch/live orders:
- Buys: Flat (Stop loss: N/A).
- Sells: To become sellers in this market we’d need to see a H4 close beyond the H4 trendline swap taken from the low 18066.
GOLD:
Weekly gain/loss: + $26.3
Weekly closing price: 1336.0
Weekly view: The yellow metal corrected sharply higher from the support area seen at 1307.4-1280.0 last week, erasing the prior week’s losses and reaching highs of 1343.5. As far as we are concerned, there is little resistance seen to the left of current price on this timeframe to stop further buying coming into the market this week up to a Quasimodo resistance level drawn in at 1361.7.
Daily view: In light of the rebound seen from demand at 1305.3-1322.8 on Wednesday, gold seems all set to extend further north this week up to at least the trendline resistance extended from the high 1375.0, and with a little bit of luck, the resistance planted at 1354.6.
H4 view: With sellers more than likely consumed at the supply zone seen at 1339.4-1337.0, the runway above this zone appears clear up to supply coming in at 1349.2-1345.8.
Direction for the week: The direction for the week is almost certainly going to be north. That is, at least until prices collide with the above said daily trendline resistance.
Direction for today: While prices on the H4 may consolidate a while longer, further buying will likely be seen up to the aforementioned H4 supply.
Our suggestions: Since we know that both the weekly and daily charts show promise to the upside, and stops are more than likely taken out from the above said H4 supply zone, we feel longs from the H4 demand at 1331.8-1329.6 could be something to consider. We would, however, recommend waiting for at least a H4 bullish candle close to form prior to pulling the trigger, since a fakeout through this zone is possible. In regard to targets, we really only have one in mind here and that is the H4 supply zone drawn from 1349.2-1345.8, as it unties beautifully with the aforementioned daily trendline resistance.
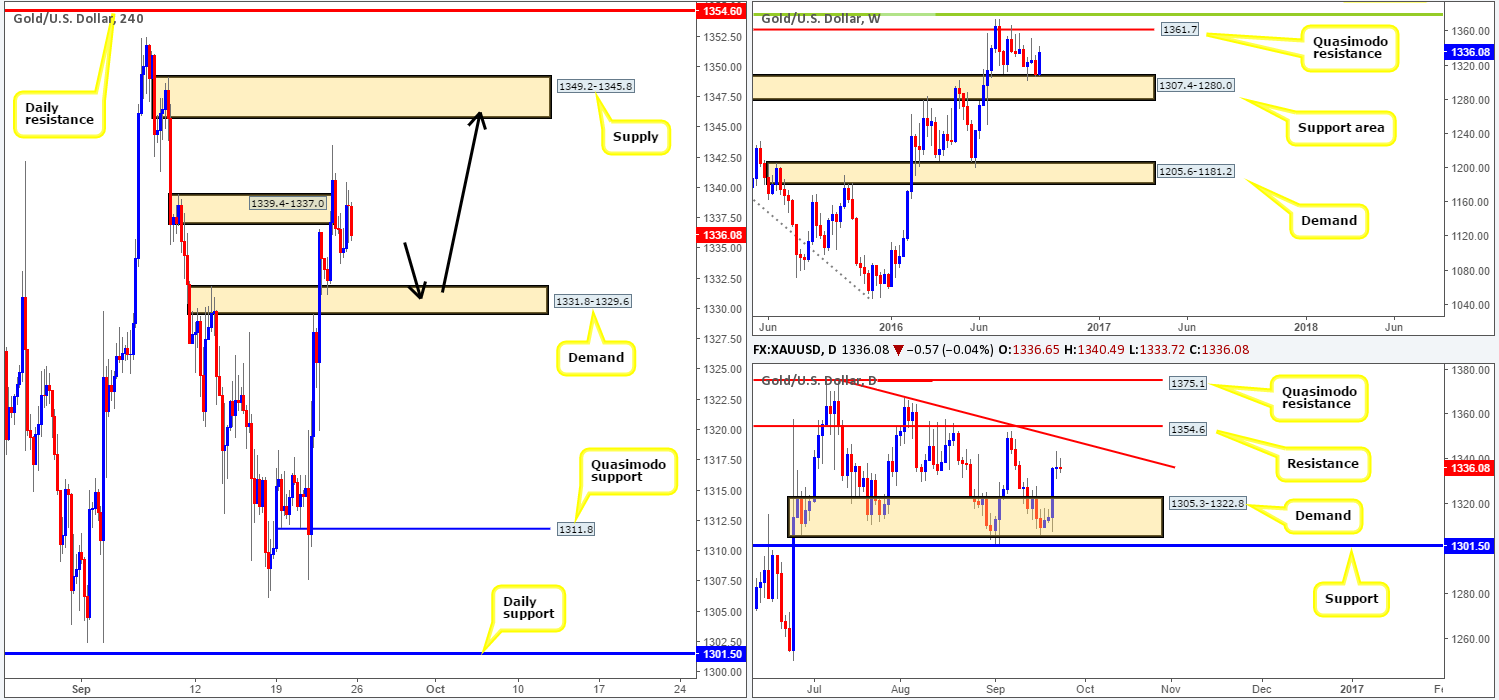
Levels to watch/live orders:
- Buys: 1331.8-1329.6 [H4 bullish close required] (Stop loss: beyond the trigger candle).
- Sells: Flat (Stop loss: N/A).


