EUR/USD:
Weekly gain/loss: +0.51%
Weekly closing price: 1.2353
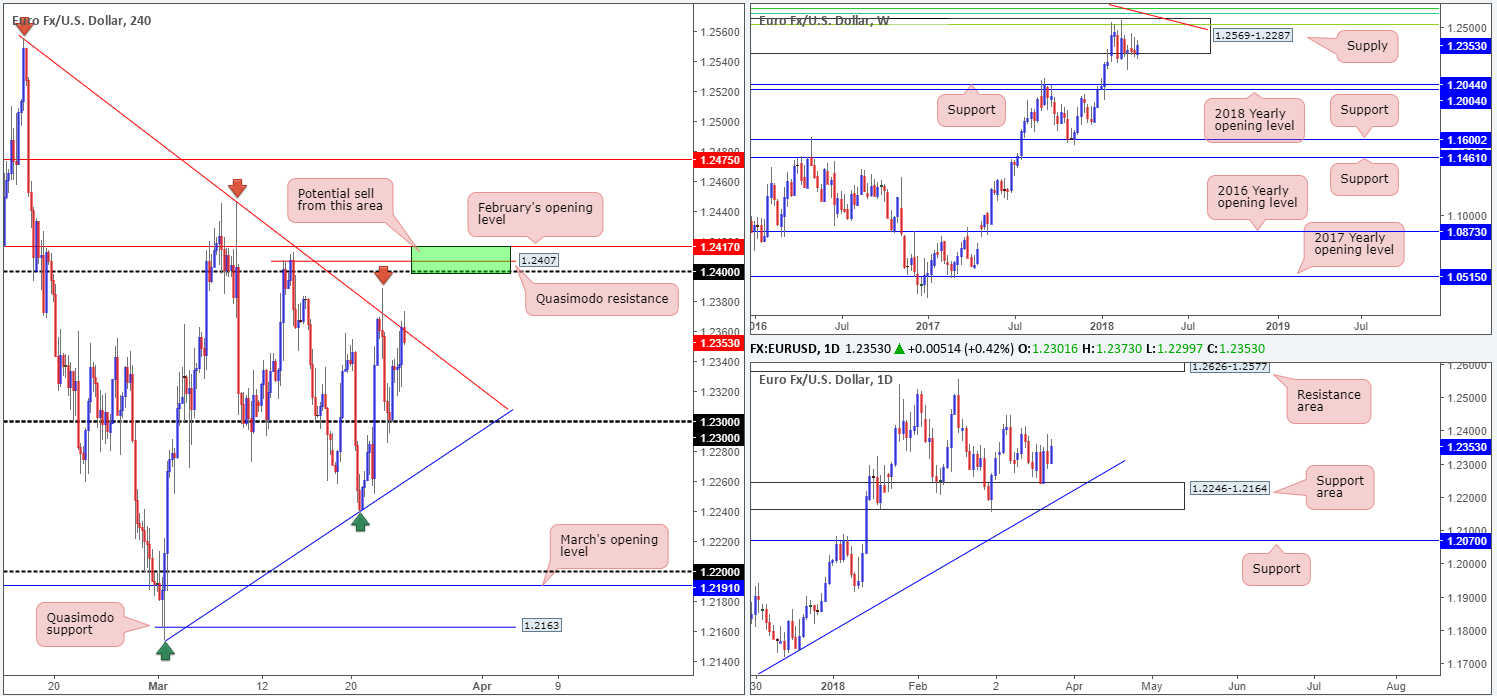
Since late January, the buyers and sellers on the weekly timeframe have been competing for position within the walls of a major-league weekly supply zone at 1.2569-1.2287. In the event that the sellers gain consciousness here, we could see the unit potentially shake hands with a weekly support level coming in at 1.2044, which is shadowed closely by the 2018 yearly opening level at 1.2004.
Capping downside since late January, however, is a daily support area seen at 1.2246-1.2164 that intersects nicely with a long-term daily trendline support (extended from the low 1.0569). The next support target beyond these daily structures can be seen at a daily support level drawn from 1.2070, which, as you can see, is positioned just north of the noted weekly supports.
A quick recap of Friday’s movement on the H4 timeframe shows that the EUR/USD failed to benefit from the better-than-expected US core durable goods orders print. The major reclaimed Thursday’s losses and reconnected with a familiar H4 trendline resistance (taken from the high 1.2555) going into the closing bell. A violation of this line could set the stage for a move up to 1.24, followed closely by a H4 Quasimodo resistance at 1.2407 and then February’s opening level at 1.2417. Follow-through selling off of Friday’s closing candle, on the other hand, has the 1.23 boundary to target, and then quite possibly a H4 trendline support (etched from the low 1.2154).
Potential trading zones:
Given the lack of additional confirmation surrounding the current H4 trendline resistance, entering into a short here is not something our team would label high probability. The 1.2417/1.24 area highlighted in green just above, however, is attractive for a possible short (Feb’s open level, H4 Quasimodo resistance and the 1.24 handle). We really like how closely knit these levels are. For aggressive traders, stops are likely best placed a few pips above 1.2417. Conservative traders, nonetheless, may want to wait for a full or near-full-bodied H4 bearish candle to form before pulling the trigger. Yes, this may get you in at a slightly less favorable position, but you’ll have the benefit of knowing that active sellers are/were present.
Data points to consider today: German Buba president Weidmann speech; FOMC members Dudley, Mester and Quarles also take to the stage.
Areas worthy of attention:
Supports: 1.23; H4 trendline support; 1.2246-1.2164; daily trendline support; 1.2044/1.2004.
Resistances: H4 trendline resistance; 1.2417/1.24; 1.2569-1.2287.
GBP/USD:
Weekly gain/loss: +1.36%
Weekly closing price: 1.4131
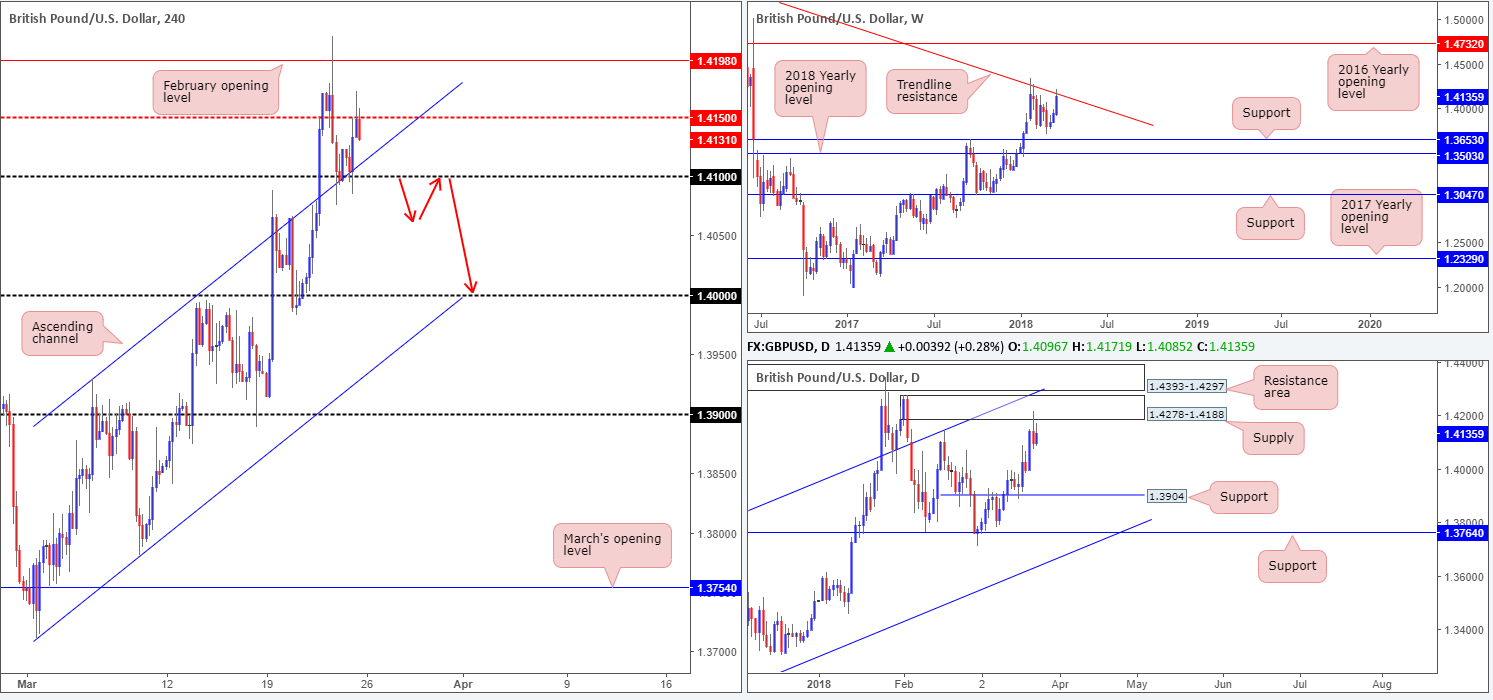
Over the course of last week’s session, the British pound chalked up its third consecutive weekly bullish candle. As is evident from the weekly timeframe, this latest move brought the unit up to a long-term weekly trendline resistance (taken from the high 1.5930). Therefore, traders may want to pencil in a potential pullback this week.
In conjunction with weekly structure, we can also see that daily price crossed swords with a reasonably strong daily supply zone coming in at 1.4278-1.4188. This area – coupled with the intersecting weekly trendline resistance – will likely be a challenging barrier to overcome this week, and therefore lower prices could be on the cards. The next notable area to keep an eye on can be seen at 1.3904: a daily support.
Across on the H4 timeframe, the 1.41 handle and its intersecting H4 channel resistance-turned support (taken from the high 1.3929) held firm as support on Friday. It wasn’t until the unit secured highs of 1.4171 did we see the pair mildly pare gains and close (in the shape of a near-full-bodied H4 bearish candle) back beneath the H4 mid-way point 1.4150.
Potential trading zones:
While both weekly and daily price portend a selloff, you may want to think about waiting for the 1.41 line to be taken out before you pull the trigger. This has proven to be a support of note, and a decisive breach here would be considered a strong bearish cue, in our opinion.
To take advantage of downside beyond 1.41, we would strongly recommend waiting for H4 price to retest the number as resistance, preferably in the shape of a full or near-full-bodied H4 bearish candle (as per the red arrows). The first take-profit target beyond here can be seen at 1.40, possibly followed by daily support at 1.3904.
Data points to consider today: FOMC members Dudley, Mester and Quarles take to the stage.
Areas worthy of attention:
Supports: 1.41; H4 channel support; 1.40; 1.3904.
Resistances: weekly trendline resistance; 1.2478-1.4188; 1.4150.
AUD/USD:
Weekly gain/loss: -0.22%
Weekly closing price: 0.7695
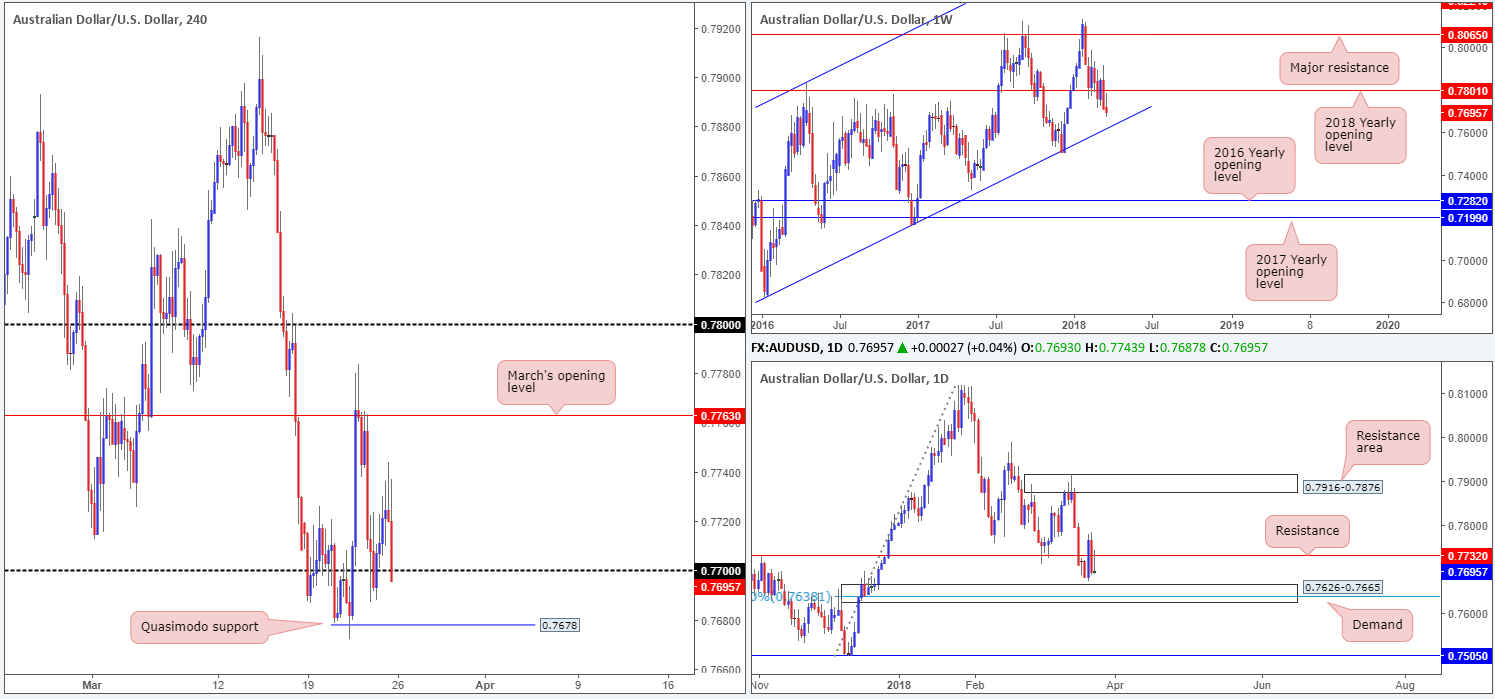
Following a strong weekly close beneath the 2018 yearly opening level seen on the weekly timeframe at 0.7801, the Australian dollar nudged marginally lower last week. From a technical perspective, this has decisively positioned the pair within striking distance of a long-term weekly channel support (taken from the low 0.6827).
Daily resistance at 0.7732, despite experiencing a rather aggressive whipsaw on Wednesday/Thursday, held its own last week. This places the nearby daily demand at 0.7626-0.7665 in the spotlight this week. Not only does the area house a 78.6% daily Fib support at 0.7638, the aforementioned weekly channel support appears to intersect with the lower edge of the zone.
A brief look at recent dealings on the H4 timeframe shows that the commodity currency was little changed on Friday, despite ranging nearly 60 pips. The day did end, however, with H4 price penciling in a full-bodied H4 bearish candle that closed just south of the 0.77 handle. The next port of call beneath here falls in at 0.7678: a H4 Quasimodo support level, and then a H4 mid-level support at 0.7650.
Potential trading zones:
In a similar fashion to Friday’s report, we still favor the 78.6% daily Fib support/H4 mid-way support mentioned above for a medium-term bounce. Not only are these levels positioned within a daily demand, they also benefit from intersecting with the aforementioned weekly channel support! Stop-loss orders, technically speaking, would be best positioned a few pips beneath the said daily demand base, with the first medium-term take-profit target set at the daily resistance underscored above at 0.7732.
Data points to consider today: FOMC members Dudley, Mester and Quarles take to the stage.
Areas worthy of attention:
Supports: 0.7678; 0.7650; 0.7626-0.7665; 0.7638; weekly channel support.
Resistances: 0.77; 0.7732.
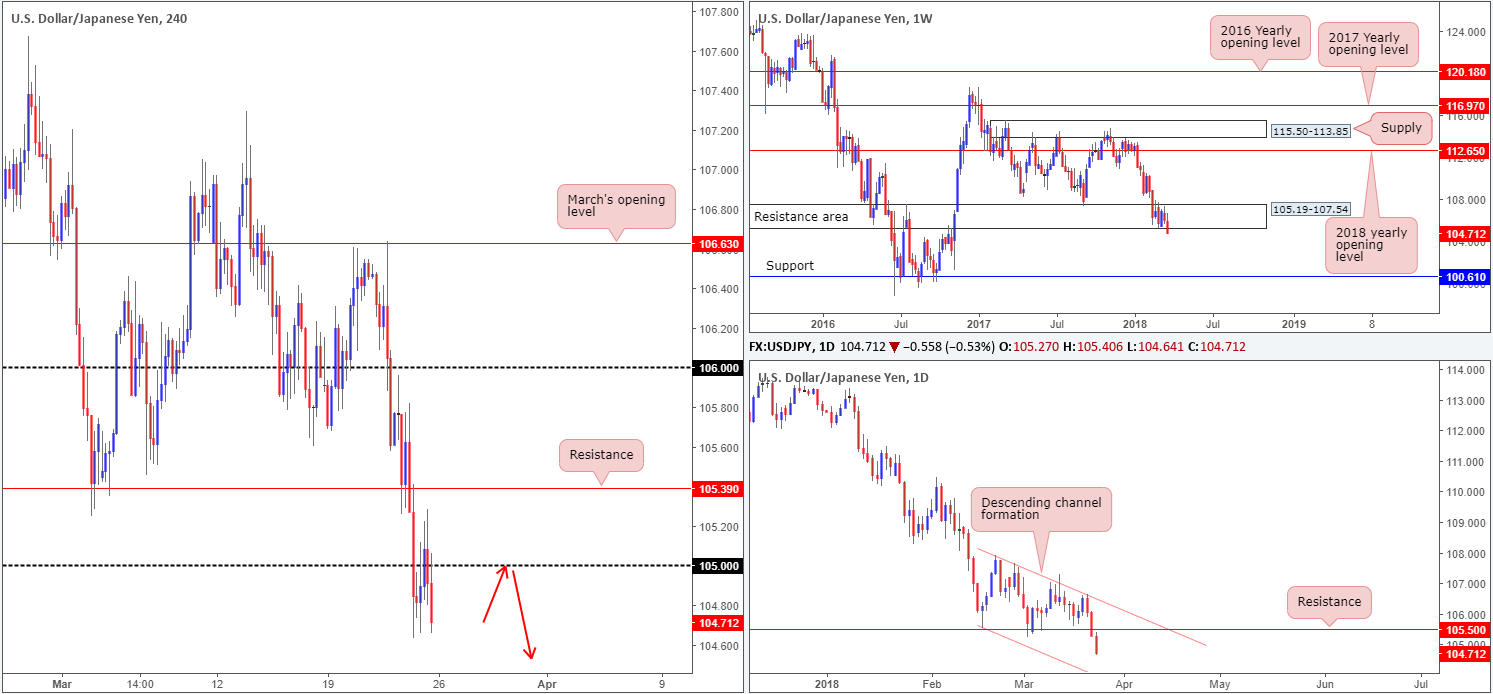
USD/JPY:
Weekly gain/loss: -1.21%
Weekly closing price: 104.71
Last week’s sharp run to the downside forced weekly price beyond the lower edge of a weekly support area coming in at 105.19-107.54 (now acting resistance area). Through the lens of a technical trader, the pendulum certainly appears to be swinging in a southerly direction at the moment. The next downside target on the weekly scale does not come into view until we reach weekly support plotted at 100.61.
After tapping a daily channel resistance (extended from the high 107.90) on Wednesday last week, the pair, in the shape of three back-to-back near-full-bodied daily bearish candles, crunched its way through a daily support level at 105.50 (now acting resistance). At this stage, we do not see a whole lot stopping the USD/JPY from pressing as far south as the daily channel support (taken from the low 105.55), followed by a daily Quasimodo support level at 103.16 (not seen on the screen).
Moving across to the H4 timeframe, we can see that the H4 candles attempted to retake the 105 handle on Friday but failed to sustain gains beyond 105.28, before collapsing lower into the close. To the downside, the next support target can be seen around the 104 handle (not seen on the screen).The failed attempt to pop higher should not really come as much of a surprise. Risk sentiment has been notably damaged this week on escalating trade wars between the US and China. President Trump announced tariffs OF USD 50bln against China over intellectual property theft. In retaliation to this, China announced tariffs on USD 3bln of US imports.
Potential trading zones:
With risk sentiment feeling the strain, and all three timeframes indicating further downside could be in store, buying this market would be a very risky play indeed!
Ultimately, all eyes will likely be on the 105 level today for a potential retest play, targeting 104 and then quite possibly the aforementioned daily channel support.
A retest of 105 that’s followed up with a full or near-full-bodied H4 bearish candle is, at least in our view, sufficient evidence to suggest a short play this week.
Data points to consider today: FOMC members Dudley, Mester and Quarles take to the stage.
Areas worthy of attention:
Supports: 104; daily channel support; 103.16; 100.61.
Resistances: 105; 105.39; 105.50; 105.19-107.54.
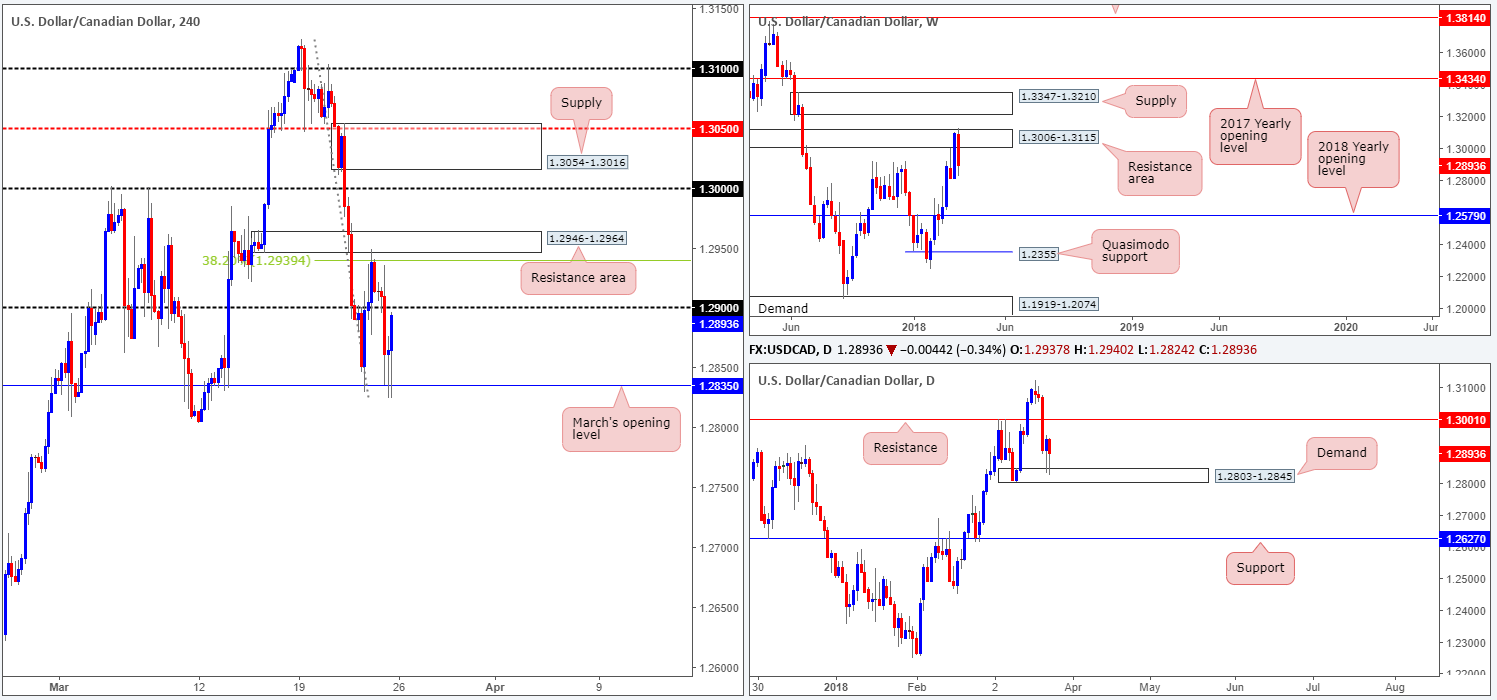
USD/CAD:
Weekly gain/loss: -1.53%
Weekly closing price: 1.2893
This time last week we were presented with a near-full-bodied weekly bullish candle that closed within the upper limits of a weekly resistance area at 1.3006-1.3115.Initial thoughts were a possible break higher. Instead of this, weekly price hit the brakes and turned lower last week, reclaiming around 80 percent of the prior week’s gains!
Turning our attention over to the daily timeframe, daily demand at 1.2803-1.2845 stood firm during the later stages of last week and printed two back-to-back daily buying tails. Providing that daily bulls continue to defend the current demand base, a run up to nearby daily resistance at 1.3001 could take place. Further selling, on the other hand, has the daily support level at 1.2627 to target.
Upbeat Canadian CPI figures on Friday sent H4 price screaming below the 1.29 handle, and eventually forced price to navigate March’s opening level at 1.2835. This level, which also held beautifully on Thursday, managed to bolster prices and pare the majority of CPI-induced losses into the closing bell.
Potential trading zones:
Medium term, this market is somewhat restricted given weekly and daily structure (highlighted in bold).
Short term, however, we could see active selling materialize from 1.29 in early trade. Failing this, traders will likely be honing in on the H4 resistance area coming in at 1.2946-1.2964, which is positioned just above a 38.2% H4 Fib resistance at 1.2939. Both levels hold limited confluence to base a solid trade from, though, in our humble view.
Data points to consider today: FOMC members Dudley, Mester and Quarles take to the stage.
Areas worthy of attention:
Supports: 1.2835; 1.2803-1.2845; 1.2627.
Resistances: 1.29; 1.2946-1.2964; 1.2939; 1.3001; 1.3006-1.3115.
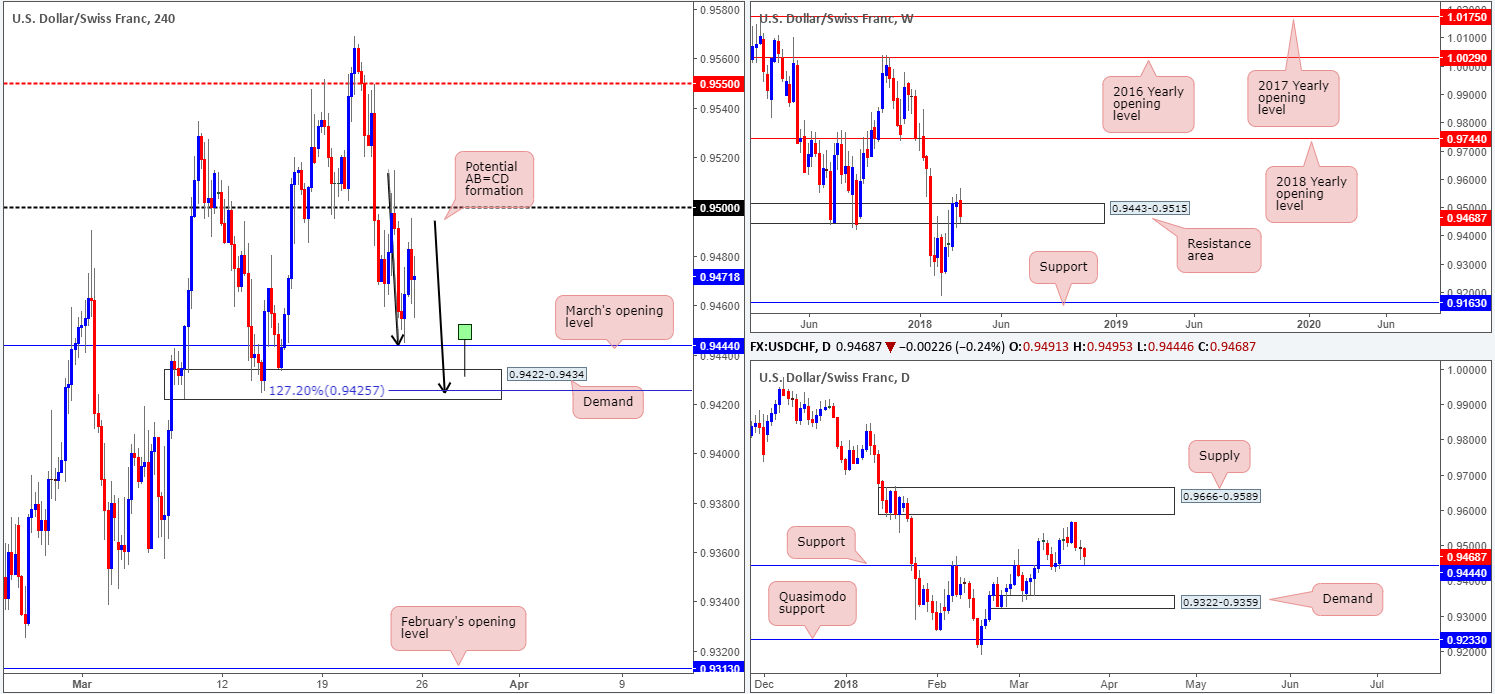
USD/CHF:
Weekly gain/loss: -0.51%
Weekly closing price: 0.9468
Breaking a four-week bullish phase, the USD/CHF turned lower last week and wrapped up the session closing within the confines of a weekly resistance area coming in at 0.9443-0.9515. Further selling from this point could eventually see this unit touch gloves with a weekly support level drawn from 0.9163. A rotation back to the upside, on the other hand, may approach the 2018 yearly opening level positioned on the weekly timeframe at 0.9744.
A closer look at price action, however, highlights that daily price ended the week bottoming just ahead of a daily support level seen at 0.9444. This level proved itself a worthy contender mid-March time, and could very well do so again. Should the bulls position themselves defensively here, the next upside target – apart from the 20th March high 0.9569 – can be seen at a rather robust daily supply at 0.9666-0.9589.
Branching across to the H4 timeframe, we can clearly see a possible H4 AB=CD forming (black arrows), which terminates within the lower limits of a H4 demand base at 0.9422-0.9434 around the 127.2% H4 Fib ext. point at 0.9425. Also worthy of note on this scale is the daily support mentioned above at 0.9444 also represents March’s opening level seen printed on the H4 scale.
Potential trading zones:
Keep an eye on March’s opening level today. Given the possible H4 AB=CD bullish pattern, and taking into account how close the monthly level is positioned to the already proven H4 demand, a fakeout play could be in store today/early this week. Should a H4 bullish tail pierce through the monthly level and tap the H4 demand (see chart for a drawn example), we feel an intraday bounce to the upside could take place and potentially target 0.95. If this trade comes to fruition, we would strongly recommend closely monitoring the position since let’s remember weekly price ended the week reflecting bearish intentions.
Data points to consider today: FOMC members Dudley, Mester and Quarles take to the stage.
Areas worthy of attention:
Supports: 0.9444; 0.9425; 0.9422-0.9434; 0.9163.
Resistances: 0.95; 0.9569; 0.9666-0.9589; 0.9443-0.9515; 0.9744.
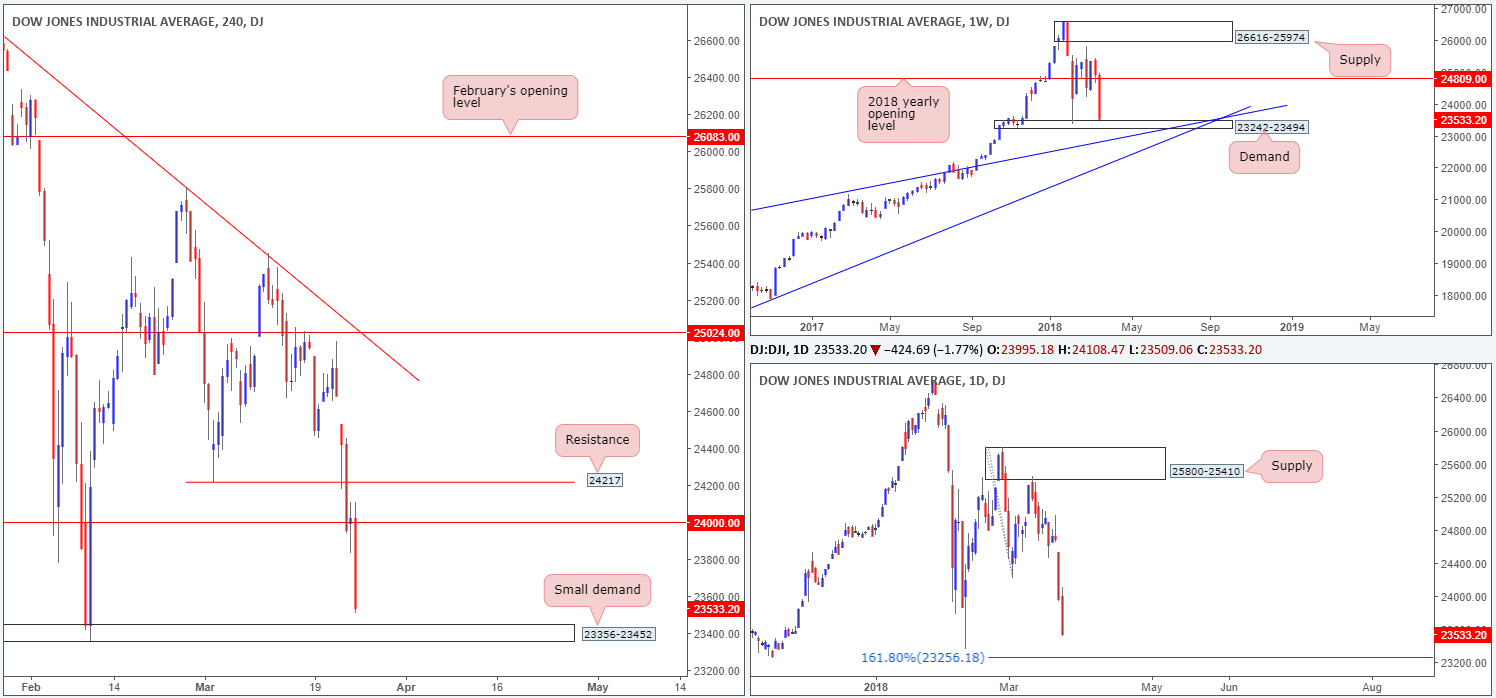
DOW 30:
Weekly gain/loss: -5.67%
Weekly closing price: 23533
Across the board, US indexes nose-dived lower last week, as US-China trade war escalated. In total, the DJIA erased over 1400 points, marking it as the worst week since January 2016. Weekly price engulfed the 2018 yearly opening level at 24809 and concluded the week closing in the shape of a near-full-bodied weekly bearish candle just north of a small weekly demand area at 23242-23494.
Lower on the curve, we can see daily price approaching the 9th Feb low 23360, which, as you can see, is shadowed closely by a 161.8% daily Fib ext. point at 23256. Given that both values are encapsulated within the walls of the aforementioned weekly demand base, a bounce higher from here could be take place.
Looking over to the H4 timeframe, the 24K mark was taken out on Friday despite an attempt seen to push higher. Down 1.77% on the day, the index wrapped up the session closing just north of a small H4 demand area at 23356-23452. The key thing to note here is this area is also housed within the current weekly demand.
Potential trading zones:
Given the strong collection of supports noted above, we do expect to see profit taking come about in the week ahead. However, with trade fears reaching new highs, this is a difficult market to buy.
With that in mind, remaining on the sidelines appears to be the best path to take at the moment.
Data points to consider today: FOMC members Dudley, Mester and Quarles take to the stage.
Areas worthy of attention:
Supports: 23356-23452; 23360; 23256; 23242-23494.
Resistances: 24K; 24809.
GOLD:
Weekly gain/loss: +2.54%
Weekly closing price: 1346.9
Leaving the 2018 yearly opening level seen on the weekly timeframe at 1302.5 (and converging long-term weekly channel support extended from the low 1122.8) unchallenged, the price of gold advanced in strong fashion last week. Further buying from this point could lead to an approach to the weekly resistance pegged at 1375.5.
While weekly price suggests further upside, down on the daily timeframe we have ourselves a nice-looking daily bearish harmonic Gartley pattern that terminates (78.6% Fib retracement) around 1349.6, just south of a daily channel resistance extended from the high 1366.0.
On the back of a waning USD, Friday’s movement saw H4 price advance, taking our multiple H4 tech resistances and eventually wrapping up the week mildly paring gains within the walls of a H4 supply base seen at 1349.1-1346.1. This area, despite a marginal topside breach, is solid – just look at the downside momentum seen from its base! In the event that the breach has tripped stops, however, the next upside target falls in at 1357.1: a H4 Quasimodo resistance level.
Potential trading zones:
The daily bearish harmonic Gartley pattern has certainly caught our eye. To confirm bearish intent, though, the team has noted to keep an eye out for a H4 close below February’s opening level at 1345.1. A successful retest of this level as resistance following a close lower would be enough evidence to promote a sell, in our humble view. Downside targets from this point fall in at a H4 support level drawn from 1340.5, followed by a H4 support area at 1329.0-1326.3 and then quite possibly March’s opening level at 1317.2.
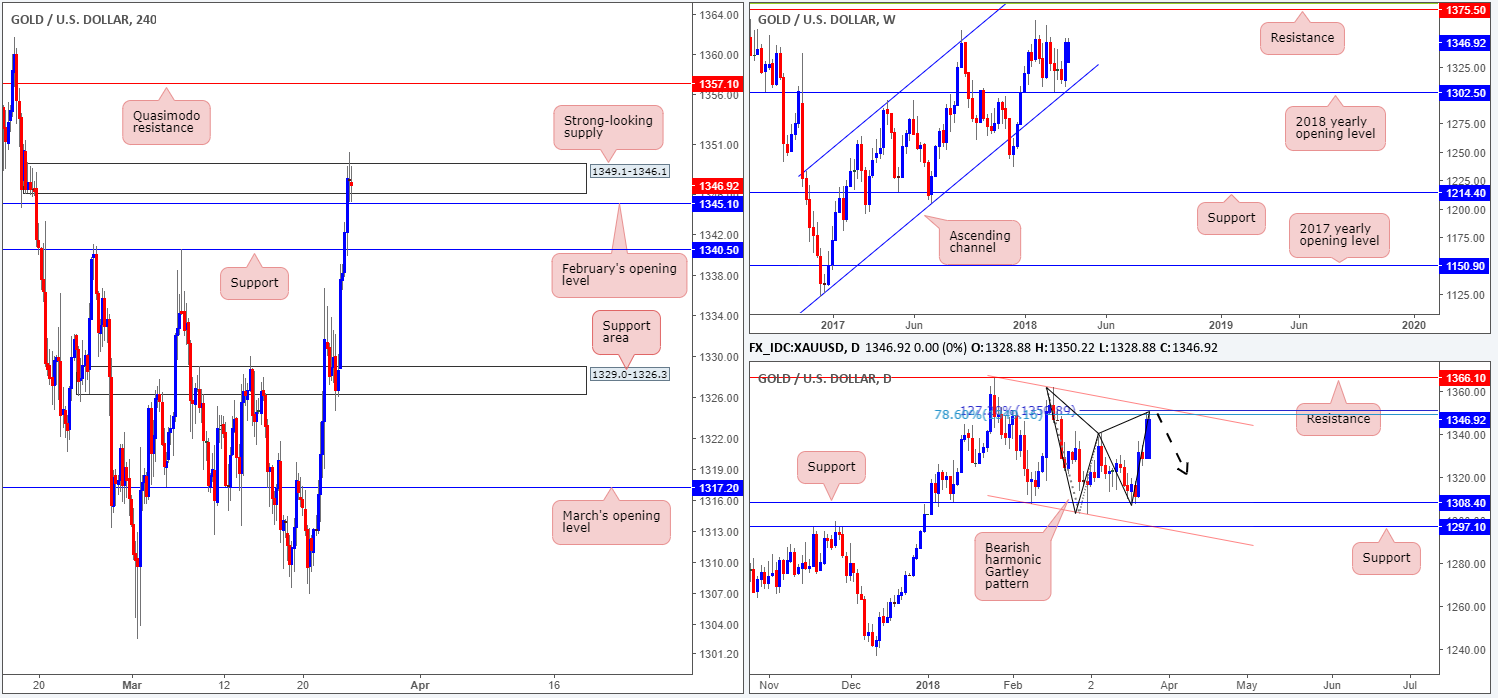
Areas worthy of attention:
Supports: 1345.1; 1340.5; 1329.0-1326.3; 1317.2; 1302.5; weekly channel support.
Resistances: 1349.1-1346.1; 1357.1; 1349.6; daily channel resistance; 1375.5.
This site has been designed for informational and educational purposes only and does not constitute an offer to sell nor a solicitation of an offer to buy any products which may be referenced upon the site. The services and information provided through this site are for personal, non-commercial, educational use and display. IC Markets does not provide personal trading advice through this site and does not represent that the products or services discussed are suitable for any trader. Traders are advised not to rely on any information contained in the site in the process of making a fully informed decision.
This site may include market analysis. All ideas, opinions, and/or forecasts, expressed or implied herein, information, charts or examples contained in the lessons, are for informational and educational purposes only and should not be construed as a recommendation to invest, trade, and/or speculate in the markets. Any trades, and/or speculations made in light of the ideas, opinions, and/or forecasts, expressed or implied herein, are committed at your own risk, financial or otherwise.
The use of the site is agreement that the site is for informational and educational purposes only and does not constitute advice in any form in the furtherance of any trade or trading decisions.
The accuracy, completeness and timeliness of the information contained on this site cannot be guaranteed. IC Markets does not warranty, guarantee or make any representations, or assume any liability with regard to financial results based on the use of the information in the site.
News, views, opinions, recommendations and other information obtained from sources outside of www.icmarkets.com.au, used in this site are believed to be reliable, but we cannot guarantee their accuracy or completeness. All such information is subject to change at any time without notice. IC Markets assumes no responsibility for the content of any linked site. The fact that such links may exist does not indicate approval or endorsement of any material contained on any linked site.
IC Markets is not liable for any harm caused by the transmission, through accessing the services or information on this site, of a computer virus, or other computer code or programming device that might be used to access, delete, damage, disable, disrupt or otherwise impede in any manner, the operation of the site or of any user’s software, hardware, data or property.