A note on lower timeframe confirming price action…
Waiting for lower timeframe confirmation is our main tool to confirm strength within higher timeframe zones, and has really been the key to our trading success. It takes a little time to understand the subtle nuances, however, as each trade is never the same, but once you master the rhythm so to speak, you will be saved from countless unnecessary losing trades. The following is a list of what we look for:
- A break/retest of supply or demand dependent on which way you’re trading.
- A trendline break/retest.
- Buying/selling tails/wicks – essentially we look for a cluster of very obvious spikes off of lower timeframe support and resistance levels within the higher timeframe zone.
- Candlestick patterns. We tend to only stick with pin bars and engulfing bars as these have proven to be the most effective.
We search for lower timeframe confirmation between the M15 and H1 timeframes, since most of our higher-timeframe areas begin with the H4. Stops are usually placed 5-10 pips beyond confirming structures.
EUR/USD:
Weekly gain/loss: – 81 pips
Weekly closing price: 1.1149
Weekly opening price: 1.1152
Weekly view: From this viewpoint, we can see that last week’s weekly candle turned bearish from the underside of a major resistance area coming in at 1.1533-1.1278. Erasing all of the prior week’s gains, this bearish move could trigger further selling in this market this week. The next downside target to have an eye on falls in around the 1.0970 region, followed closely by a major support seen at 1.0819.
Daily view: The story on the daily chart shows that price is now seen deep within a support area drawn from 1.1224-1.1072, but as we already mentioned in previous reports, there’s been little noteworthy bullish intent registered from this barrier as of yet. Perhaps the most compelling factor here is that the candles are in the process of completing an AB=CD bull pattern (black arrows), which terminates around the lower edge of the above said support area, and converges with a trendline support extended from the low 1.0516.
H4 view: A brief look at recent dealings on the H4 chart reveals that Friday’s US CPI data came in hotter than expected. This, as you can see, sent the EUR screaming lower. Both the 1.12 handle and the trendline support taken from the low 1.1045 were taken out, with price ending the week closing just ahead of a demand base seen at 1.1131-1.1143.
Direction for the week: Pressure from the overhead weekly resistance area will likely push the shared currency down to the lower edge of the current daily support area, which, as we mentioned above, converges with an AB=CD bull point and a trendline support. While the weekly chart suggests further selling beyond this point, we do expect at least a bounce from this area to be seen.
Direction for today: In that there’s very little market-moving data on the docket today, we may see price consolidate around the current H4 demand zone.
Our suggestions: After analyzing all three timeframes, we see two points of interest going into trade this week:
- Assuming price bounces from nearby H4 demand, looking to short from 1.12 is valid, in our opinion, due to merging with the recently broken H4 trendline, and also not forgetting that the both higher-timeframe charts suggest lower prices could be seen this week.
- A break below the current H4 demand zone would likely place the H4 support at 1.1075 and the 1.11 band on the hit list. Not only is this a good take-profit area for any shorts in this market, it is also a fantastic barrier to look for longs. It sits within the depths of the aforementioned daily support area, as well as merging with both the above noted daily trendline support and a deep H4 88.6% Fib support at 1.1081.

Levels to watch/live orders:
- Buys: 1.1075/1.11 [strong-looking buy zone which could, dependent on the time of day and approach, be sufficient enough to condone an entry without waiting for lower timeframe confirmation] (Stop loss: 1.1060).
- Sells: 1.12 region [H4 bearish close required] (Stop loss: beyond the trigger candle).
GBP/USD:
Weekly gain/loss: – 266 pips
Weekly closing price: 1.2995
Weekly opening price: 1.2999
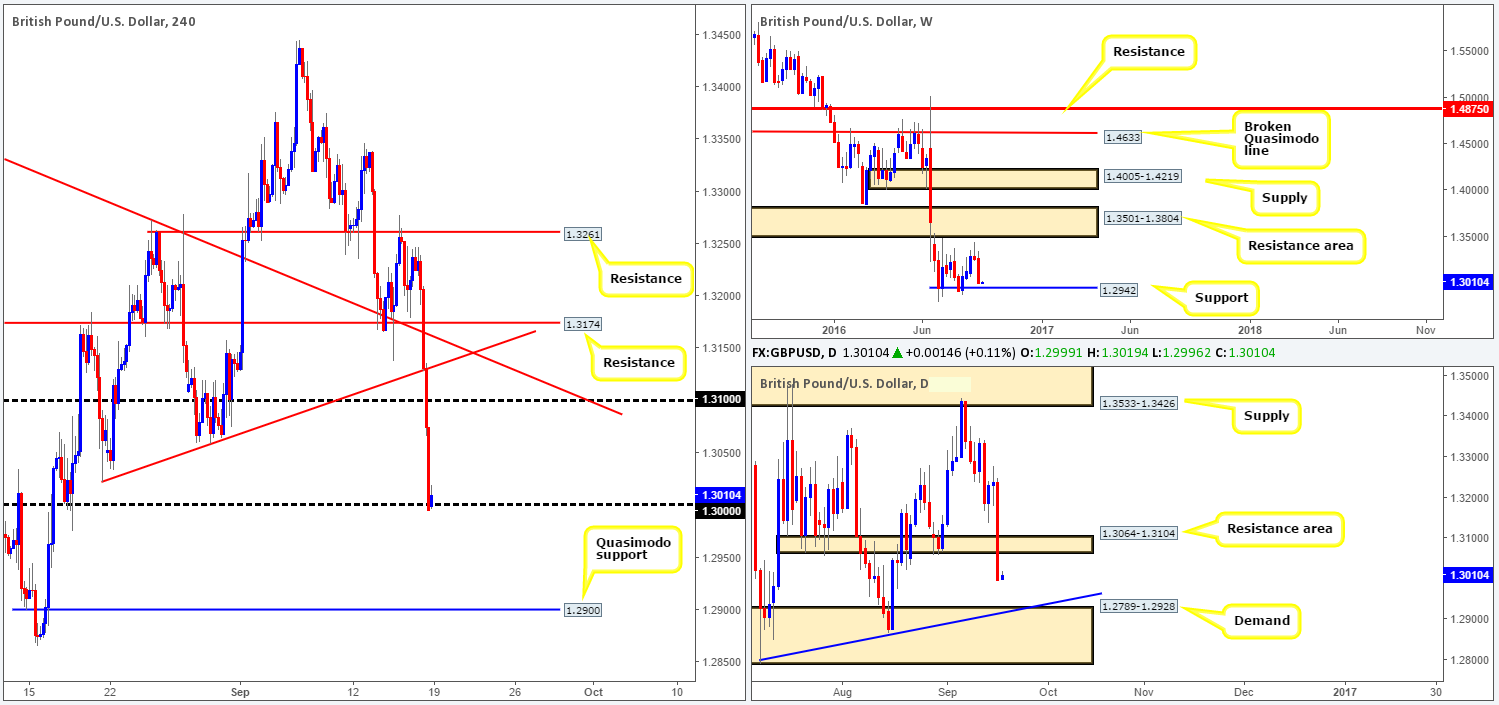
Weekly view: A succession of offers flowed into this market last week, following the previous week’s bearish selling wick. Closing out the week just ahead of a support level seen at 1.2942, we may, should price attack this area this week, see prices hold ground here. A strong reversal is unlikely, nonetheless, given that the predominant trend is clearly pointing in a southerly direction.
Daily view: Turning over a page to the daily chart, price smashed through a support area at 1.3064-1.3104 last week, potentially opening up the possibility for either a retest to the underside of this area or a continuation move down to demand penciled in at 1.2789-1.2928 (blends with a trendline support extended from the low 1.2789).
H4 view: The after-effects of Friday’s US CPI data drove prices lower, eventually chomping through bids around both a trendline support taken from the low 1.3022 and the 1.31 handle. Candle action closed the week just beyond the key figure 1.30, which, as can be seen from the chart, is currently holding cable higher.
Direction for the week: Higher timeframes indicate that there is a possibility of further selling yet before support is seen.
Direction for today: In absence of any high-impacting news events today, 1.30 could remain a dominant figure despite the higher-timeframe structures portending lower prices.
Our suggestions: Although 1.30 is likely being watched by the majority of the market, we’re wary of buying from here with it having little higher-timeframe support. Therefore, to be on the safe side, our prime focus will be on the following setups:
- Watch for a decisive close below 1.30, and then look to trade any retest seen to the underside of this number (waiting for a H4 bearish close following the retest is recommended), targeting weekly support at 1.2942.
- On the condition that prices rally from 1.30, 1.31 looks relatively attractive for shorts given its connection with the underside of the daily resistance area at 1.3104. Waiting for at least a H4 bearish close to form prior to pulling the trigger here is recommended to avoid the dreaded fakeout.
Levels to watch/live orders:
- Buys: Flat (Stop loss: N/A).
- Sells: 1.31 region [H4 bearish close required] (Stop loss: beyond the trigger candle). Watch for price to close beyond 1.30 and then look to trade any retest seen thereafter [waiting for a H4 bearish close following the retest is preferred] (Stop loss: beyond the trigger candle).
AUD/USD:
Weekly gain/loss: – 51 pips
Weekly closing price: 0.7484
Weekly opening price: 0.7478
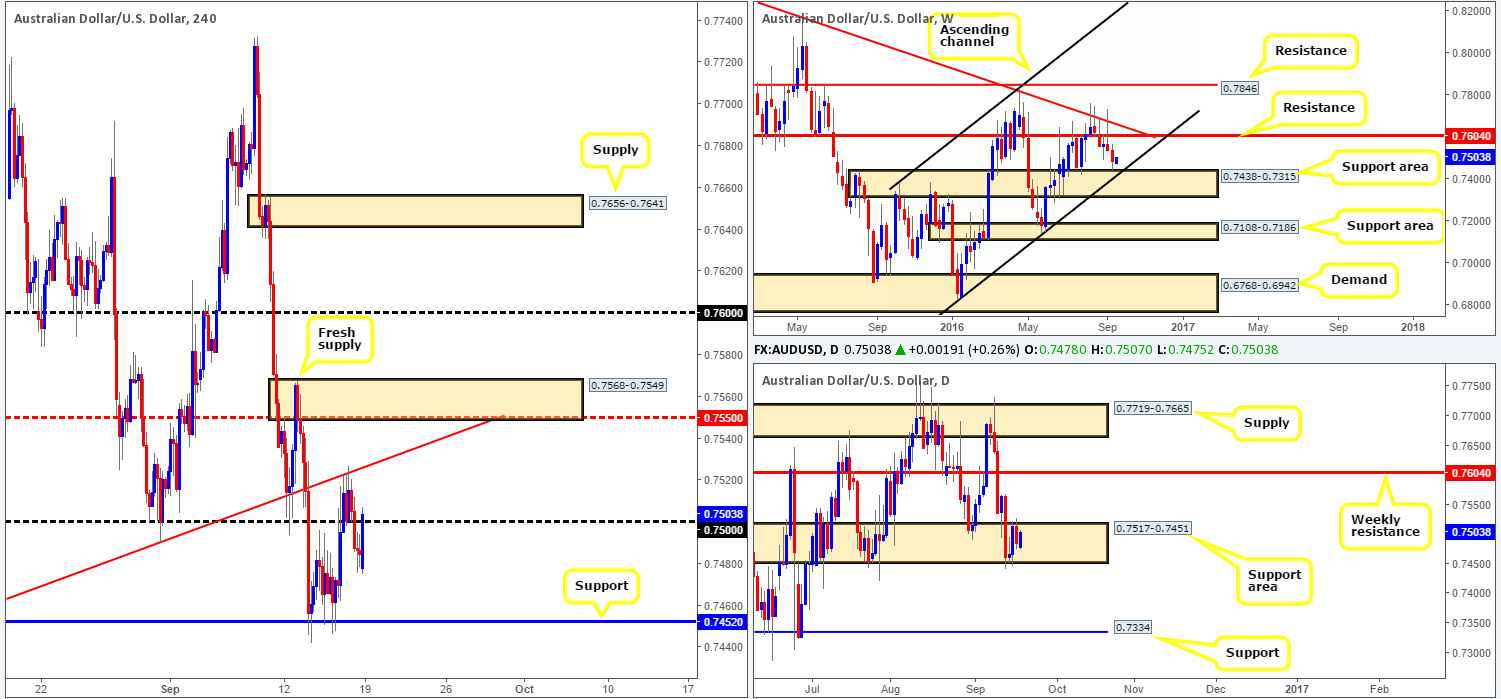
Weekly view: As can be seen from this chart, the commodity currency extended lower last week, following the previous week’s bearish selling wick from resistance at 0.7604. At the time of writing, candle action has begun bottoming out just ahead of a support area at 0.7438-0.7315, which is complemented by a channel support line extended from the low 0.6827. In the event that the bulls hold position here, we could see prices retest the underside of the aforementioned weekly resistance once again!
Daily view: The support area seen at 0.7517-0.7451 continued to hold form last week, despite seeing a slight breach on Tuesday. This zone is, as you can probably see, positioned just above the current weekly support area. The next upside target we have our eye on from here is the weekly resistance line coming in at 0.7604.
H4 view: The aftermath of Friday’s better than expected US CPI data saw the candles slip below the 0.75 handle. The move was far less explosive than that of the EUR and GBP, with the Aussie dollar already seen reversing the majority of Friday’s losses this morning after opening on a strong bid tone.
Direction for the week: Both weekly and daily charts show price trading near supportive structures at the moment. As such, we feel price will either simply continue to consolidate around the current daily support area or rally north up to the aforementioned weekly resistance level.
Direction for today: Seeing as how price is attacking the 0.75 handle at the moment, a close above this level is expected (according to the higher-timeframe structures). The next upside targets from this neighborhood is a H4 trendline resistance picked from the low 0.7455, followed by a H4 supply at 0.7568-0.7549, which unites with the H4 mid-way resistance 0.7550.
Our suggestions: Supposing that a H4 close above 0.75 comes into view, a buy trade on the retest of this number is certainly something to consider. Personally, however, we would only become buyers from this line following a clear bullish close after the retest. Fakeouts around psychological boundaries are extremely common, so waiting for the bulls to prove themselves before taking the plunge is, at least in our book, the safer route to take here.
Levels to watch/live orders:
- Buys: Watch for price to close beyond 0.75 and then look to trade any retest seen thereafter [waiting for a H4 bullish close following the retest is preferred] (Stop loss: beyond the trigger candle).
- Sells: Flat (Stop loss: n/a).
USD/JPY:
Weekly gain/loss: – 40 pips
Weekly closing price: 102.24
Weekly opening price: 102.14
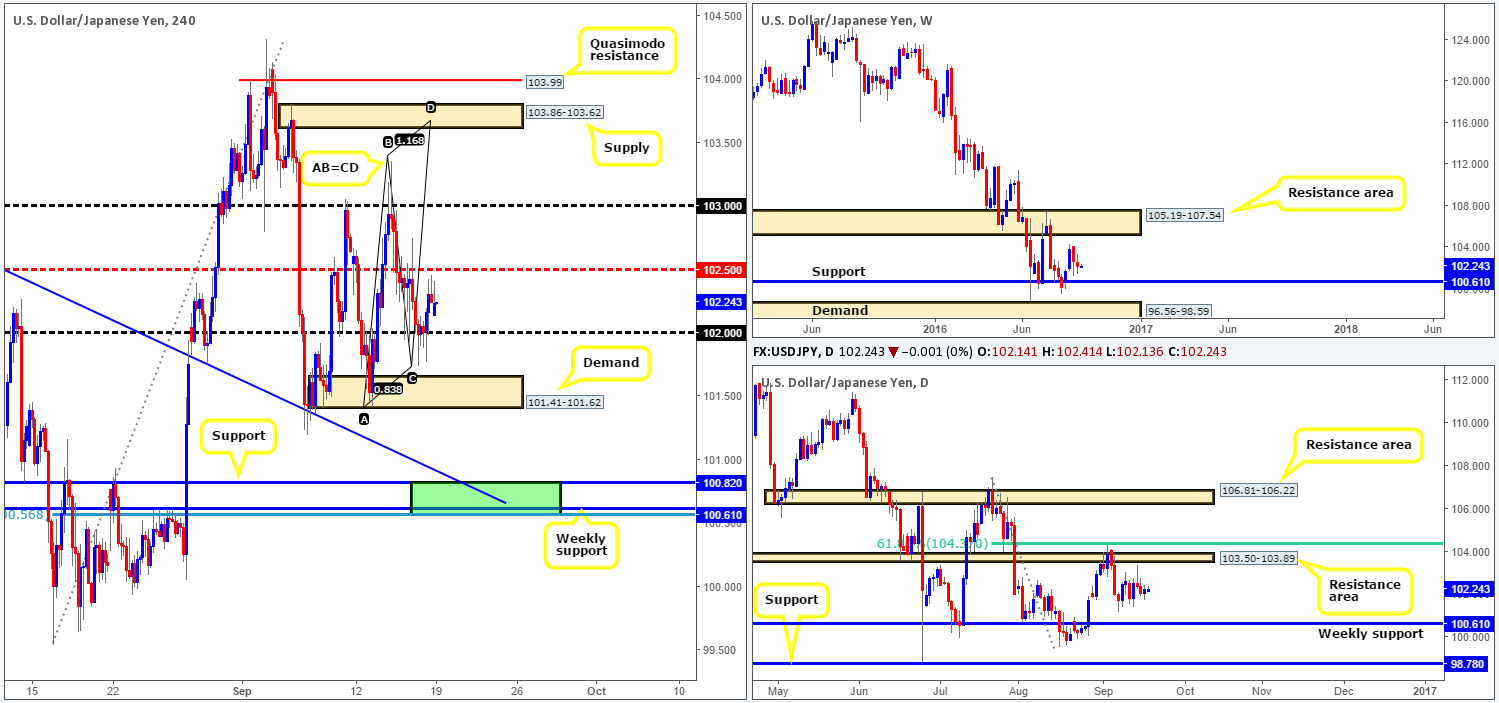
Weekly view: Although last week’s range came in just under 200 pips, the pair ended the week closing only 40 pips below the prior week’s close, consequently forming an indecision candle with a slight edge seen going to the bears. As far as structures go this week, we have our eyes on both the support level seen at 100.61 and the resistance area coming in above at 105.19-107.54.
Daily view: From this angle, nonetheless, the buyers and sellers are seen lurking mid-range between a resistance area coming in at 103.50-103.89 and the above said weekly support level.
H4 view: Propelled by a stronger than expected US CPI reading on Friday, H4 activity established support around the 102 boundary, closing the day out just ahead of the H4 mid-way resistance 102.50.
Direction for the week: Despite the pair’s trend clearly pointing in a southerly direction, higher-timeframe structures are seen capping price in both directions this week (see above). Therefore, to our way of seeing things, direction is restricted for the time being.
Direction for today: A light economic calendar, coupled with Monday’s trading sessions being notoriously slow, the pair could potentially remain locked between 102.00/102.50.
Our suggestions: On account of the above points, our team has noted two interesting areas to keep an eyeball on this week:
- The H4 supply seen at 103.86-103.62. This zone is seen lodged within the aforementioned daily resistance area and boasts a potential H4 AB=CD approach taken from the low 101.41. Seeing as there is a chance of a fakeout being seen though this area to the H4 Quasimodo resistance level at 103.99, we would strongly recommend waiting for at least a H4 bearish close to form before considering a short position here.
- A weekly support level at 100.61 and a H4 support at 100.82 (green rectangle). This area also includes a H4 78.6% Fib support at 100.56 and a H4 trendline support extended from the high 102.65. In view of the confluence seen here, our team would, dependent on time of day, look to enter long from this zone at market with a stop planted below at 100.47.
Levels to watch/live orders:
- Buys: 100.61/100.82 [dependent on the time of day, a long from here without confirmation is possible] (Stop loss: 100.47).
- Sells: 103.86-103.62 [H4 bearish close required] (Stop loss: beyond the trigger candle).
USD/CAD:
Weekly gain/loss: + 163 pips
Weekly closing price: 1.3207
Weekly opening price: 1.3216
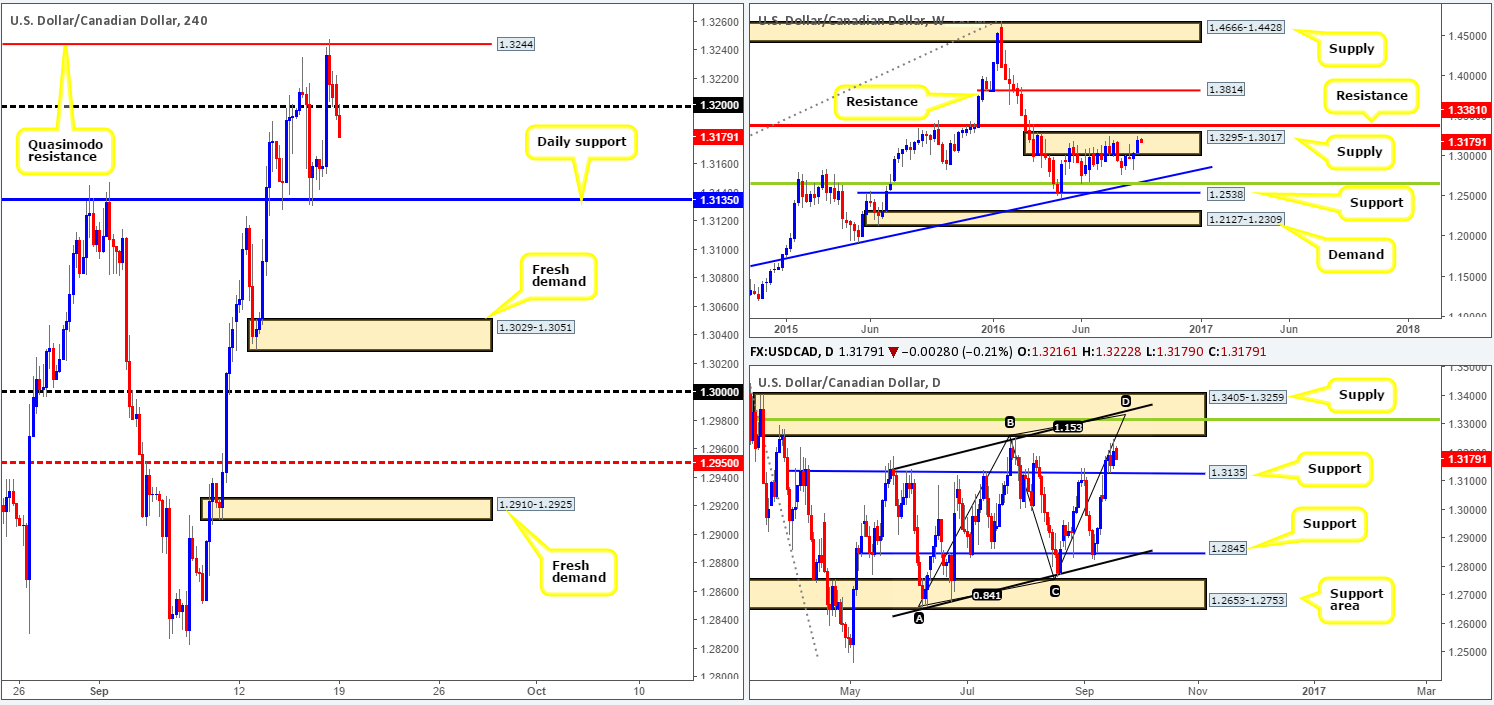
Weekly view: During the course of last week’s trading the bulls pressed higher, resulting in price driving into the depths of a supply barrier drawn from 1.3295-1.3017. Although the bears still have a hand in this fight, we have to be prepared for the possibility of a breach of this zone, which would immediately place the resistance hurdle at 1.3381 in view.
Daily view: Looking at the daily chart, we can see that the pair is currently seen trading mid-range between a support level at 1.3135 and a supply zone coming in at 1.3405-1.3259. This supply zone is very interesting. Not only does it house a 38.2% Fib resistance level at 1.3315 (green line) and the above said weekly resistance level, it also converges with a channel resistance taken from the high 1.3241 and an AB=CD completion point around the 1.3332ish range.
H4 view: The impact of Friday’s US CPI data saw the loonie extend up to a Quasimodo resistance line coming in at 1.3244, which was a noted zone to look for shorts! Well done to any of our readers who managed to pin down a sell from here!
Direction for the week: Although there is a good chance prices could stretch north to the above said daily supply zone, we feel that the market will ultimately end the week in the red, due to the position of price on the weekly timeframe.
Direction for today: With this morning’s action seen extending last week’s bounce from the H4 Quasimodo resistance at 1.3244 and breaching the 1.32 handle, this will very likely send prices back down to the aforementioned daily support level today.
Our suggestions: There are no immediate opportunities that jump out at us. However, should H4 action close below the current daily support, this could spark a selloff down to a fresh H4 demand area at 1.3029-1.3051. Therefore, in that weekly price is trading from supply at the moment, we would look to short beyond the daily support line if price closes below here and retests this boundary as resistance (waiting for a H4 bearish close following the retest is recommended).
In addition to the above, do keep a tab on the 1.33 handle. Not only does this line sit within the above said weekly supply, it is positioned nearby the daily convergence point (see above in bold). Should price reach 1.3310/15ish region we would have no hesitation (apart from if high-impacting news is scheduled for release) in shorting here at market with stops placed above the daily supply zone at 1.3407. Granted it is a big stop, but we sure you’ll agree that there is a lot of potential for downside here!
Levels to watch/live orders
- Buys: Flat (Stop loss: n/a).
- Sells: Watch for price to close beyond daily support at 1.3135 and then look to trade any retest seen thereafter [waiting for a H4 bearish close following the retest is preferred] (Stop loss: beyond the trigger candle). 1.3310/15 region (Stop loss: 1.3407).
USD/CHF:
Weekly gain/loss: + 49 pips
Weekly closing price: 0.9799
Weekly opening price: 0.9793
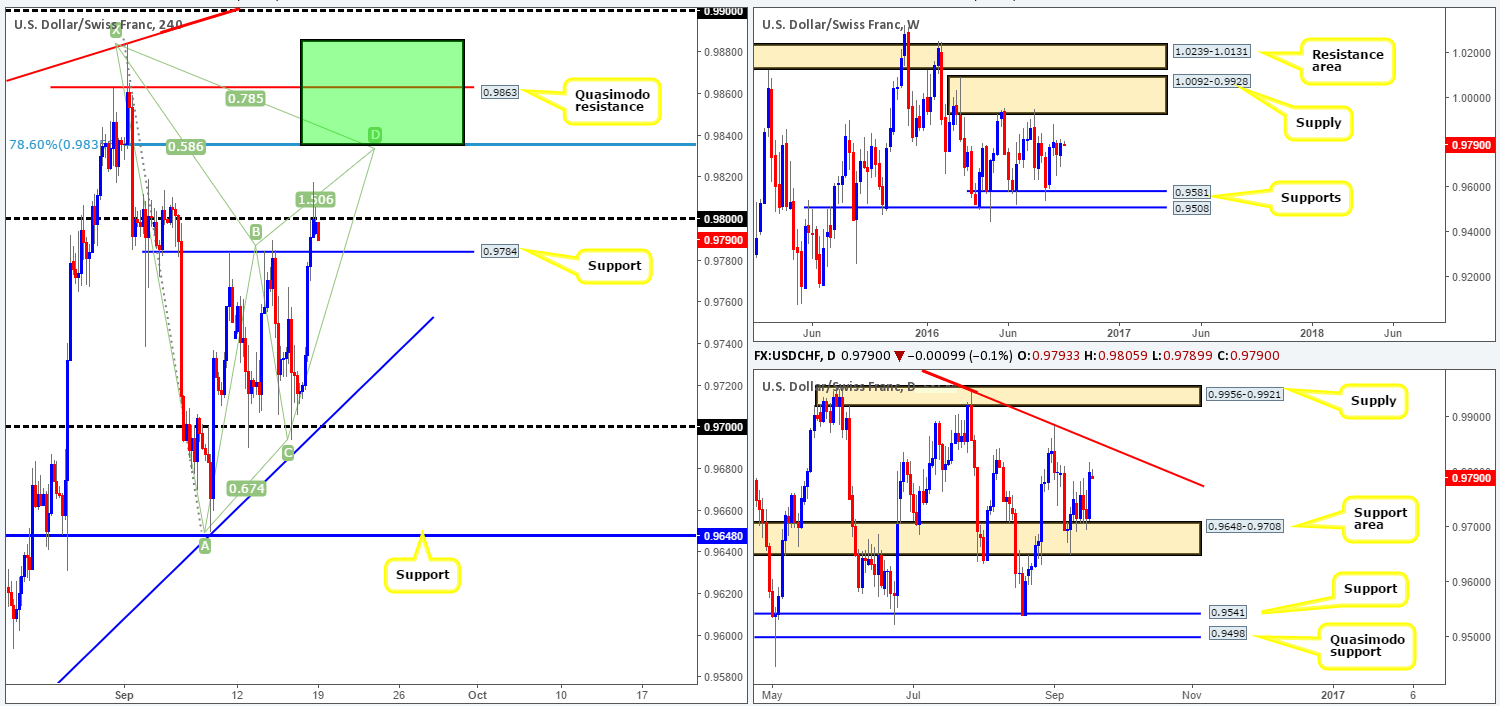
Weekly view: Since the beginning of May, the USD/CHF pair has been consolidating between a supply zone painted at 1.0092-0.9928 and a support band drawn from 0.9581. It’s unlikely that price will breach the walls of this range this week, so the best we can do on this timeframe is continue to keep a tab on the edges of this consolidation.
Daily view: The situation on the daily chart, however, shows that the Swissy managed to remain afloat above the support area at 0.9648-0.9708 last week, resulting in price punching to highs of 0.9817 by the week’s end. On the assumption that the bulls remain in a dominant position, the next upside target to have jotted down comes in at the trendline resistance extended from the high 1.0256, followed by the supply area seen at 0.9956-0.9921 (glued to the underside of the above said weekly supply zone).
H4 view: Encouraging US CPI data pushed the US dollar higher against the Swiss Franc on Friday, breaching and eventually closing above resistance at 0.9784 and tagging in offers around the 0.98 band by the close.
Direction for the week: With weekly price seen loitering mid-range between the above said structures, and daily price reflecting more a bullish stance from the current daily support area, it’s likely we’ll see prices head north at least until we collide with the aforementioned daily trendline resistance.
Direction for today: On account of the higher-timeframe structures, a close above 0.98 is likely to be seen, followed up by a continuation move north to the 0.9863/0.9835 region.
Our suggestions: While a close above 0.98 is considered a bullish cue, our team will not be looking to buy here. The reason for why is simply because that there’s a H4 harmonic Gartley reversal zone seen between 0.9884/0.9835 (green zone). However, we are only really interested in shorting between the 0.9863/0.9835 region (a H4 Quasimodo resistance line/78.6% Fib resistance). In addition to this sell zone converging with the above said daily trendline resistance, our team will be looking to short from here (on the basis a H4 bearish close forms) with our stop placed either above the trigger candle or above the H4 Quasimodo resistance line.
Levels to watch/live orders:
- Buys: Flat (Stop loss: n/a).
- Sells: 0.9863/0.9835 [H4 bearish close required] (Stop loss: beyond the trigger candle).
DOW 30:
Weekly gain/loss: + 93 points
Weekly closing price: 18136
Weekly opening price: 18136
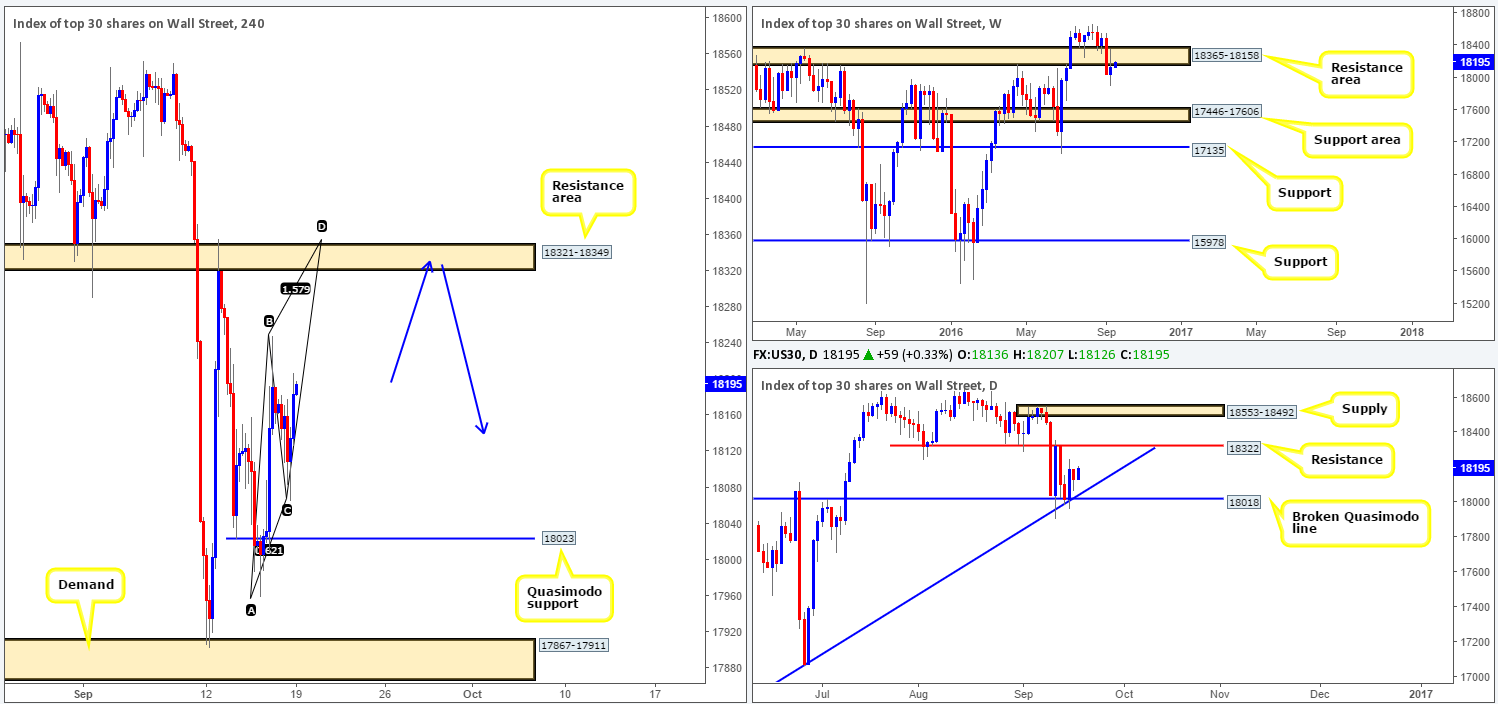
Weekly view: Although the index etched out a 93-point gain last week, price action shows more of a bearish stance in play right now as it continues to hug the underside of a resistance area at 18365-18158. Further selling from this point could potentially drag the equity market down to a support area carved from 17446-17606.
Daily view: In spite of the weekly chart trading around a resistance area right now, down here on the daily chart, bids to offers appear even right now. The DOW is currently capped between a resistance line seen at 18322 and a broken Quasimodo line chalked up at 18018 (converges with a trendline support taken from the low 15501).
H4 view: From this viewpoint, we can see that price is floating between a demand area at 17867-17911 (sits just below the aforementioned daily broken Quasimodo line) and a resistance area at 18321-18349 (houses the above said daily resistance level).
Direction for the week: Although we feel that prices are likely to head south, there is a good chance that this unit may clip the daily resistance level at 18322 before dropping to fresh lows.
Direction for today: Other than Friday’s high point 18248, there is little stopping prices from rallying up to the aforementioned H4 resistance area today.
Our suggestions: Quite simply, our team has their eye on the current H4 resistance area for shorting opportunities today (blue arrows). Not only is this zone connected with the above said daily resistance line, but it is also merges nicely with a H4 AB=CD approach formation (drawn from the low 17959) which terminates around the 18355ish range. Since a fakeout through this zone is possible, we would not advise placing pending orders here. Instead, wait for price to at least chalk up a H4 bearish close before considering pulling the trigger.
Levels to watch/live orders:
- Buys: Flat (Stop loss: n/a).
- Sells: 18321-18349 [H4 bearish close required] (Stop loss: beyond the trigger candle).
GOLD:
Weekly gain/loss: – $17.4
Weekly closing price: 1309.7
Weekly opening price: 1309.7
Weekly view: With the yellow metal once again seen crossing swords with the top edge of a support area at 1307.4-1280.0, renewed buying interest may come into the market from here this week. With this in mind, the next upside target from this zone can be seen at 1361.7: a Quasimodo resistance level.
Daily view: As things stand on the daily chart, price is seen lurking deep within a demand area at 1305.3-1322.8. This – coupled with weekly price kissing the top edge of a weekly support area will likely send gold prices higher this week. Nevertheless, do be prepared for the possibility that price could fake below the demand base to the support hurdle at 1301.5, before the buyers make an appearance.
H4 view: As the US dollar edged higher on positive CPI data on Friday, the metal went on to clock fresh lows. This, as you can see, took out the H4 support area at 1312.0-1316.0, which is currently being retested as resistance as prices opened the week on a strong bid tone.
Direction for the week: In light of both the weekly and daily structures (see above), higher prices are likely to be seen. Whether or not this will be enough to bid bullion up to the daily trendline resistance extended from the high 1375.0 (the next upside target on the daily timeframe) is, unfortunately, difficult to judge at this point.
Direction for today: With the buyers and sellers seen dancing within a H4 resistance area at 1312.0-1316.0 right now, we would not be comfortable selling here knowing where price is trading from on the bigger picture! However, there is a chance, as we explained above in the daily section, that price may fake beyond the daily demand to daily support at 1301.5. So do keep this in mind guys.
Our suggestions: Look for buying opportunities either on the break above and retest of the current H4 resistance area, targeting the minor H4 Quasimodo resistance at 1326.1, followed closely by the H4 supply area seen at 1331.8-1329.6. Or, if price does indeed react bearishly from the current H4 resistance area, keep an eye on the 1297.7/1301.5 region for buys. This represents a H4 61.8% Fib support (not seen on the chart – taken from the low 1250.1) and the aforementioned daily support.
To be on the safe side here guys, we would recommend waiting for at least the H4 candles to print a bullish close before trading either of the above said setups.

Levels to watch/live orders:
- Buys: 1297.7/1301.5 region [H4 bullish close required] (Stop loss: beyond the trigger candle). Watch for price to close beyond the H4 resistance area at 1312.0-1316.0 and then look to trade any retest seen thereafter [waiting for a H4 bullish close following the retest is preferred] (Stop loss: beyond the trigger candle).
- Sells: Flat (Stop loss: n/a).


