EUR/USD:
Weekly gain/loss: -0.13%
Weekly closing price: 1.1746
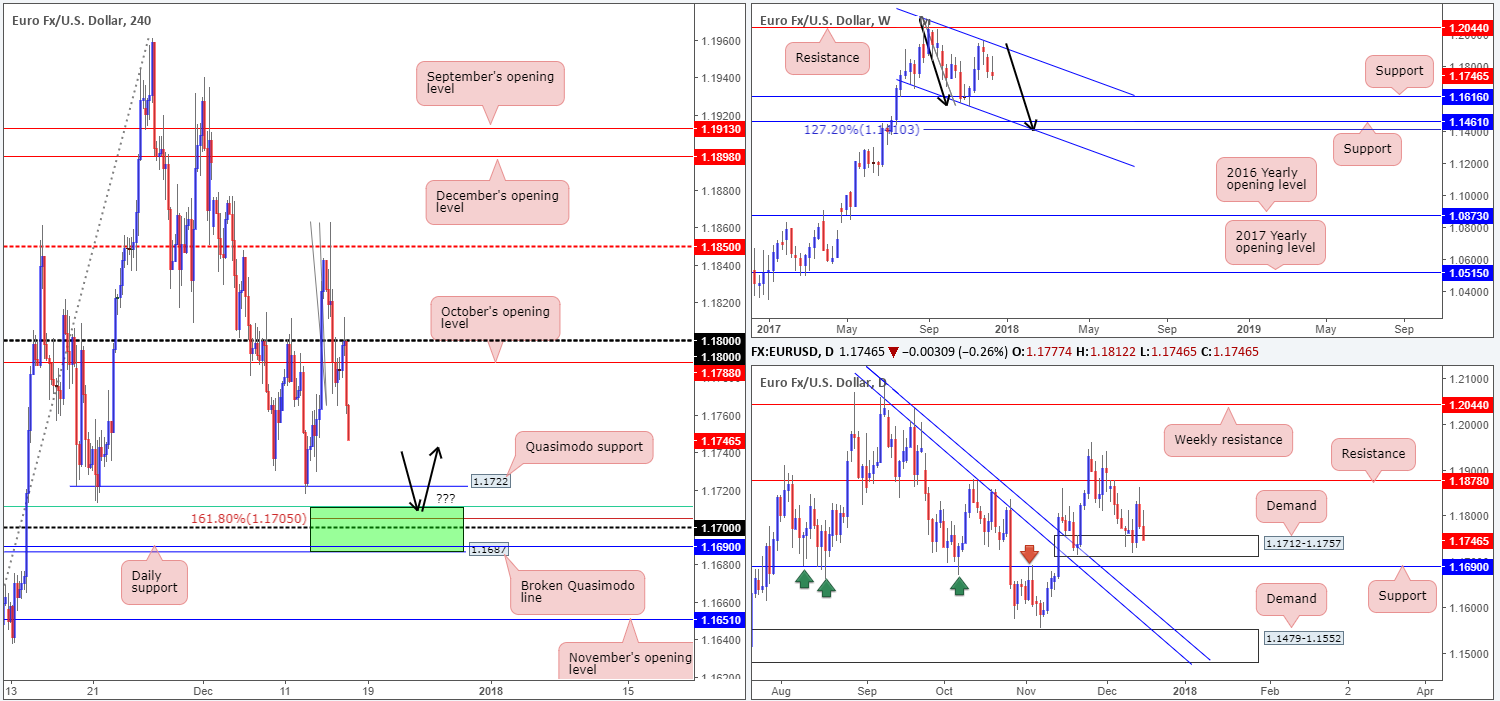
The euro suffered its third consecutive loss last week, down from an overall peak of 1.1961. According to the weekly structure, further downside remains a strong possibility as there is little weekly support seen on the radar until we reach 1.1616. The other key thing to note on the weekly timeframe is the potential AB=CD (see black arrows) 127.2% Fib ext. point at 1.1410, which happens to terminate a few pips beyond a weekly support positioned at 1.1461.
Daily demand at 1.1712-1.1757 remained unbroken during last week’s session, largely due to FOMC action seen on Wednesday. Despite this, upward momentum failed to print much of a follow-though, quickly switching tracks on Thursday and erasing FOMC-inspired gains by the week’s end. In the event that this daily demand area fails to accommodate the buyers this week, then the next port of call will be the nearby daily support band seen at 1.1690.
Following a strong retest of the 1.18 handle going into Friday’s London segment, H4 price aggressively sold off in the shape of two full-bodied H4 bearish candles (US dollar gathered momentum on the back of some optimism regarding the US tax reform). In view of the pair’s close proximity to the H4 Quasimodo support at 1.1722 right now, a test of this level is likely sometime today/early this week. Perhaps the most compelling factor on the H4 timeframe, though, is the green zone seen just below 1.1722 at 1.1687/1.1711 (comprised of a 61.8% H4 Fib support at 1.1711 taken from the low 1.1565, a H4 AB=CD 161.8% Fib ext. point at 1.1705, a round number at 1.17, the aforesaid daily support and a broken H4 Quasimodo level at 1.1687).
Market direction:
The H4 green zone is an encouraging area for a bounce higher, according to the technicals. Not only will a test of this area likely fill any stop-loss orders lurking below the current H4 Quasimodo support and daily demand, it also, as we hopefully demonstrated above, holds an attractive range of confluence! The only drawback, of course, is the fact that weekly sellers appear to be targeting weekly support mentioned above at 1.1616.
As for potential take-profit targets from 1.1687/1.1711, it is difficult to judge at this point since the H4 approach has yet to complete.
Data points to consider: EUR final CPI y/y at 10am GMT.
Areas worthy of attention:
Supports: 1.1722; 1.1687/1.1711; 1.1712-1.1757; 1.1616.
Resistances: 1.18 handle; 1.1788.
GBP/USD:
Weekly gain/loss: -0.52%
Weekly closing price: 1.3317
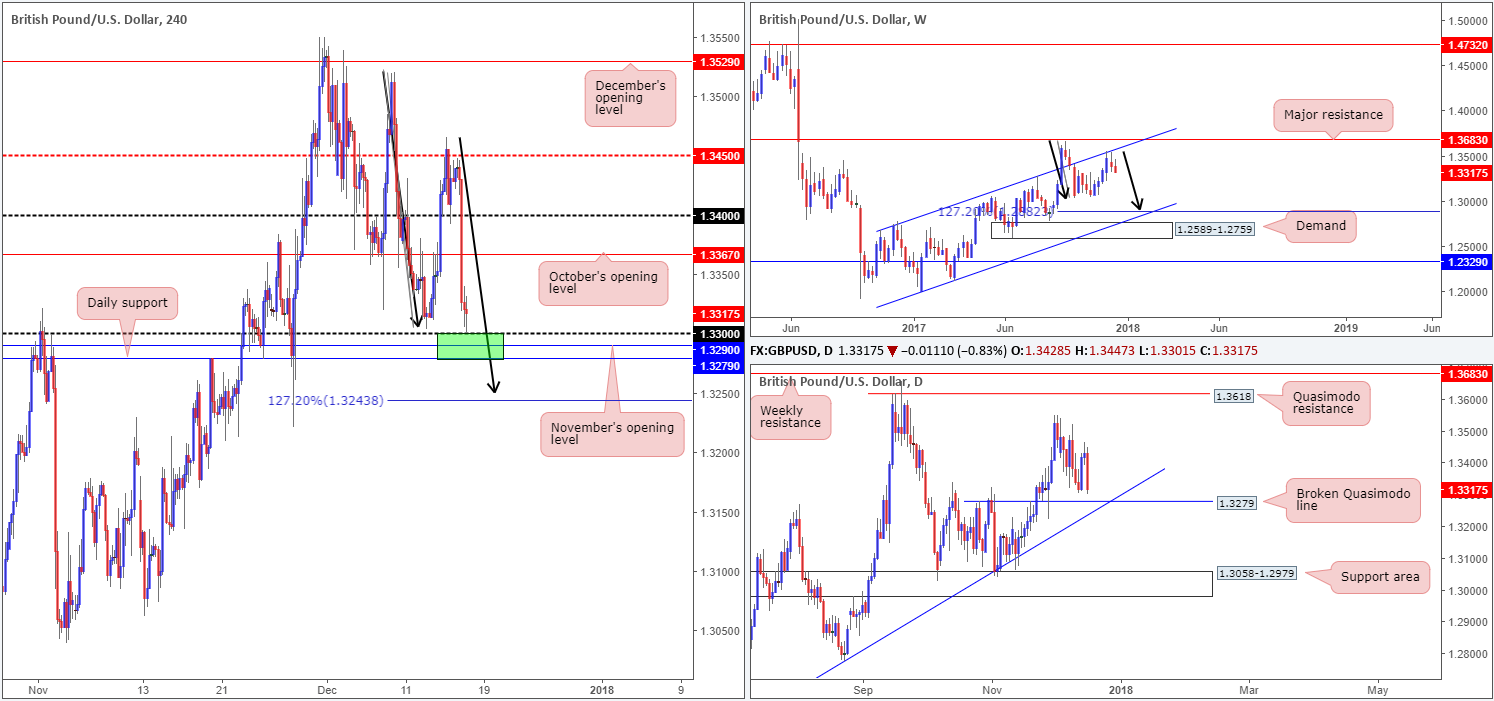
After shaking hands with the weekly channel resistance extended from the high 1.2673 a few weeks back, the British pound has displayed signs of weakness. Further losses from this area could eventually see the pair complete a weekly AB=CD (see black arrows) 127.2% ext. point at 1.2882, which happens to intersect beautifully with a weekly channel support etched from the low 1.1986.
Before weekly price reaches this point, nevertheless, the technical picture on the daily timeframe shows immediate support in view at 1.3279: a broken daily Quasimodo line that unites with a daily trendline support taken from the low 1.2108. A violation of this zone would likely place the daily support area at 1.3058-1.2979 in the firing range.
A quick recap of Friday’s action on the H4 timeframe shows that the GBP plunged lower on negative sentiment going into London trade. After ripping through multiple H4 tech supports, the pair bottomed just ahead of the 1.33 handle at the close. 1.33, as you can probably see, is an interesting barrier. A few pips below this line is November’s opening level at 1.3290, and a few pips below that sits the noted daily support. By itself, these three lines (green H4 zone) form strong support. Also of particular interest, however, is the H4 AB=CD (black arrows) 127.2% Fib ext. point seen at 1.3243.
Market direction:
While 1.3279/1.33 stands a reasonable chance of bouncing price action higher this week, remembering where weekly price is trading from is vital! What’s more, one would also do well to note the H4 AB=CD formation, since this could pull H4 price beyond the H4 green area – anyone smelling a potential fakeout here? Therefore, waiting for additional candle confirmation to form around the green H4 zone might be a better route to take. Should one manage to pin down a trade from this region, expect selling pressure to reside around October’s opening level seen at 1.3367.
Data points to consider: No high-impacting events scheduled on the docket.
Areas worthy of attention:
Supports: 1.33 handle; 1.3290; 1.3279; 1.3243; 1.2882; 1.3279; daily trendline support taken from the low 1.2108.
Resistances: 1.3367.
AUD/USD:
Weekly gain/loss: +1.88%
Weekly closing price: 0.7640
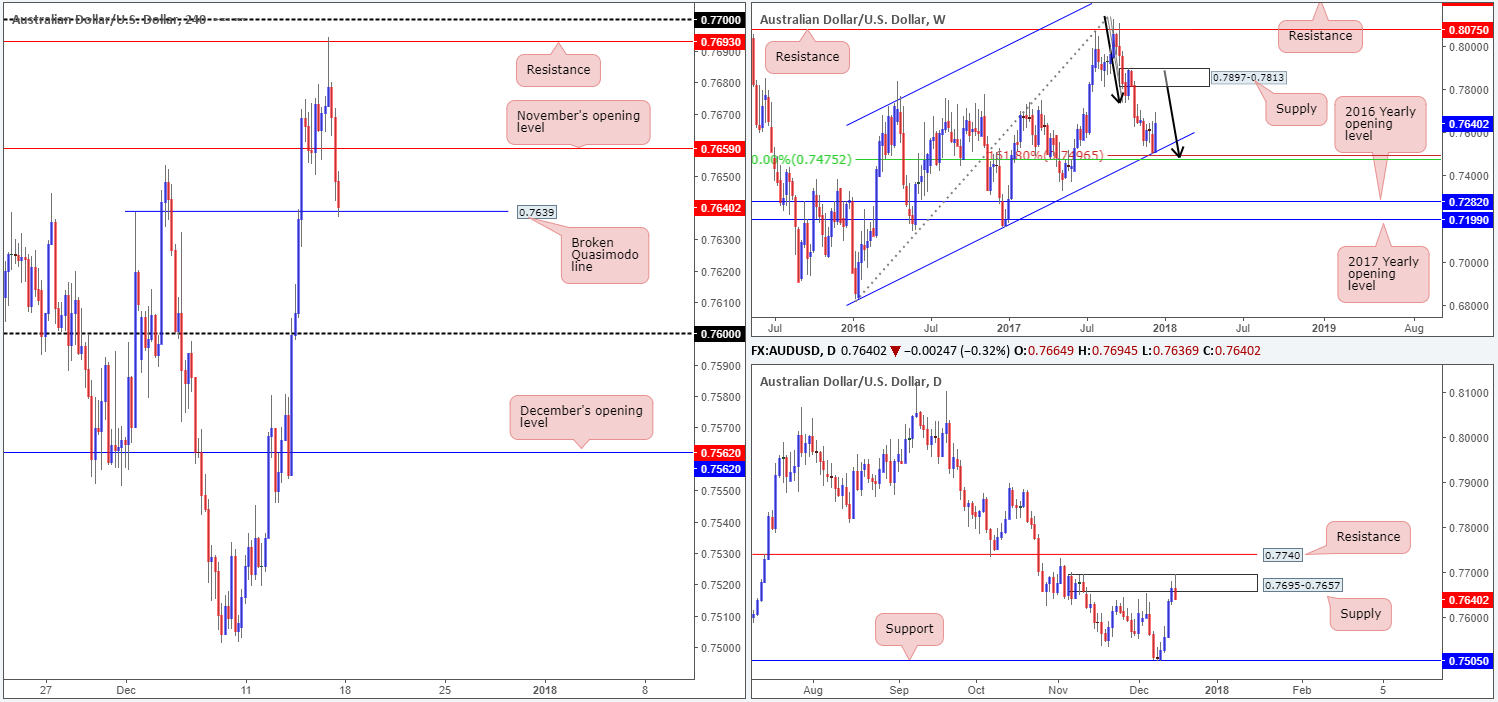
A small area seen comprised of a weekly channel support extended from the low 0.6827, a weekly 50.0% value at 0.7475 taken from the high 0.8125 and a nice-looking weekly AB=CD (see black arrows) 161.8% Fib ext. point situated at 0.7496, managed to rotate price beautifully and rally over 130 pips last week! Furthermore, according to the weekly timeframe, we could see the pair extend up to as far as weekly supply at 0.7897-0.7813.
Crossing down to the daily timeframe, we can see that last week’s advance was also bolstered by a daily support level plotted at 0.7505 and a daily inverted pin-bar formation. The rally from this neighborhood transported the daily candles up to a daily supply printed at 0.7695-0.7657, which, as you can see, held price lower on Friday and broke the week’s four-day bullish phase. The robust gains in commodities and Australia’s firm employment growth were, alongside higher-timeframe technical support, key catalysts behind AUD strength last week.
Following a successful retest of November’s opening level seen on the H4 timeframe at 0.7693, the pair extended gains in early Europe on Friday and challenged H4 resistance at 0.7693. Despite this, the response from the noted H4 resistance level was somewhat explosive, sending H4 price back below Nov’s open level and into the hands of a H4 broken Quasimodo line at 0.7639 by the week’s end.
Market direction:
A decisive H4 close beyond the current H4 broken Quasimodo line would likely do two things. Firstly, it could open up downside to at least the 0.76 handle, and secondly it may help confirm bearish strength from the aforesaid daily supply. Be that as it may, selling this move is awkward knowing that weekly price recently chalked up aggressive gains from a defined weekly support zone! This, at least in the eyes of a technical trader, makes it a difficult market to trade at the moment.
Data points to consider: AUD mid-year economic and fiscal outlook at 1.15am GMT.
Areas worthy of attention:
Supports: weekly channel support extended from the low 0.6827; weekly AB=CD 161.8% Fib ext. point situated at 0.7496; 0.7505; 0.7639.
Resistances: 0.7659; 0.7695-0.7657.
USD/JPY:
Weekly gain/loss: -0.78%
Weekly closing price: 112.58
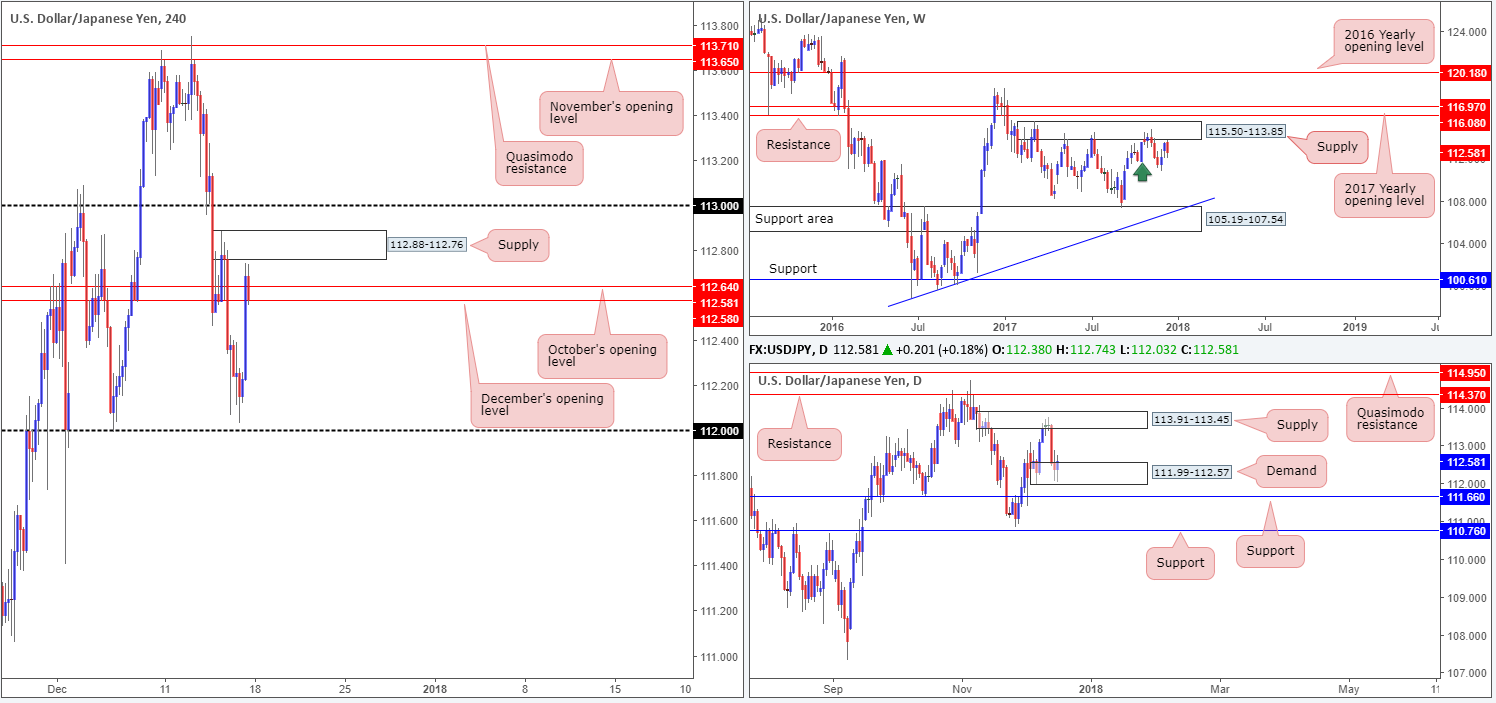
After engulfing the 16/10 weekly low at 111.65 (green arrow) and printing a two-week bullish run, the USD/JPY found active sellers just ahead of a major weekly supply area at 115.50-113.85 during last week’s session. Should the bears remain in the driving seat this week, we do not see a whole lot stopping the pair from eventually dropping as far south as the weekly support area pegged at 105.19-107.54, which joins with a weekly trendline support etched from the low 98.78.
Although weekly price shows promise to the downside, daily action is currently establishing support within the lower limits of a daily demand base at 111.99-112.57. A violation of this area, nonetheless, will, almost immediately, place the daily candles within striking distance of a daily support drawn from 111.66.
Leaving the 112 handle unchallenged on Friday, H4 price, alongside US equities, advanced as the unit entered US trade. Both October and December’s opening levels seen on the H4 timeframe at 112.64/112.58 were taken out, which led to a near-test of the H4 supply zone at 112.88-112.76 being seen.
Market direction:
As is evident from the analysis, weekly price signals further selling might be at hand, whereas daily action is seen respecting a daily demand! Adding to this, we do not see much on offer from the H4 timeframe at the moment. Further downside, at least from where we are sitting, will not be confirmed on this timeframe UNTIL a decisive H4 close is seen below 112.58, potentially opening up the path south down to 112. Having said that, this would only be considered a viable selling opportunity should one be comfortable selling into daily demand!
On account of the above, remaining on the bench today may be the better path to take.
Data points to consider: No high-impacting events scheduled on the docket.
Areas worthy of attention:
Supports: 112 handle; 111.99-112.57; 111.66.
Resistances: 112.58; 112.64; 112.88-112.76; 113.91-113.45; 115.50-113.85.
USD/CAD:
Weekly gain/loss: +0.16%
Weekly closing price: 1.2866
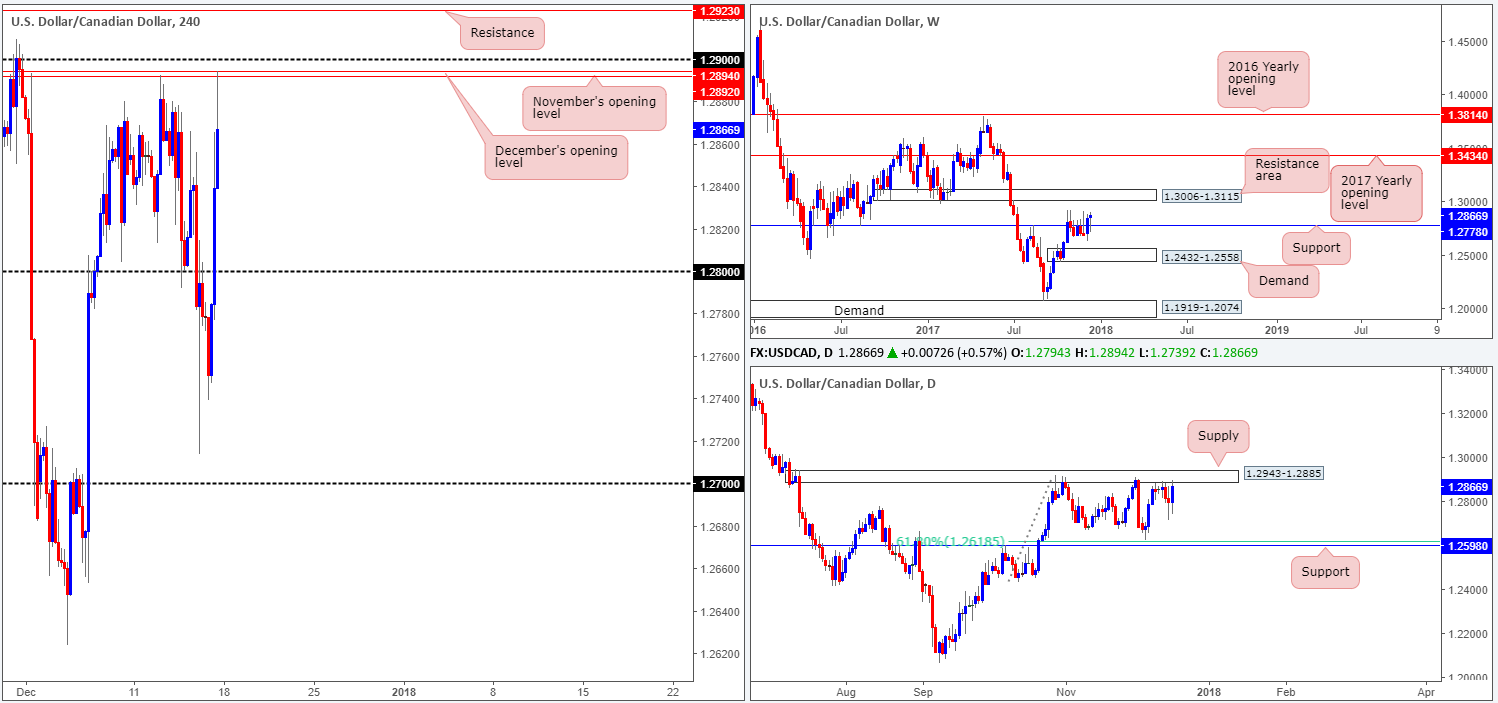
Following a strong near-full-bodied weekly bullish close above weekly resistance at 1.2778, the USD/CAD managed to preserve these gains last week after retesting 1.2778 as support in the shape of a weekly buying tail. Additional buying from this point could see the pair find its way up to a weekly resistance area penciled in at 1.3006-1.3115. However, before this can occur daily price will need to overcome the daily supply area at 1.2943-1.2885. This zone has managed to cap upside on multiple occasions since late October, therefore there is a good chance that history may repeat itself here.
A brief look at recent dealings on the H4 timeframe shows that after the H4 candles chalked in a session low of 1.2739 amid the early hours of London, the unit switched course and turned northbound. Aided by disappointing Canadian manufacturing sales, the pair eventually crossed above the 1.28 handle and shook hands with December and November’s opening levels seen at 1.2894/1.2892 into the close.
Market direction:
It should be clear that entering long on the basis of the weekly buying tail will not likely be a smooth ride up to the aforementioned weekly resistance area. Not only do you have to contend with the noted daily supply, one also has to keep an eye on the said H4 monthly open levels, the 1.29 handle and nearby H4 resistance at 1.2923. To become buyers in this market, waiting for a H4 close/retest to form above the H4 resistance could be an idea. That way, on both weekly and H4 timeframes, the path north should be clear up to the 1.30ish area.
Selling this market in an attempt to fade the H4 monthly open levels and daily supply is also valid, as far as technicals go, as long as one remains cognizant of where weekly price is trading. Downside targets from these lines are the 1.28 handle, followed closely by the aforesaid weekly support at 1.2778.
Data points to consider: Canadian foreign securities purchases at 1.30pm GMT.
Areas worthy of attention:
Supports: 1.28 handle; 1.2778.
Resistances: 1.29 handle; 1.2894/1.2892; 1.2923; 1.2943-1.2885; 1.3006-1.3115.
USD/CHF:
Weekly gain/loss: -0.25%
Weekly closing price: 0.9899
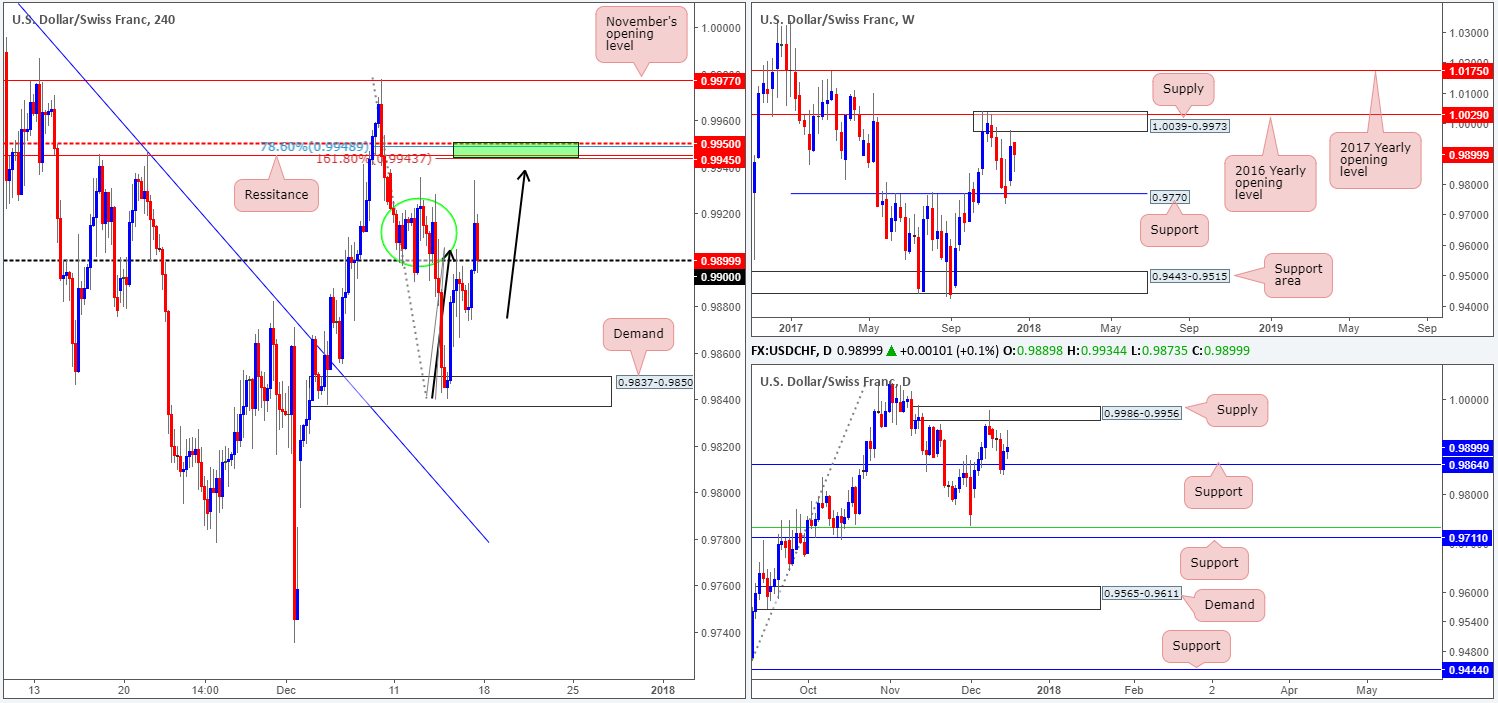
The USD/CHF concluded the week marginally lower, down 26 pips all in all. From a technical point of view, the recent bearish tone was likely brought on thanks to weekly price responding from the underside of a weekly supply base at 1.0039-0.9973 the week prior. Though, we have to admit, last week’s end-of-week buying tail is a little concerning given downside indicates room for the unit to trade as far south as weekly support drawn from 0.9770.
Daily support at 0.9864 managed to survive in spite of a minor breach to the downside seen on Wednesday. Daily price rallied strongly from here on Thursday, but failed to maintain momentum on Friday, thus forming a selling wick a few pips ahead of a daily supply coming in at 0.9986-0.9956.
A closer look at price action on the H4 timeframe highlights that Friday’s movement managed to conquer the 0.99 handle and strike a session high of 0.9934, before pulling back and retesting 0.99 at the close. In Friday’s morning report, we highlighted that the unit will likely have trouble cutting through 0.9925/0.99 (green circle), as this area represents a solid base of previous price action.
Market direction:
To the upside, H4 price displays a nice-looking H4 zone of resistance around the 0.9950/0.9942 range (green area). There are a number of technical aspects that support this view:
- A H4 mid-level resistance at 0.9950.
- A H4 78.6% Fib resistance at 0.9948.
- A H4 AB=CD (black arrows) 161.8% Fib ext. point at 0.9943.
- A H4 resistance at 0.9945.
- The underside of the daily supply seen just above this area at 0.9956.
Given point 5, a fakeout through the H4 resistance area is possible so do be prepared for this. In the event that this area of H4 resistance is tested today/this week, and holds ground, 0.99 will likely be the first port of call, followed by the daily support mentioned above at 0.9864.
Data points to consider: No high-impacting events scheduled on the docket.
Areas worthy of attention:
Supports: 0.99 handle; 0.9864.
Resistances: 0.9950/0.9943; 0.9986-0.9956; 1.0039-0.9973.
DOW 30:
Weekly gain/loss: +1.33%
Weekly closing price: 24648
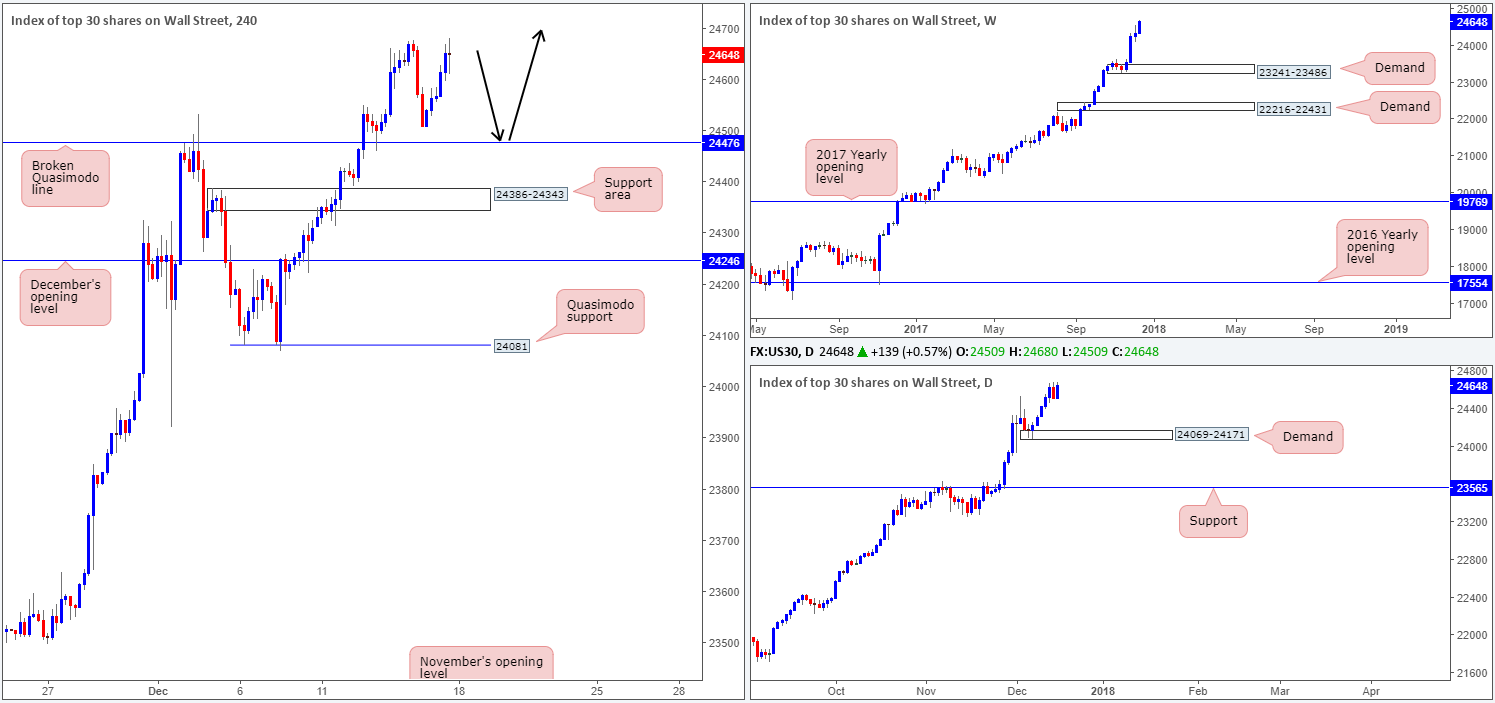
US stocks printed a fourth consecutive gain amid last week’s sessions, registering a fresh record high of 24680. According to the weekly picture, price would have to pullback over 1000 points before the closest area of support can be seen: a weekly demand zone at 23241-23486. Moving Down to the daily timeframe, we can see that there is a closer area of support in the form of a demand base coming in at 24069-24171.
Leaving the broken H4 Quasimodo line at 24476 unchallenged on Friday, the index rallied north. Led by technology and financial gains, H4 price marginally snapped Thursday’s high 24676.
Market direction:
With 24476 still a proven support level (the retest seen in the early hours of Wednesday), one may want to keep a tab on this level today/this week for a possible second retest. Thanks to Friday’s advance, there is also likely a strong base of stop-loss orders lurking beneath 24506 (Thursday’s low). These are, assuming H4 price declines, ripe for the taking since filling these orders help provide liquidity for bigger players to buy from the noted broken H4 Quasimodo line (remember a buyer’s stop-loss order, once filled, becomes a sell, and to buy into a market, sellers are required).
Data points to consider: No high-impacting events scheduled on the docket.
Areas worthy of attention:
Supports: 24476; 24506; 24069-24171; 23241-23486.
Resistances: …
GOLD:
Weekly gain/loss: +0.53%
Weekly closing price: 1254.8
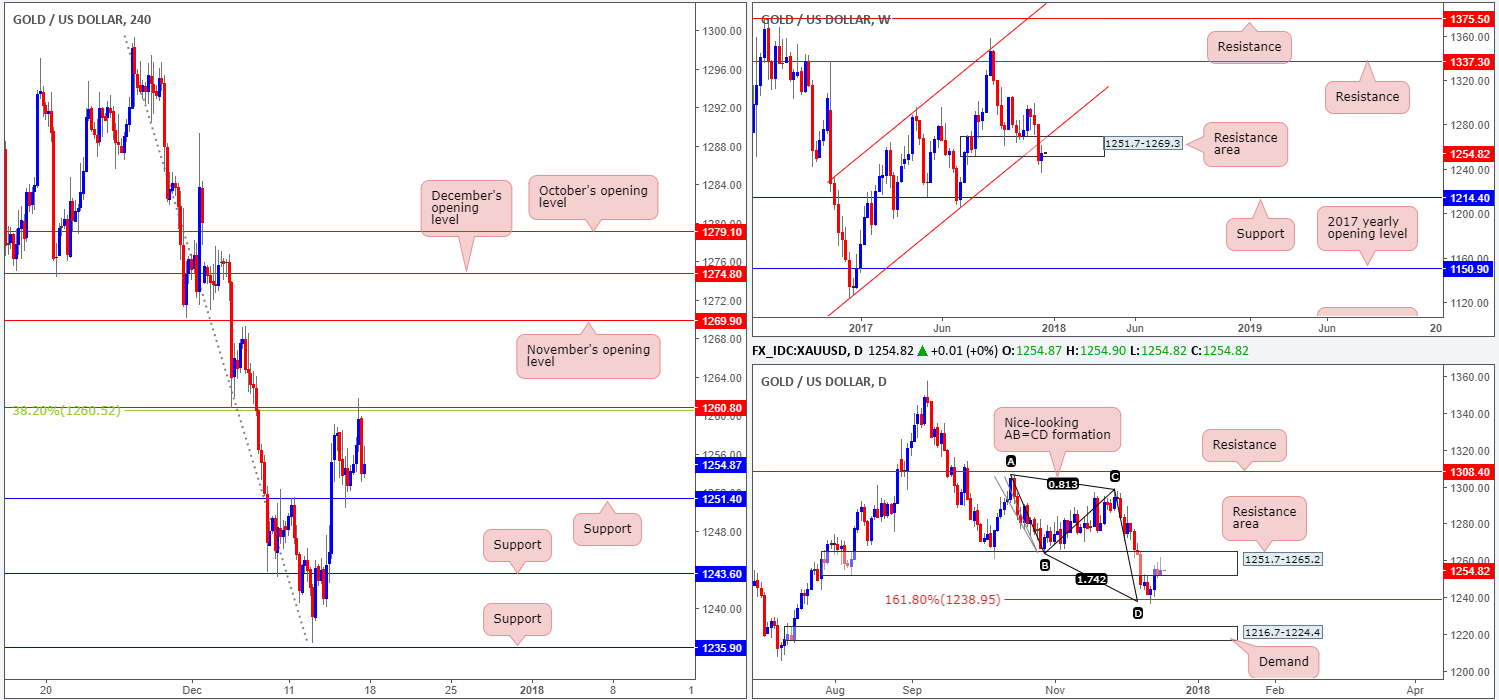
Both weekly demand at 1251.7-1269.3 and the weekly channel support extended from the low 1122.8 suffered a decisive break two weeks back. In previous reports, we highlighted that this area would likely offer some resistance to the market with it having been a reasonably strong base of demand in the past. Last week’s action shows price actually retested the underside of the area, but other than a mild end-of-week correction, there has been little to report thus far. However, should the sellers slip into second gear this week, we could see weekly price begin to drive down towards a weekly support level at 1214.4.
The bounce from the daily AB=CD 161.8% Fib ext. point at 1238.9 attracted fresh buying in recent trade, pushing the daily candles back up to a daily resistance area coming in at 1251.7-1265.2. Traders might have also noticed that surrounding this daily zone is the larger resistance area mentioned above on the weekly timeframe. Mid-week trading saw the daily candles begin printing selling wicks from within the daily area, which could, technically speaking, portend a selloff this week.
Moving over to the H4 timeframe, a test of the H4 resistance at 1260.8 was seen going into the early hours of Friday’s US session. This was a highlighted level in Friday’s morning report given that it fused nicely with a 38.2% H4 Fib resistance at 1260.5 and is positioned within the aforesaid weekly/daily resistance areas. Well done to any of our readers who managed to take advantage of this move!
Market direction:
While both weekly and daily structure point to a possible selloff this week, shorting into a H4 support level seen at 1251.4 is, we personally believe, not considered a high-probability trade. For that reason, it might be an idea to wait for this H4 barrier to be engulfed/retested before considering a sell. That way, the path south is likely clear down to at least H4 support at 1243.6, followed then by the daily AB=CD 161.8% Fib ext. point mentioned above at 1238.9.
Areas worthy of attention:
Supports: 1251.4; 1238.9.
Resistances: 1251.7-1269.3; 1251.7-1265.2; 1260.8.


