A note on lower timeframe confirming price action…
Waiting for lower timeframe confirmation is our main tool to confirm strength within higher timeframe zones, and has really been the key to our trading success. It takes a little time to understand the subtle nuances, however, as each trade is never the same, but once you master the rhythm so to speak, you will be saved from countless unnecessary losing trades. The following is a list of what we look for:
- A break/retest of supply or demand dependent on which way you’re trading.
- A trendline break/retest.
- Buying/selling tails/wicks – essentially we look for a cluster of very obvious spikes off of lower timeframe support and resistance levels within the higher timeframe zone.
- Candlestick patterns. We tend to only stick with pin bars and engulfing bars as these have proven to be the most effective.
We search for lower timeframe confirmation between the M15 and H1 timeframes, since most of our higher-timeframe areas begin with the H4. Stops are usually placed 5-10 pips beyond confirming structures.
EUR/USD:
Weekly gain/loss: – 226 pips
Weekly closing price: 1.0970
Weekly opening price: 1.0968
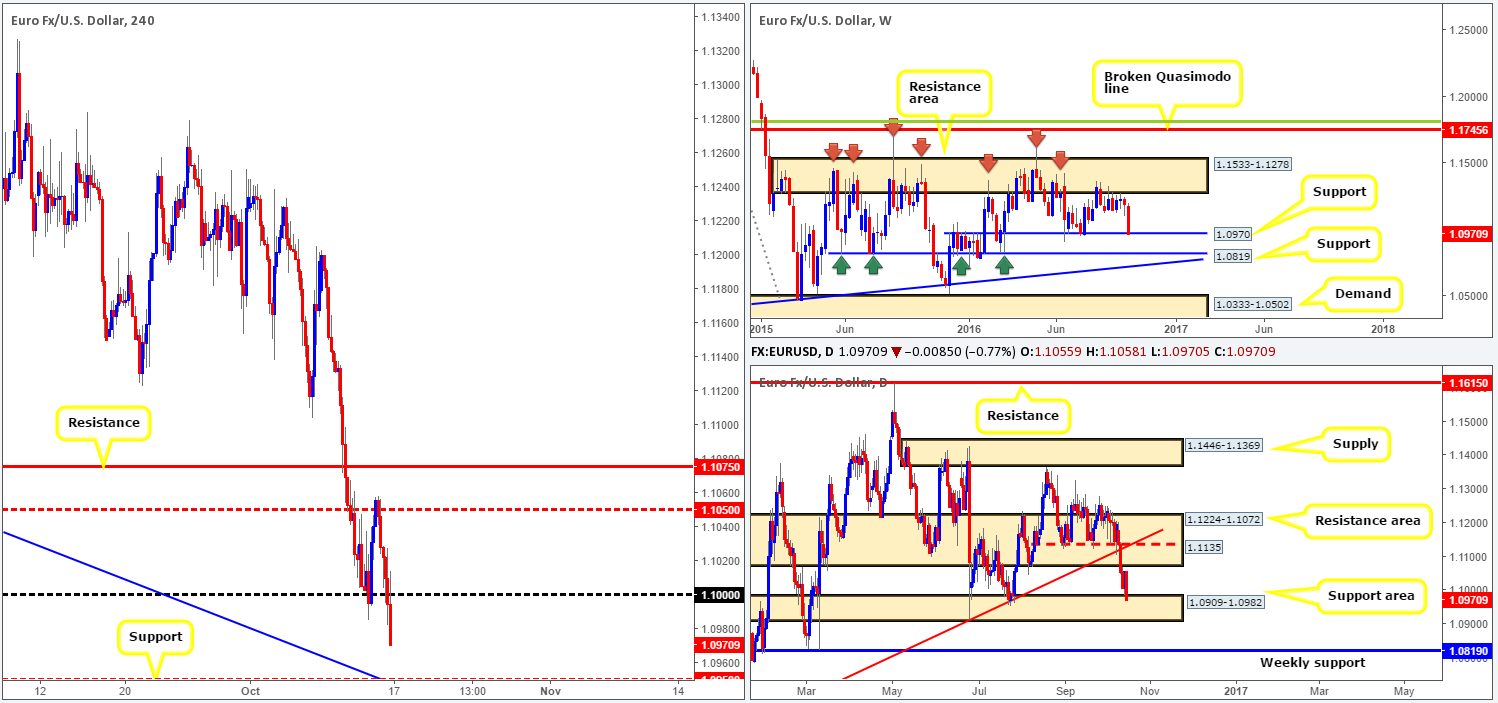
Weekly view: Following two months of choppy price action around the lower boundary of a major resistance area seen at 1.1533-1.1278, the common currency fell sharply last week. As a consequence, this forced the candle to shake hands with a support level coming in at 1.0970 by the week’s end. In that this line stretches back to Dec 2015, we feel there’s a chance that a rotation back to the upside may be seen from this barrier this week. Conversely, however, should a break through this level come into view this would likely place the support hurdle at 1.0819 in the firing range.
Daily view: In conjunction with weekly price, the daily chart also reveals that the pair is now seen crossing swords with a support area formed at 1.0909-1.0982. The important thing to consider here is the fact that this zone houses the above noted weekly support level at 1.0970, thus likely providing the market with a solid floor of bids to tussle with this week.
H4 view: A quick recap of Friday’s sessions on the H4 chart shows the candlesticks topped out around the mid-way resistance 1.1050 during the early hours of trading. As price began to selloff into the London segment, we saw a mixed response to US retail sales and consumer sentiment data at 12.30pm, as price steadied itself around the key figure 1.10. However, a few hours later, 1.10 was taken out and shortly after retested as a resistance going into Fed Chair Yellen’s speech at 5.30pm GMT.
Direction for the week: While the bears did exhibit strong bearish intentions last week, we cannot ignore what higher-timeframe structures are telling us. Both the weekly and daily charts display strong ‘support’. With that being the case, until these areas are engulfed, we are bullish for the time being at least until price challenges the underside of the daily resistance area at 1.1072.
Direction for today: As 1.10 was recently wiped out the H4 support level at 1.0948 (not clearly shown) is now likely the next level of interest. With this number having been a considerable support/resistance level in the past, and also seen fusing nicely with a H4 mid-way support 1.0950 and a H4 trendline support extended from the high 1.1186, this level is, in our book, worthy of center stage attention today.
Our suggestions: Quite frankly, the only level we’d consider worthwhile at the moment is the aforementioned H4 support level. Not only because of the H4 confluence, but also due to where it is located in the bigger picture: within the above said daily support area. As a result, our team has placed an alert around the 1.0950 region. If triggered, we’ll be watching the lower timeframe action closely for signs of bullish direction. A break above a supply followed by a retest, a trendline break/retest or simply a collection of well-defined buying tails around the 1.0950 neighborhood would, in our opinion, be sufficient enough to condone a long entry from here, targeting 1.10 as an initial take-profit zone. Generally speaking, we search for lower timeframe confirmation between the M15 and H1 timeframes, since most of our higher-timeframe areas begin with the H4. Stops are usually placed 5-10 pips beyond confirming structures.
On the data front, nonetheless, we have EUR CPI data at 9am, followed by the ECB President Mario Draghi speaking at the European Cultural Day in Frankfurt at 5.35pm GMT. Therefore, remain vigilant during those times.
Levels to watch/live orders:
- Buys: 1.0950 region ([lower timeframe confirmation required prior to pulling the trigger] Stop loss: dependent on where one confirms this area).
- Sells: Flat (Stop loss: N/A).
GBP/USD:
Weekly gain/loss: – 250 pips
Weekly closing price: 1.2179
Weekly opening price: 1.2155
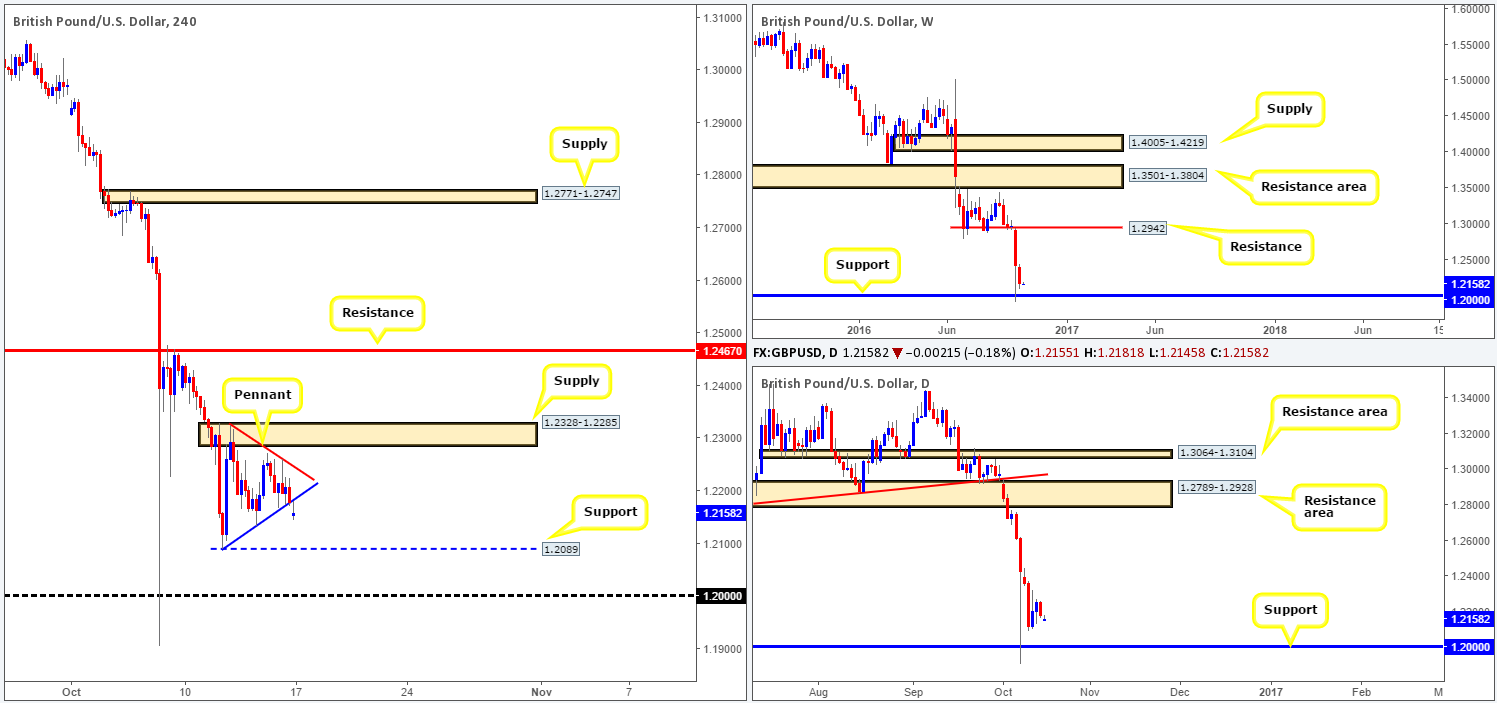
Weekly view: Over the last week we saw the pound deteriorate further into the red. Overall this market has, apart from one week back on the 26/09, been a declining pair for seven consecutive weeks! And, to make things worse, the technicals signal further selling is very possible in the week ahead down to the 1.20 neighborhood.
Daily view: Besides cable bottoming out around the 1.2089 region, there is not much difference seen between this chart and the weekly. To the upside, the next barrier of interest comes in at 1.2789-1.2928: a resistance area that sits directly below a weekly resistance at 1.2942. Meanwhile, to the downside, 1.20 is also the next available support.
H4 view: Looking at Friday’s action on the H4 chart reveals that price spent the week chalking up a relatively nice-looking bearish pennant formation (1.2342/1.2089). Beyond this pattern, nonetheless, there’s a support seen drawn from 1.2089 and a supply coming in at 1.2328-1.2285.
Direction for the week: In that the unit remains entrenched within a clear downtrend at present, as well as both the weekly and daily structures signaling further downside to 1.20 may be on the cards, we remain firmly in the sellers’ camp this week.
Direction for today: As can be seen from the H4 chart, this morning’s opening candle gapped 25 pips south and broke below the above said pennant edge. Should Asia continue to hold the pair lower this morning, once Europe/London (the more liquid sessions) gets under way we could see the major attack support at 1.2089.
Our suggestions: In the event that we’re able to pin down a lower timeframe sell entry at the underside of the recently broken H4 pennant (see the top of this report for lower timeframe entry techniques); our team would consider selling down to 1.2089. On top of this, assuming that 1.2089 is consumed sometime this week, this would, in our estimation, be considered an early bearish cue that price is headed for the 1.20 mark, and thus give traders the opportunity, should this level be retested as resistance, to sell again.
There’s little UK data scheduled for release today other than a speech from MPC member Broadbent at 2.45pm.
Levels to watch/live orders:
- Buys: Flat (Stop loss: N/A).
- Sells: Keep an eye on lower timeframe action around the underside of the recently broken H4 pennant formation. (Stop loss: dependent on where one confirms this area).Watch for a close below 1.2089 and look to trade any retest seen thereafter ([lower timeframe confirmation required] Stop loss: dependent on where one confirms this level).
AUD/USD:
Weekly gain/loss: + 29 pips
Weekly closing price: 0.7613
Weekly opening price: 0.7620
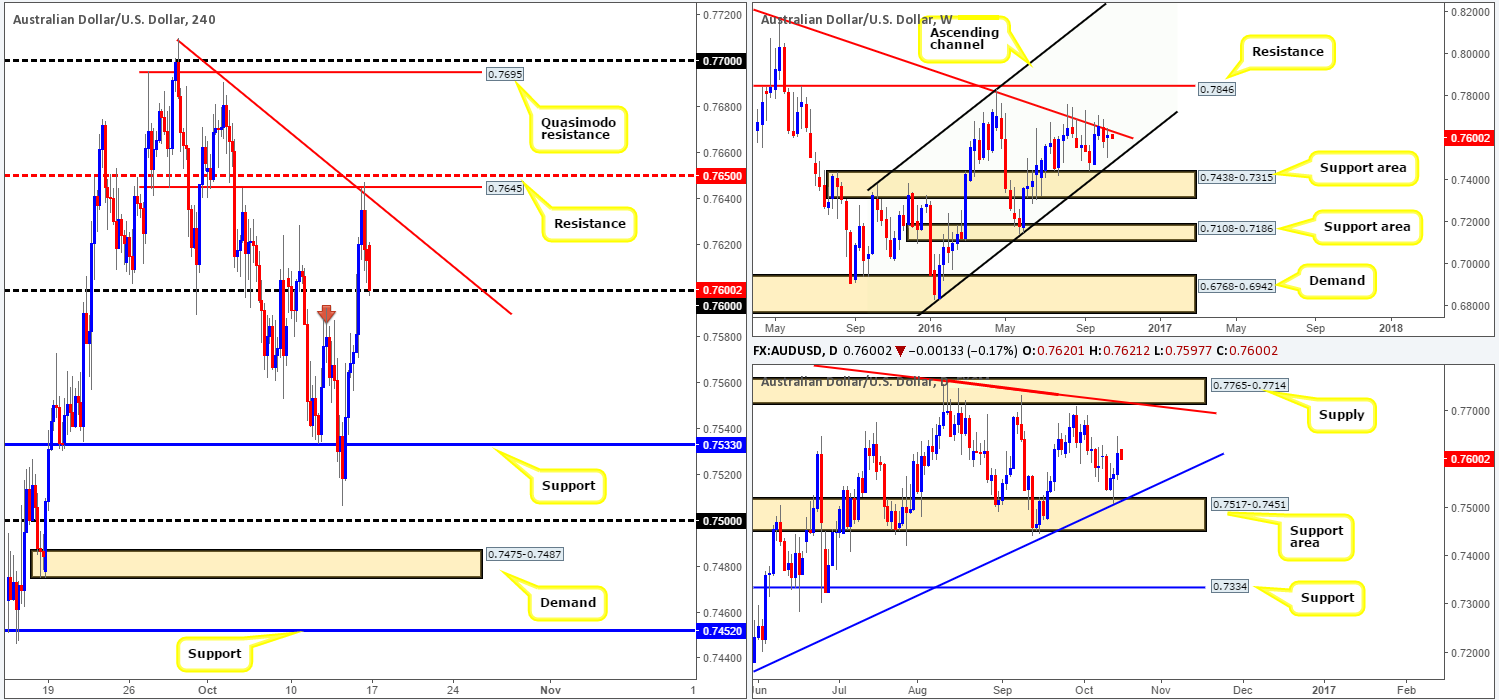
Weekly view: Despite the commodity currency ranging close to 150 pips during the week, the pair ended up closing relatively unchanged. As is evident from the weekly chart, the market is in a somewhat compressed state right now. Capping upside since early May 2015, there’s a trendline resistance seen taken from the high 0.8295. Capping downside since late May 2016, we have an ascending channel support line seen extended from the low 0.6827. A break lower would immediately land price within striking distance of a support area drawn in at 0.7438-0.7315, while a break higher could portend further upside towards resistance coming in at 0.7846.
Daily view: Turning our attention to the daily candles, the currency is, at least from our perspective, currently trading mid-range between a supply seen at 0.7765-0.7714 and a support area at 0.7517-0.7451. Technically speaking, we firmly believe both areas carry equal weight. Both zones boast trendline confluence (0.6827/0.7835) and have proved to be areas that can hold ground over the long term.
H4 view: A brief look at recent dealings on the H4 chart shows that the Aussie surged higher on Friday, consequently taking out the round number 0.76 and connecting with resistance penciled in at 0.7645. In view of the trendline confluence and mid-way resistance 0.7650 seen here, price rebounded from this resistance barrier going into the US session, and, as a result, trimmed gains into the close.
Direction for the week: In light of weekly price trading nearby a trendline resistance (see above), and daily structure providing little direction (mid-range – see above), our team has come to a general consensus that the more likely path is south this week according to the technicals.
Direction for today: In that price is now seen nibbling at bids around the psychological number 0.76, we feel this level may be soft and on the verge of giving way, due to the weekly picture. The combined H4 support and H4 Quasimodo support at 0.7533 would be an ideal target for shorts below 0.76. However, we have to be prepared for the possibility that the unit may stall around the recently broken highs (now support [red arrow]) at 0.7587.
Our suggestions: Considering the above points, a close below 0.76 today warrants particular attention. Even more so should we see price retest the underside of this number as resistance and print a H4 bearish candle. In the event that this comes to fruition, our team will look to short the pair, targeting 0.7533 as our immediate take-profit zone. As for one’s stop loss, we would advise placing it either above the H4 trigger candle or the 0.76 handle.
Levels to watch/live orders:
- Buys: Flat (Stop loss: N/A).
- Sells: Watch for a close beyond the 0.76 handle and look to trade any retest seen to the underside of this boundary ([H4 bearish close required following the retest] Stop loss: ideally, beyond the trigger candle).
USD/JPY:
Weekly gain/loss: + 129 pips
Weekly closing price: 104.18
Weekly opening price: 104.35
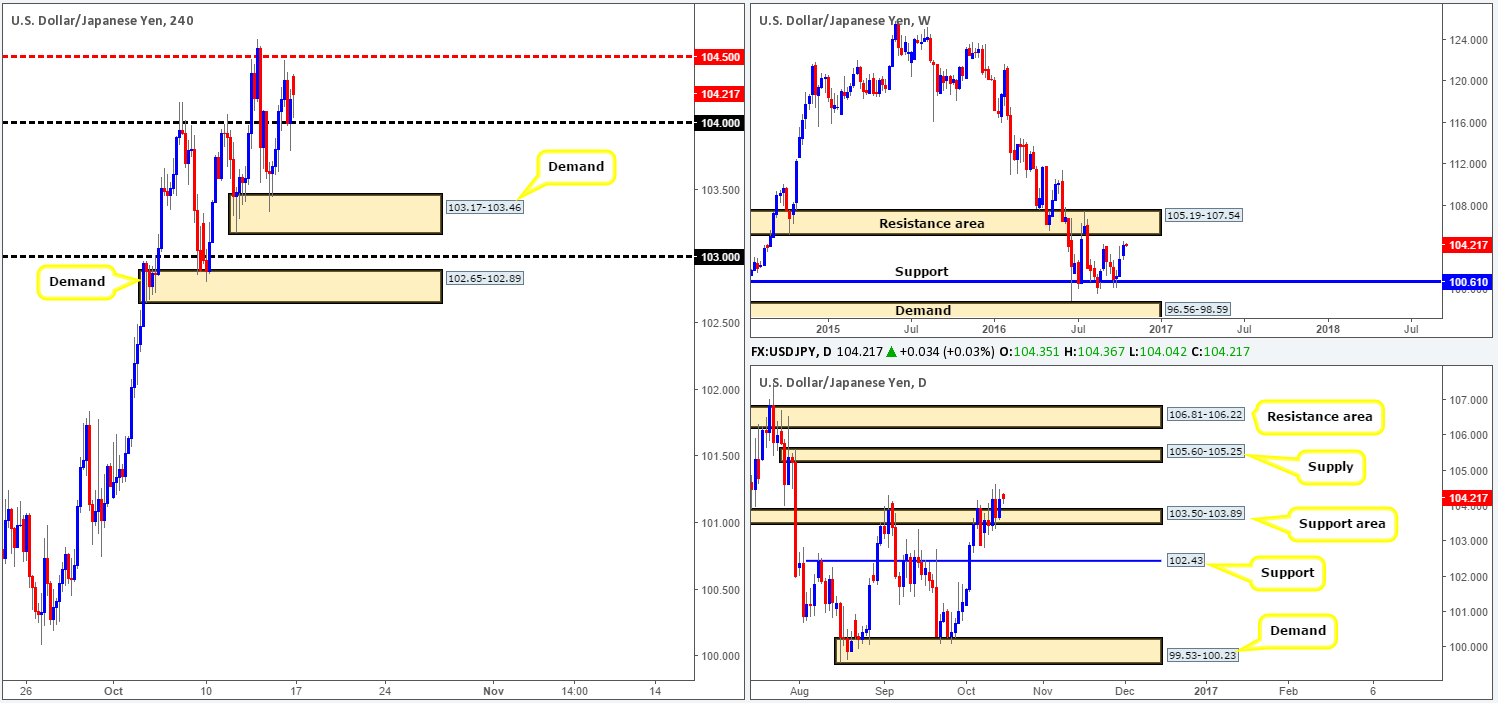
Weekly view: The market enjoyed another relatively successful week, posting its third weekly consecutive gain. In consequence to this, we recently saw the weekly candle breach highs chalked up on the 29/08 around the 104.32ish range, which effectively could set the stage for further upside this week towards a resistance area seen at 105.19-107.54.
Daily view: The story on the daily chart shows the candles recently closed above a resistance area chiseled in at 103.50-103.89 (now acting support). While this is considered a bullish signal, we have to take into account that there’s three relatively clear bearish selling wicks that have took shape above this support area. Although this collection of selling wicks would, in the right location, usually be treated as a bearish cue, the support area along with weekly action is evidence enough to invalidate these wicks, in our opinion.
H4 view: In-line with higher-timeframe structures, we can see that Friday’s closing candle managed to catch a reasonably healthy bid from the 104 boundary. Overhead, nearby resistance lies at 104.50: a mid-way level, and below the 104 neighborhood there’s a demand zone seen at 103.17-103.46.
Direction for the week: As far as the higher-timeframe structures are concerned, we’re likely heading higher this week at least until the pair collides with the underside of the aforementioned weekly resistance area.
Direction for today: It’s unlikely that the H4 candles will breach the 104 handle. Given this factor, the H4 mid-way resistance level at 104.50 may see some action going into the more liquid sessions today.
Our suggestions: As we hope is clear from the above analysis, our team favors further upside. With that said, we would look to trade long from 104 assuming price retested this barrier and printed a lower timeframe buying signal (see the top of this report for lower timeframe entry techniques). Initially, we’d look to target 104.50, followed by the 105 handle, which would be our final take-profit zone, as by that point, one is nearing the underside of both the aforementioned weekly resistance area and daily supply at 105.60-105.25 (positioned within the lower limits of the weekly zone).
Levels to watch/live orders:
- Buys: 104 region ([H4 bullish close required] Stop loss: ideally, beyond the trigger candle).
- Sells: Flat (Stop loss: N/A).
USD/CAD:
Weekly gain/loss: – 156 pips
Weekly closing price: 1.3137
Weekly opening price: 1.3115
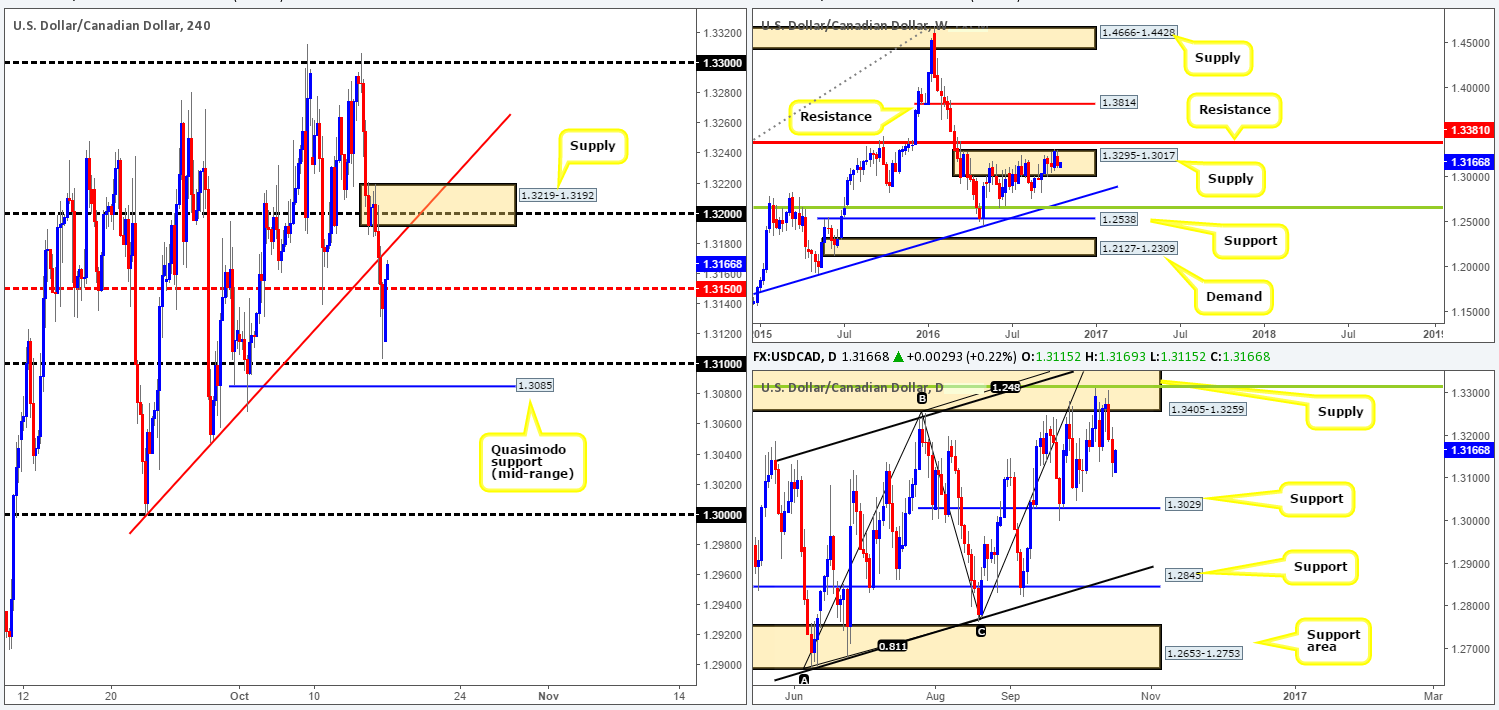
Weekly view: Following a small break through the top edge of supply at 1.3295-1.3017, the bears responded by driving the currency lower last week, resulting in price chalking up a bearish inside candle formation. The next downside target from this angle can be seen at a trendline support extended from the high 1.1278. However, should the weekly supply fail to hold, traders should be prepared for price to visit resistance registered at 1.3381.
Daily view: After missing the 38.2% Fib resistance at 1.3315 (seen housed within supply at 1.3405-1.3259) by a cat’s whisker, both Thursday and Friday’s sessions pushed south. On the assumption that further selling is seen this week, we’ll be eyeing the support level drawn from 1.3029 as the next area of significance.
H4 view: The picture on the H4 chart shows that price broke through trendline support taken from the low 1.30 on Friday and closed below mid-way support 1.3150. Thanks to a 20-pip gap south this morning, a fresh pocket of bids were filled just ahead of the 1.31 handle, and has, as you can see, resulted in the unit whipsawing back above 1.3150.
Direction for the week: On the grounds that the weekly candles remain firm within supply at 1.3295-1.3017 right now, we would not be comfortable entering long this week and as such believe we’ll see the market end the week in the red.
Direction for today: Granted, the H4 candles do appear relatively bullish at this time. However, with a H4 trendline resistance (1.30) seen just overhead, followed by a H4 supply which converges with the 1.32 handle at 1.3219-1.3192, the buyers will likely struggle to trade beyond these zones.
Our suggestions: Either look for shorts around the above said H4 trendline resistance or the H4 supply. Both areas are valid given the position of price on the weekly timeframe. Nevertheless, to be on the safe side, we would advise waiting for at least a H4 bearish candle close before looking to risk capital.
Levels to watch/live orders:
- Buys: Flat (Stop loss: N/A).
- Sells: Watch for a H4 bearish close off the H4 trendline resistance taken from the low 1.30 (Stop loss: ideally, beyond the trigger candle). 1.3219-1.3192 ([H4 bearish close required] Stop loss: ideally, beyond the trigger candle).
USD/CHF:
Weekly gain/loss: + 132 pips
Weekly closing price: 0.9901
Weekly opening price: 0.9900
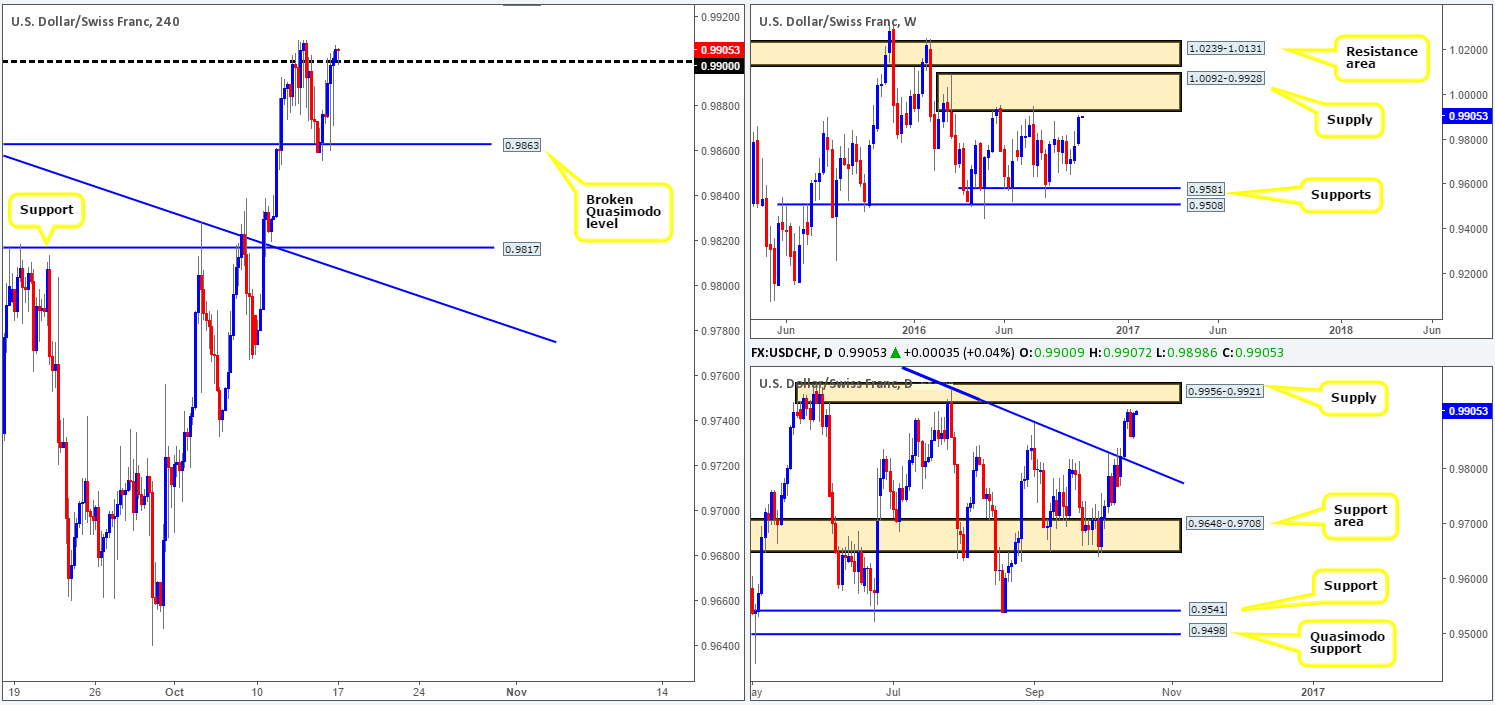
Weekly view: Since the beginning of May, the pair has been consolidating between a supply zone painted at 1.0092-0.9928 and a support band drawn from 0.9581. As you can see on the chart, however, the weekly candle is now seen trading within shouting distance of the underside of the aforementioned supply base. As price was pushed lower from this area on two recent occasions (30/05 and 25/07), we feel history has a good chance of repeating itself here this week.
Daily view: Zooming in and looking at the daily candles, price topped out just ahead of a supply zone coming in at 0.9956-0.9921 last week. In view of this area being glued to the underside of the above said weekly supply base, we feel this daily zone will (if price connects with this barrier of course) hold prices lower from here.
H4 view: The Swissy started the day around the psychological barrier 0.99, which came after a relatively strong push to the upside on Friday from a broken Quasimodo level penciled in at 0.9863. For the time being, bids appear to be defending 0.99, potentially opening up the path north towards 0.9927: a very interesting Quasimodo resistance level (not seen the chart).
Direction for the week: As evident from the higher-timeframe charts, there’s scope for a small push north this week. However, once the daily supply area at 0.9956-0.9921 is tagged into the action, we would hold fire on any long setups since the candles will likely turn red from thereafter.
Direction for today: As we said above, 0.9927 is an interesting Quasimodo resistance line. This is due to it connection with the underside of both the weekly supply at 0.9928 and daily supply at 0.9921. Therefore, we feel 0.99 will hold firm and force price to challenge 0.9927 sometime today, which, in our opinion, has a good chance of reversing price.
Our suggestions: Put simply, we have placed a pending sell order at 0.9926 with a stop set above daily supply at 0.9960. Ultimately, we’ll be looking for price to close beyond 0.99 from here and work its way back down to the aforementioned H4 broken Quasimodo line support. This setup also coincides beautifully with the EUR/USD (an inversely correlated market) long setup (see the top of this report), where we advised to hunt for longs around the 1.0950 region.
Levels to watch/live orders:
- Buys: Flat (Stop loss: N/A).
- Sells: 0.9926 ([pending order] Stop loss: 0.9960).
DOW 30:
Weekly gain/loss: – 97 points
Weekly closing price: 18143
Weekly opening price: 18143
Weekly view: From a weekly viewpoint, the index is seen capped between a resistance line seen at 18365 and a support barrier drawn from 17977. If this support is consumed, the support area at 17446-17606 would likely be the next objective to reach. A push above the resistance level on the other hand, could signal that the bulls are ready to strike fresh highs and continue trading northbound.
Daily view: On Tuesday last week a decision was made. Price broke below trendline support extended from the low 15501 and went on to cross swords with a broken Quasimodo line at 18018, which, as you can see, held firm. A break below this level, however, would likely see the DOW strike a nearby fresh demand at 17710-17863.
H4 view: After price aggressively whipsawed through the trendline resistance taken from the low 17959 on Friday, the unit headed south, clocking a low of 18127 by the day’s end. Although support at 18066 looks relatively nice for longs today, the more attractive zone, in our opinion, is sitting below at 17999: a minor Quasimodo support level. Not only does this line sit nearby the weekly support at 17977, but it also is located just below the aforementioned broken daily Quasimodo line.
Direction for the week: With weekly support in the firing range along with a daily broken Quasimodo line, we find it difficult to see price breaking beyond these barriers this week. With that being the case, a rally is more likely.
Direction for today: H4 support at 18066, as we have already mentioned, is not the most attractive area for longs. Therefore, we might see the H4 candles stretch lower today to plug into the above noted H4 minor Quasimodo support, before rotating to the upside.
Our suggestions: Should price jab into the 17999 H4 level today, entering long from this region is high probability. Despite this, to avoid the possibility of a fakeout here, we’d recommend waiting for at least a H4 bullish close to be seen prior to pulling the trigger.

Levels to watch/live orders:
- Buys: 17999 ([H4 bullish candle required prior to pulling the trigger] Stop loss: beyond the trigger candle).
- Sells: Flat (Stop loss: N/A).
GOLD:
Weekly gain/loss: – $5
Weekly closing price: 1250.2
Weekly opening price: 1250.2
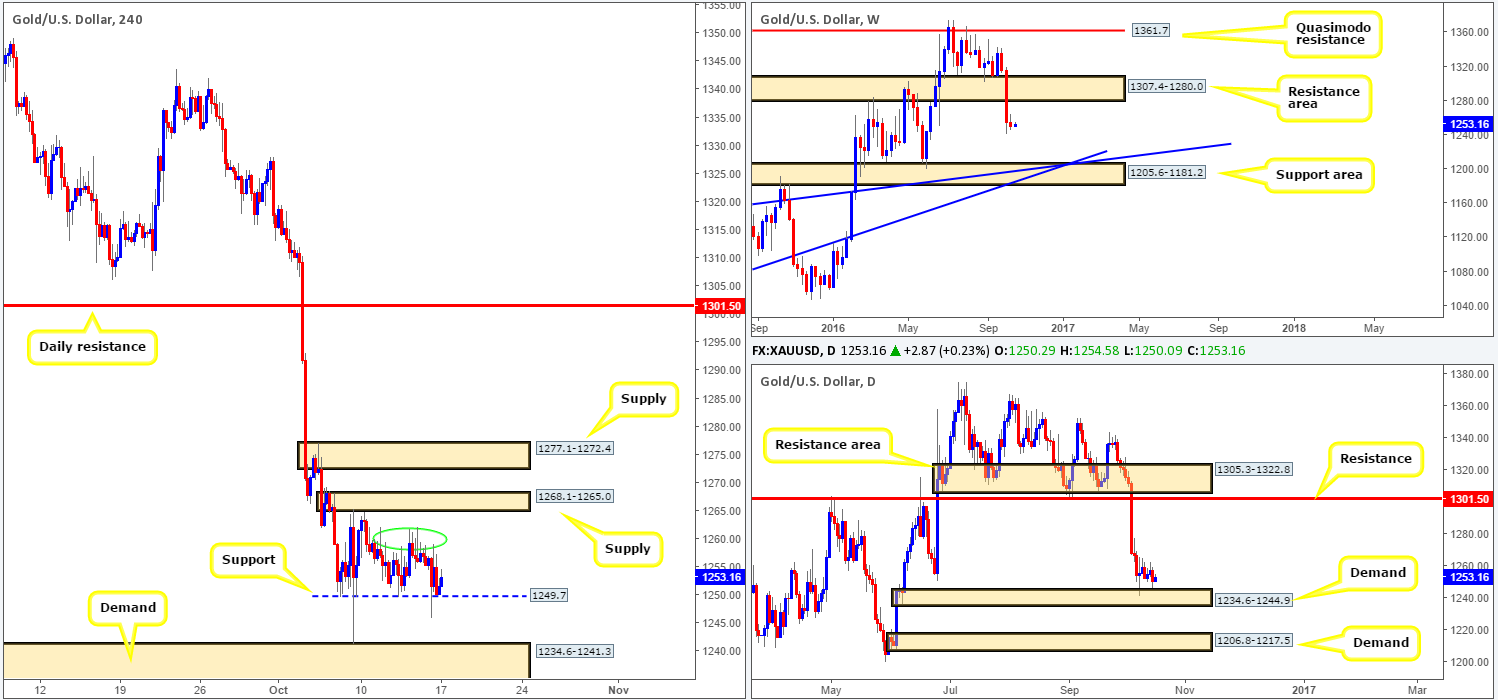
Weekly view: In comparison to the prior week’s range, last week’s action was relatively stagnant. Given that the support area at 1307.4-1280.0 has now been consumed, and given the strength of the break, this could set the stage for a continuation move south this week down to the support area logged in at 1205.6-1181.2, which happens to converge nicely with two trendline supports (1130.1/1071.2).
Daily view: Although the weekly chart shows potential for a continuation move south, daily candles remain afloat above demand drawn in at 1234.6-1244.9. It will only be once we see this demand base taken out, will the metal be free to drop down to another demand coming in at 1206.8-1217.5, which sits directly on top of the above said weekly support area.
H4 view: Since the 6th October, the gold market has been trading from a minor support line seen at 1249.7. Should this current H4 support give way, the next target beyond here is demand coming in at 1234.6-1241.3 (positioned within the current daily demand area). In the event that the bulls continue to bid price north from here, the next area of interest for us falls in at 1268.1-1265.0: a supply zone.
Direction for the week: This still depends on how the daily buyers handle themselves around the above said daily demand. Supposing that they’re able to hold ground and push higher, weekly action may be forced back up to retest the recently broken support area.
Direction for today: Market direction for today’s action is tricky as it could swing either way. Buying from the current H4 support boundary would not only place one in direct conflict with potential weekly sellers, but there’s also a lot of wood to chop through seen between the H4 1261.0/1258.0ish region (green circle), before reaching the aforementioned H4 supply. In regard to selling, yes, there’s a little room for price to retest the top edge of H4 demand at 1234.6-1241.3 beyond 1249.7, but selling here knowing that you’re shorting into daily demand, even though the weekly candles look set to extend lower, is not something we would feel comfortable participating in.
Our suggestions: Very similar to last week’s report, in the absence of clearer price action, we have decided to remain flat for the time being.
Levels to watch/live orders:
- Buys: Flat (Stop loss: N/A).
- Sells: Flat (Stop loss: N/A).